Mechanistic investigations of photo-driven processes over TiO2 by in-situ DRIFTS-MS: Part 1. Platinization and methanol reforming
Received
17th April 2009
, Accepted 10th June 2009
First published on
26th June 2009
Abstract
There is growing interest in the reforming of methanol and other bio-oxygenates as high-density, CO2-neutral, renewable sources of H2. Photocatalysis is worthy of investigation as a potentially economic means to drive such endothermic processes. In this study, in-situ DRIFTS, adapted for optical pumping and coupled to on-line MS, was used to observe the surface of TiO2 (Degussa P25) during photo-metallization from pre-sorbed hexachloroplatinate, at a nominal Pt loading of 1 wt%, and to evaluate photo-reforming of methanol over the resulting Pt/TiO2 composite. The irreversible growth of a quasi-continuum absorption, characteristic of the surface plasmon resonance of zerovalent Pt nanoparticles, along with bands at 2050 and 1830 cm−1 typical of metal-adsorbed CO, indicated that photo-metallization was complete typically within 2 hours. Methanol reforming was photocatalyzed at room temperature but in low quantum efficiency, ϕ ≈ 0.01. However, this was raised substantially, to ϕ ≈ 0.07, simply by the application of mild heating (T ≤ 70 °C). Photo-reforming proceeded at a fixed rate but the H2/CO2 ratio generally exceeded that of the reforming stoichiometry, suggesting some retention of CO2. The photo/thermal synergy was rationalized by model DRIFTS studies, starting from formalin (hydrated formaldehyde), which revealed key features of the mechanism. TiO2 promoted the Cannizzaro disproportionation in the dark, yielding formate and methoxy species already at 40 °C. While methoxy was effectively cycled back to the initial photo-dehydrogenation stage, the slow step was identified as formate decomposition to H2 and CO2. The low value measured for the apparent activation energy (∼40 kJ mol−1) was taken as supporting evidence for ‘water-assisted destabilization’ of formate, as originally reported by Shido and Iwasawa. No evidence was found for an alternative thermal- or photo-reforming mechanism involving the Pt–COad species.
Broader context
Bio-alcohols will be important fuels in bio-refineries. As energy-dense liquids, they offer the handling advantages of gasoline while also being renewable and CO2-neutral. Furthermore, they are amenable to “fuel processing” by steam reforming, which yields two extra benefits. The H2-rich gas product is renowned for its clean combustion properties and/or for efficient electricity generation in fuel cells (FC). The reforming process itself results in a substantial increase in exergy, which is being exploited as “chemical recuperation” in advanced turbine technology. This work shows that methanol can be photo-reformed under mild conditions, rendering it more compatible with low temperature FCs. A simple field test might use a cheap, low-power solar concentrator to provide both the photon flux and the modest heating required to create a H2 buffer, in a suitably-adapted stationary unit, for start-up purposes. The photo/thermal synergy should impact on various photocatalytic processes that are currently too slow for technical application based solely on UV light activation. Any benefits accruing in the more complex and energy-demanding process of ethanol reforming are under study. Ultimately, the key breakthrough needed in photocatalysis is sensitization of stable, wide-band-gap, oxide semiconductors like TiO2 to visible light without compromising their redox properties.
|
Introduction
Polymer electrolyte membrane fuel cells (PEMFCs) run on hydrogen at 60–80 °C, generate electricity efficiently, virtually free of emissions, and offer high power densities for a wide range of applications.1–3 Unfortunately, the economic storage of pure hydrogen at high volumetric (or weight) energy density remains an elusive goal, and is a serious impediment in the transition to a future H2 economy. Storage densities in conventional alloys and inorganic hydrides have improved but do not yet approach the DOE target of 6.5 wt% H, a level considered realistic for commercial development.4 In contrast, a liquid oxygenate like methanol contains incipient hydrogen at ∼12.5 wt% and is generating serious interest per se as the next chemical vector after petroleum.5 One reason is that methanol is compatible with the existing (oil-based) distribution infrastructure. However, until advances in the direct methanol fuel cell (DMFC) raise its efficiency towards that of the hydrogen fuel cell (HFC),1–3,6,7 the alcohol must be reformed to H2 and CO2 in an endothermic reaction with steam:| | | CH3OH + H2O ⇔ CO2 + 3H2 [ΔH0 = +131 kJ mol−1] | (1) |
Oxygenates are ideal hydrogen carriers in the sense that, in thermodynamic terms, they can be reformed under much less severe conditions than hydrocarbons.8 Nevertheless, most catalysts, including commercial Cu/ZnO/Al2O3,9–11 are only active in methanol reforming above 200 °C. Thus, integrating the reformer with the (low-temperature) PEMFC already introduces heat management issues. Further complications arise due to contamination of the reformate mixture by CO, a severe poison of the (Pt-based) FC anode, necessitating inclusion of a PROX reactor to oxidize selectively traces of CO present in a large excess of H2.9,12 Both problems would be alleviated if reforming was viable at lower temperature. The rapidly growing field of “fuel processing” for fuel cells of various kinds has been comprehensively reviewed.13
Although currently made from natural gas, methanol will be one important target fuel in future bio-refineries.15–18 Biomass and carbon-based municipal solid wastes may be gasified to syngas, which is then converted to methanol by established catalytic technology. Better catalysts and processes for tar removal from ‘bio-syngas’ are under intensive development.19–23 An alternative and complementary carbon-neutral industrial source of renewable methanol would be to react H2 with recycled CO2, i.e., the reverse of eqn 1. The technical know-how for such ‘renewable petrochemistry’ already exists;14 including suitable catalysts and processes for overcoming equilibrium limitations.24–26
Apart from conventional steam treatment, Dumesic's group in Wisconsin have recently developed a low-temperature pressurized liquid process known as aqueous-phase-reforming (APR), and demonstrated the effectiveness of skeletal Ni catalysts, inter alia, on a variety of high-boiling polyols and related bio-oxygenates.8,27–29 The general stoichiometry of bio-oxygenates conversion may be written as:
| | | CnHmOk + (2n − k) H2O ⇔ nCO2 + [2n + m/2 − k]H2 | (2) |
Elsewhere, Schmidt's
group has shown that even concentrated
glucose solution is convertible to syngas (CO/H
2) at high-temperatures over supported Rh in a ‘reactive flash volatilization’ process at extremely short residence time.
30
In view of the high energy demand associated with all reforming processes, it is of interest to explore photocatalysis as an alternative mode of activation. Energy from photons is capable of driving uphill reactions even at ambient temperature, e.g., photosynthesis. Whereas water photo-splitting has been studied intensively over the last 30 years, photo-reforming is a relatively unexplored method for deriving renewable H2 from biomass extracts,31 including glucose.32 Photo-dehydrogenation of primary alcohols over Pt/TiO2 in the liquid phase has already been well studied by Pichat's group.33–36 While conversion is limited to the aldehyde product and an equimolar amount of H2:
| |  | (3) |
the reaction has a high quantum efficiency (
ϕ ≥ 0.5 for
methanol) and is mildly endergonic. More recently, photo-reactor tests on various metallized TiO
2 samples
37–39 have indicated that both alcohols
reforming and WGS may be promoted by band-gap (UV) irradiation. Furthermore, such a low temperature process may yield a product containing substantially less CO, thereby improving its compatibility with the HFC.
8,9
Among a wide range of spectroscopic techniques now available for catalysis studies, not many probe the catalyst surface under process conditions in real time. In the mid-1980s, one of these authors (JH) applied photoacoustic spectroscopy (PAS) in a simple dual-beam arrangement for in-situ studies.40,41 Long-lived photochromism was discovered in TiO2 characteristic of free carrier (electron) absorption. Its intensity and decay kinetics are a strong function of surface properties and ambient atmosphere, features that have clear implications for photo-driven interfacial redox chemistry. Ohtani's group42,43 has recently applied PAS to measure surface defect densities on TiO2, and have reported a transient absorption feature linked to surface-trapped holes, likely paired up in the form of µ-peroxy species.
A natural extension of this approach is to gain more mechanistic detail in the photocatalytic process by identifying intermediates in-situ from their vibrational spectra. Photoacoustic (PAS) and Diffuse-Reflectance (DR) cells provide infrared absorption spectra from opaque and powdered samples. PA offers high sensitivity due to its ‘zero background’ advantage and even depth-profiling capability in step-scan mode.44 Nevertheless, diffuse-reflectance infrared Fourier-transform spectroscopy (DRIFTS) is now preferred in gas/solid studies due to its greater amenability for in-situ work.45 Attenuated total reflectance (ATR-FTIR) is a rapidly emerging technique for related studies at the liquid/solid interface.46 DRIFTS spectroscopy offers, inter alia, real-time identification of adsorbed intermediates, in which their kinetic and mechanistic relevance can be probed by reactive titration.47 It also monitors the ambient gas composition and the surface state of the underlying solid (catalyst). Conventional transmission through supported thin films and pressed wafers achieves closer matching of pump (UV) and probe (FTIR) penetration depths. This results in more representative analysis but at the expense of sensitivity.48 Only DRIFTS simulates a plug-flow reactor arrangement. It is far from ideal in terms of temperature definition (vide infra), but this issue is marginal in photocatalysis. An excellent demonstration of its power is the pioneering work of Hoffmann's team.49 Their discovery of the analogous infrared continuum (free-electron-like) absorption in irradiated TiO2, and measurements of its decay kinetics have confirmed that long charge carrier lifetimes are a genuine feature of this powdered semiconductor. A pronounced Stark effect was also reported, viz., shifts in the vibrational frequencies of surface hydroxyl groups in the vicinity of deep and shallow electron traps.50 Elsewhere, the value of a well-designed DRIFTS set-up is evident from studies of photo-oxidation of ethanol and acetone over TiO2.51
This paper illustrates the value of applying DRIFTS (with mass spectrometry) to monitor various photo-induced reactions over Degussa P25, a popular reference titania. Photo-metallization from a pre-sorbed hexachloroplatinate complex is followed by studies of methanol photo-reforming over the resulting 1% Pt/TiO2 composite. At a recent conference52 this same spectroscopic methodology was termed, quite correctly, ‘pump–probe’. However, confusion arises since this refers, by convention, to the application of a rapidly alternating excitation/observation sequence, typically using pulsed lasers with ultra-high time resolution, to identify short-lived excited states. In contrast, our work employs illumination sequences over minutes or hours, with periodic interruption acting as (dark) controls. The effects of this quasi-continuous regime are exemplified by Pt metal nanoparticle creation in the presence of methanol and simultaneous development of Pt–adsorbed CO. We also report the discovery of an important photo/thermal synergy. Formaldehyde, the initial photo-product, undergoes the Cannizzaro disproportionation to formate in the dark. The formate subsequently decomposes during modest heating. This offers the prospect of complete photo-reforming of alcohols to H2 and CO2 under remarkably mild conditions.
Experimental
DRIFTS/MS equipment and layout
The experimental layout depicted in Fig. 1 was unusual in that the plumbing for the DRIFTS/MS work (⅛ inch Swagelok) was tapped from a pre-existing TG-FTIR coupled system, which has been described in detail elsewhere.53,54 In the absence of liquid pumps and vaporizers, it takes advantage instead of the carrier gas mass-flow controller and furnace of the Setsys 12 thermobalance (Setaram) to deliver reactant(s) at variable rates and target vapour pressure(s). The lines were heat-traced and maintained at 100 °C (Digi-Sense®, Cole Parmer Instr.).
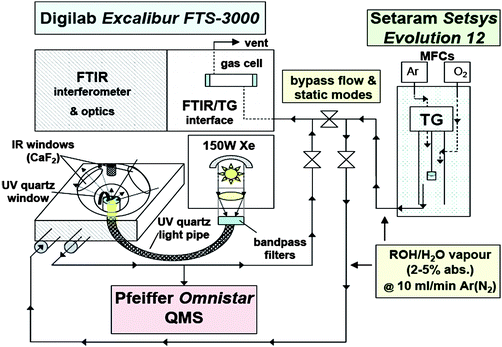 |
| | Fig. 1 Schematic layout of set-up for DRIFTS/MS studies of photocatalysis. | |
The DRIFTS set-up consisted of a heatable reaction cell (HVC-DRP, Harrick Scientific) mounted into a Praying Mantis (Harrick Scientific) optical accessory, located in the front sample compartment of an Excalibur FTS-3000 FTIR spectrometer (Varian Inc.). The reaction cell was fitted with a pair of CaF2 windows for incident and remitted IR radiation, and a quartz observation window for optical pumping from an Oriel 150W Xe DC short arc lamp (Apex Illuminator mod. 66450, Newport, Oriel Instr.). The source beam was directed through a focusing lens assembly (mod. 7776) to converge onto the entrance face of a 1 metre high-grade fused silica optical fibre bundle (mod. 77578). The guided light was then directed onto the sample via a focusing beam probe (mod. 77646), positioned and clamped to provide a spot size of ∼1 cm2. Using a low-pass filter and a flat-band radiometer (Melles Griot), the integrated UV power incident on the sample was determined as ∼15 mW. A quadrupole mass spectrometer, QMS (Omnistar, Pfeiffer Vacuum) with pumped capillary inlet for on-line analysis at 1 bar was placed at the vent of the DRIFT cell.
Unlike other commercial accessories,55 the HVC-DRP offers superior gas/solid dynamics approximating a plug-flow configuration, and 100% conversion is attainable. However, it suffers from axial and radial temperature gradients.47 To alleviate this problem a fritted disk was inserted to reduce the bed depth to ∼2 mm. For improved temperature definition, preliminary checks were made on the demounted base in the open laboratory at a control temperature of 200 °C. The use of a 2nd probe thermocouple showed that the supporting metal surfaces were almost isothermal at ∼70 °C, while the top/centre position of the powdered bed was at ∼60 °C. A portable infrared radiometer gave a mean sample temperature of ∼65 °C. A static gas temperature of ∼90 °C was estimated from the relative increase in Ar pressure after cell isolation at ambient, heat soak for at least one hour and instantaneous measurement of the increase in MS response.
Methodology
Samples were pre-saturated in degassed reactant vapour before isolation for photocatalysis testing in static mode. The excess vapour reached a steady-state level typically after 30 min, as indicated by the integrated area under their infrared markers. The real-time value of the derivative weight loss (dTG) immediately prior to cell isolation enabled a fair estimate of the amount contacted, based on an enclosed volume of ∼25 ml, as estimated from a prior check of the cell volume by filling with water and weighing. The total amount was taken as the sum of the “actively-adsorbed” component and excess vapour, as regulated by suitable adjustment of carrier flow and vaporization temperature of liquid suspended in the balance crucible. The first was estimated assuming monolayer uptake on the available surface of a typical catalyst charge of ∼30 mg as P25 TiO2, i.e., ∼1.5 m2. Taking the respective molecular adsorption cross-sections56 of methanol and water as ∼22 and ∼13 Å2, this corresponded to ∼0.36 mg (≡ 0.25ml STP) in each case. The excess vapour levels contacting the sample under isolation were typically kept low (< 5% vol), both to maintain acceptable transmission for reliable analysis (OD < 1), and to minimize the risk of obscuring DRIFTS signals of adsorbed species on the underlying catalyst. Under these conditions, the vapour component was ∼4x greater than the adsorbed fraction, giving a total reactant dose sufficient for ∼5 molecular turnovers on the support, or at least 35 at the metal surface. Supply of co-reactants at the 1:1 reforming stoichiometry (eqn 1) required ad hoc dilution of the liquid alcohol to compensate for differences in vapour pressure. For example, methanol diluted ten-fold and vaporized at 36 °C in an Ar flow of 10 ml/min delivered ∼4 vol% of each component.
Time-resolved DR spectra were stored every minute over the range 6500–1000 cm−1 at 4 cm−1 resolution (KBr beamsplitter, DTGS detector) using the kinetics mode of the Resolutions Pro 4a software. Spectroscopic ‘markers’, i.e., integrated areas under molecule- or functional group- specific IR bands, were also created as convenient visual indicators of reaction progress (see Appendix). Gas-phase reference spectra for methanol, formic acid, CO, CH4, CO2, etc., were obtained over KBr powder, a good reflectance standard with negligible adsorptive properties apart from water affinity (hygroscopic). KBr was also used to create high-quality reference spectra for data display in the Kubelka-Munk formalism. The marker set was augmented heuristically with bands (and assignments) characteristic of reactants and intermediates adsorbed on TiO2. Formaldehyde was problematic due to its rapid hydration to methanediol. However, in view of its mechanistic importance (vide infra), reference spectra of the diol [CH2(OH)2] and its partially dehydrated polymer, dioxomethylene [–(CH2O2)–], were obtained by evaporation from aqueous formaldehyde (commercial formalin).
By incorporating a ‘closed’ needle valve (as restrictor) in the QMS inlet line, accurate periodic sampling of the gas phase (typically during 5 minutes, once per hour) was accomplished in static mode without excessive depletion of pressure, thereby assuring representative analysis. The MS was pre-calibrated for masses 2 and 44 with synthetic mixtures of products in the working range 1–10 vol% H2 and 0.5–5 vol% CO2 in Ar, respectively. Consumption of methanol was monitored at masses 31 & 32, and CH4 and CO formation at masses 15 and 28, respectively. The QMS was also used to verify the Ar gas quality (< 50 ppm O2) and an acceptable leak rate (< 0.002% O2 per hour) under all static test conditions.
Results and discussion
Since it was first reported,57 UV irradiation of rare metal complexes in contact with wide band-gap oxide semiconductor powders like TiO2 has become a popular, effective, and convenient method to create uniform zerovalent metal crystallites in the nanometer size range.58–64 The mechanism of photo-metallization probably involves both direct photolysis and a photo-redox cycle triggered by charge carrier generation and migration to the substrate surface. It works for presorbed complexes or even via direct photodeposition from the contacting solution. The decomposition of chloroplatinate in liquid environment may be written, following Herrmann et al.65 as:| |  | (4) |
Fortuitously, methanol is known to be more readily photo-oxidized than water, and is routinely used as an electron donor or ‘hole scavenger’. Thus, irradiation was made here in the presence of methanol vapour acting as a source of H. This involves a combination of dissociative adsorption in the dark and H abstraction from adsorbed methoxy by a photo-generated surface hole:| | | CH3O−ad + h+ → HCHO + H· | (6) |
In a gas/solid environment, evolution of HCl would be expected and a peak at mass 36 in the QMS was indeed observed. DRIFTS revealed the development of two new infrared features, both of which were diagnostic of metallization. As shown in Fig. 2a, UV illumination induced the growth of a continuum absorption intensifying towards higher frequencies. This was an irreversible change as it did not fade in the dark. Thus, it could not be attributed to free, or partially trapped, charge carriers; neither small polaron (electron) absorption40 in TiO2 peaking at ∼12,000 cm−1, nor the infrared spectral variant reported by Hoffmann et al.49,50 It was assigned instead to the low frequency tail of a surface plasmon resonance absorption peaking in the ultraviolet, associated with very small Pt nanoparticles. PAS spectra of similar form across the visible–near-infrared region have already been reported in Pt/TiO2, where the mean particle diameter of Pt was determined as ∼2 nm.41 By analogy with the photographic process, the electron-trapping properties of metallic atoms and nuclei promote autocatalytic growth into the nanometre size range. At the same time, however, the UV component of the plasmon resonance absorption acts as a deleterious ‘inner filter effect’, attenuating the light flux for useful band-gap irradiation in the semiconductor. This is one probable cause of the commonly observed maximum in photoactivity with metal loading. A quite unexpected feature in Fig. 2a was the growth of a band at ∼2050 cm−1 characteristic of CO adsorbed on metallic Pt nanoparticles.66–68 Expanding the region of interest for clarity (Fig. 2b) shows the main band characteristic of CO adsorbed on Pt in the “on-top” position, initially at ∼2030 cm−1 but shifting progressively to higher frequency due to well-known coverage-dependent dipolar coupling effects.66 It also showed a broad low frequency band at 1830 cm−1 attributable to triply-coordinated CO. The same feature has already been seen in analogous SNIFTIRS studies of methanol electro-oxidation at a Pt electrode.69Fig 2b further showed a weak band at ∼1750 cm−1, characteristic of the carbonyl stretch in formaldehyde. The apparent bathochromic shift in the bending vibration of adsorbed water away from ∼1630 cm−1 is probably illusory. Although complete desorption of water was never seen at any temperature in the reforming mixture (vide infra), competitive adsorption by methanol, present here in excess, may constitute a more powerful displacement mechanism. The 1600 cm−1 band is more typical of an adsorbed carbonate photo-product.70,71Fig. 3 shows that growth of the continuum and the Pt–COad band were temporally related, each reaching a limit after 1–2 h of illumination. The best interpretation, supported by later evidence (vide infra), is that the formaldehyde photo-product (ex. eqn. 6) migrates from TiO2 to a newly-created Pt cluster where it is dissociated into CO and H atoms:| |  | (7) |
Formaldehyde is known to decompose to CO and H2 on a clean Pt surface below room temperature in the dark.72 The high heat of adsorption of CO on Pt, up to −200 kJ mol−1,73 probably acts as a driving force for this endothermic process. However, it must also be recognized that photo-generation of H2 (and HCHO) over pure TiO2 is generally considered to be non-catalytic. Pt is an essential component, effecting proton reduction as below:| | | Pt–H· + H+ + e−→ Pt + H2 | (6a) |
releasing molecular H2 thereby closing the redox photo-cycle.40 The corollary of this view is that formaldehyde is generated photocatalytically on TiO2, but only in the presence of Pt. Purging away methanol and flowing CO (1% in Ar) in the dark caused no further growth in the 2050 cm−1 band, implying that the CO coverage had already reached a full monolayer during photo-metallization.
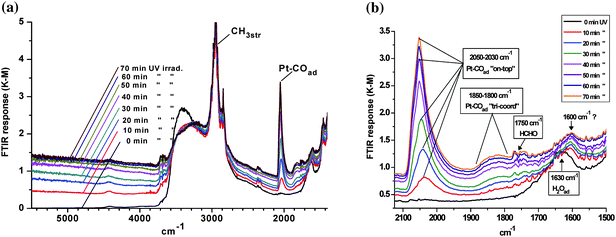 |
| | Fig. 2 DRIFTS spectra during photo-metallization of TiO2 (P25) with PtCl62− (a) wide frequency range; and (b) showing detail of (a). | |
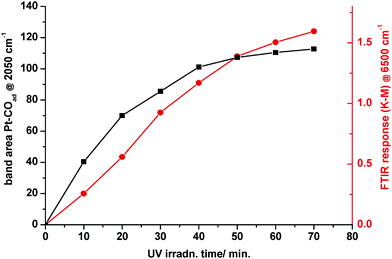 |
| | Fig. 3 Temporal growth of the high-frequency continuum and the Pt–COad band. | |
Reactivity of adsorbed CO
After purging away CO, successive doses of air caused virtually instantaneous and complete elimination of the 2050 cm−1 band, as shown in Fig. 4 (black trace). Between doses, it underwent slow recovery, indicating strong scavenging by Pt of residual CO still present in the system. Sustained exposure to CO (2% in Ar) led to fast and complete recovery of the 2050 cm−1 band. For comparison, photo-stimulated growth of the Pt–COad species on the bare metal in a typical reforming mixture is also shown (red trace). Monolayer coverage was evidently attained but more slowly than from pure methanol or CO gas. No evidence was found for metal-adsorbed CO in the dark, confirming that it did not form directly from methanol but from a photo-product.
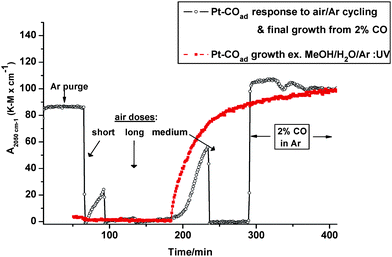 |
| | Fig. 4 Dark reactivity of Pt–COad in air; and its growth in 2% CO/Ar vs. photo-induced growth in aqueous methanol vapour (marked in red) for comparison. | |
Methanol reforming over platinized TiO2
In preliminary experiments with pure TiO2, sequential dosing of methanol and water caused substantial mutual displacement of the pre-sorbed form. Such competitive adsorption of reactants is a complication, but may eventually prove useful as a means to study the effect on catalytic behaviour of their respective coverage, as established at the dosing stage.
a. Illumination at room temperature.
The main DRIFTS feature during illumination of the platinized sample at room temperature was the familiar build-up of Pt–COad, as already shown in Fig. 4. The growth rate was naturally slower than during metallization due to competitive adsorption by water, the inferior hole scavenger. Otherwise, there were few infrared features of note. Some weak bands were seen below 1600 cm−1, hinting at low levels of adsorbed carboxylate species like formate,74 which were subsequently explored in detail (vide infra). However, the distinction between a potentially wide range of co-existent carbonates and/or bicarbonates70,71 was beyond the scope of this work.
Results of on-line MS analysis are shown in Fig. 5. Illumination at room temperature caused slow and sustained production of H2 and CO2 at average hourly rates of 0.138 ± 0.004% and 0.031 ± 0.001%, respectively. The total amounts of H2 and CO2 generated after 22 h were ∼0.75 standard ml (∼35 µmol) and ∼0.17 ml (∼7.5 µmol). This corresponds to a H2/CO2 stoichiometry of 4.5 : 1, exceeding significantly the 3 : 1 value for reforming (see eqn. 1). The CO2 deficit (∼4 µmol) was higher than the maximum conceivable amount of CO adsorbed on Pt (∼1.5 µmol), and no clear evidence was seen in DRIFTS for CO gas. The remaining carbon imbalance (∼2.5 µmol) was ascribed to retention of CO2 on the support (adsorbate capacity of ∼10 µmol – see Experimental), and/or incomplete decomposition of a CO2-yielding intermediate such as formate. From the H2 production rate (∼2.5 × 10¹⁴ molecules s−1), a conservative estimate (lower limit) of the quantum yield was calculated, based on 100% absorption of incident UV photons at an estimated flux of ∼3 x10¹⁶ s−1, taken from the measured power (∼15 mW) and a nominal mean wavelength of ∼350 nm. Assuming one H2 molecule was generated per absorbed photon (electron/hole pair),33 this resulted in an estimate of ϕ ≈ 0.01.
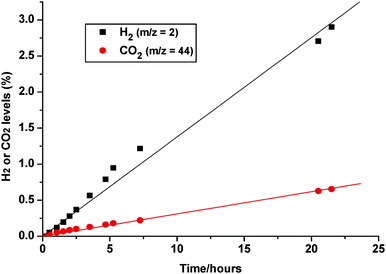 |
| | Fig. 5 QMS response for H2 (m/z = 2) and CO2 (m/z = 44) during UV illumination of 1% Pt/TiO2 in the presence of methanol/water vapour (∼1 : 1). | |
b. Illumination with mild heating.
With some notable exceptions,34,75–80,95 photocatalysis experiments in which the effect of temperature has been explored are very rare. This is surprising in view of the known mechanistic complexity in catalysis, and the possible existence of photo/thermal synergies. While photonic excitation may drive an endergonic process, the overall mechanism will almost certainly involve dark steps. If one of these is rate-determining, it can only be overcome by thermal activation. Surface diffusion, or kinetic inhibition by strongly-adsorbed intermediates (or products) are relevant examples. Evidence of product inhibition on Pt/TiO2, viz., slow desorption of H2 from the Pt surface, has been demonstrated in alcohols photo-dehydrogenation.34
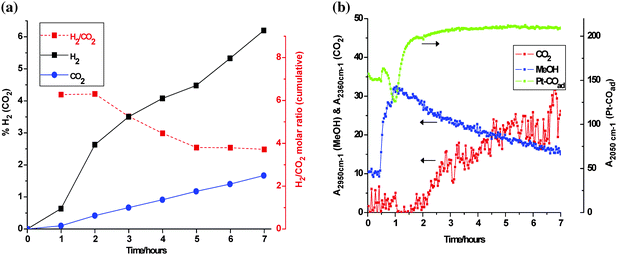
The effect of UV/dark cycling on the rate of methanol reforming over a range of temperature is shown in Fig. 6. A systematic growth in photocatalytic activity was observed up to ∼65 °C, the rate of H2 (CO2) production rising sharply above the initial rate at 25 °C. A distinct increase in the dark rate was also observed above 50 °C, approaching the photo-driven rate obtained just 15° lower. This thermal enhancement was further verified in an extended photo-reforming test at 65 °C. The QMS analysis and some relevant DRIFTS traces are shown in Fig. 7a and 7b, respectively. Illumination was started one hour into the experiment, so the initial readings were representative of dark activity. In the MS, the levels of both reforming products rose significantly under UV, and the H2 : CO2 stoichiometry exceeded 6 : 1. The H2 level (3%, or 35 µmol) after 1 h surpassed that obtained in 20 h at ambient (cf.Fig. 5). Establishment of complete reforming was indicated by a (cumulative) product ratio that gradually approached 3 : 1. The incremental product ratio in the last 2 h was quite stable at 3.7 : 1. The mean production rate of H2 based on the last 3 points was 0.93% per hour, i.e., almost seven-fold higher than that obtained at 25 °C. The associated CO2 production rate increased roughly eight-fold. Thus, the quantum yield was raised to ϕ ≈ 0.07, an encouraging result for a non-optimized catalyst. Further evaluation in a dedicated photo-reactor may show that this is an underestimate. Due to the optical constraints specific to DRIFTS, the enforced topside illumination of a pressed powder layer of ‘infinite thickness’ with respect to scattering is obviously non-ideal.
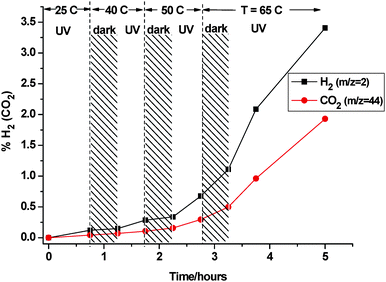 |
| | Fig. 6 QMS response showing cumulative H2/CO2 levels produced from methanol : water vapour (∼1 : 1) at increasing temperature. | |
The DRIFTS marker traces in Fig. 7b show the growth in methanol response during the first hour of dosing and heating in the dark. Upon illumination at 65 °C, the coverage by adsorbed CO actually increased and stabilized above the level already established in the previous UV/heat cycling treatment. If it was an intermediate in photo-reforming, a lower steady-state level would have been expected on the basis of a simple balanced supply/consumption model. However, it is also conceivable that heating may have accelerated the supply step, thereby maintaining coverage close to a monolayer. In any event, the reforming rate showed no obvious dependence on the adsorbed CO level, hinting that the latter is merely a ‘spectator’ species (vide infra). In contrast, the methanol marker dropped to ∼50% of its original level after 6 h, indicating consumption equivalent to ∼25 µg atom as C. This also gave a reasonable material balance for H2 based on the starting levels of reactants. A small amount of CH4 (< 5% relative on a C basis), possibly made by the Sabatier reaction from the accumulated CO2 and H2, was seen in both MS (m/z = 15) and in DRIFTS by its stretching band (Q-branch) at 3015 cm−1. The instability in the CO2 marker was caused by fluctuating background absorption. The Praying Mantis has Perma-purge adaptors, but it is still a semi-open arrangement susceptible to micro-variations in atmospheric contaminant levels. Despite this limitation, growth of CO2 during the consumption of methanol was clearly evident.
Mechanistic investigations
A plausible reaction sequence for methanol photo-reforming must take account of the various observations made in this study, but also remain consistent with relevant literature. It is well established that Pt/TiO2 dispersed in aqueous liquid methanol yields formaldehyde under band-gap irradiation:33–35-| |  | (8) |
The high quantum yield of methanol photo-dehydrogenation (eqn 8; ϕ ≥ 0.5) satisfies the key criterion that any intermediate in the mechanism must be generated at least as efficiently as products in the overall photo-reforming process, which is emphatically the case. Nevertheless, the relative paucity of infrared evidence for in-situ generation of formaldehyde, at least in free form (see Fig. 2b), must be rationalized and its role as primary intermediate elaborated by direct experiment.
Formaldehyde is a highly reactive compound that hydrates rapidly to methanediol (MD) in the presence of water81:
Upon exposure to basic or amphoteric
oxide surfaces, MD partially dehydrates into a polymeric form, –[CH
2O
2]
n–, known as dioxomethylene (
DOM), with a distinct
IR band structure.
82,83 Furthermore,
DOM is implicated as an intermediate in
methanol synthesis,
i.e., almost the reverse of the
reforming process. It has been convincingly shown to yield adsorbed
methoxy and
formate at low temperature by the Cannizzaro disproportionation:
| | | [CH2O2]2 → CH3O + HCOO + Os | (10) |
where O
s is a vacated surface oxygen anion. The overall reaction can be written as:
| | | 2HCHO + H2O → HCHO + CH2(OH)2 → CH3OH + HCOOH | (11) |
Involvement of
water in this process is significant since it constitutes a more viable route to products than
water–gas shift reaction with adsorbed CO. Naturally, this presupposes that the final step in
reforming is
decomposition of
formic acid:
It should be noted that the balance of
eqns. 8,
11, and
12 corresponds to the stoichiometry of full
reforming (
eqn 1).
To assess whether surface chemistry of this kind was operative, Pt/TiO2 was exposed to aqueous formaldehyde and subjected to a step heating program, but in the dark. This effectively decoupled any interference from the low percentage of methanol always present in commercial formalin as a stabilizer. The main changes in DRIFTS are summarized in Fig. 8, showing the spectral region of interest (Fig. 8a) and including related functional group marker responses (Fig. 8b) for clarity. Upon dosing formalin at room temperature, no evidence was seen for free formaldehyde, which has a diagnostic carbonyl stretching band at ∼1745 cm−1. However, the bending vibration of adsorbed water was clear at ∼1625 cm−1. After isolation and heating up to 50 °C, two new bands grew in at 1560 and 1360 cm−1. Control experiments, exposing the pure support (P25) to formic acid, confirmed the assignment of these bands to the asymmetric and symmetric stretch, respectively, of the carboxylate group of formate in bidentate coordination on the anatase surface.74 The sharp peaks in this spectral range (see Fig. 8a) were due to unavoidable interference from the rotational fine structure in the bending vibration of water vapour. Heating beyond 50 °C induced progressive decay of the formate bands. This was most clearly seen in the marker response in Fig. 8b. The concurrent production of gaseous CO2, indicative of formate decomposition, was supported by MS analysis (vide infra). Evidence for retention of adsorbed water up to 65 °C was also seen in Fig. 8a. The same pattern of formate band growth and decay resulted from a (dark) control study, made by dosing formalin over pure TiO2 (P25). This confirmed that the mechanistic sequence from the aldehyde up to, and including, formate decomposition is purely thermal in nature, and that Pt plays no obvious role in this chemistry.
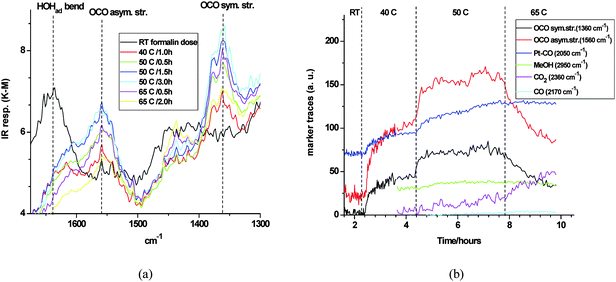 |
| | Fig. 8 (a) DRIFTS detail – heat-induced growth and decay of formate bands on Pt/TiO2 during exposure to formalin in the dark; (b) selected DRIFTS markers response during the same experiment. | |
To prove conclusively that the formate was produced by the Cannizzaro reaction (eqn 11), would require detection of an infrared band of hydrated formaldehyde and its disappearance during formate growth. In fact, a weak band was seen initially at ∼2910 cm−1, and tentatively attributed to the asymmetric CH2 stretch in the linear polymeric form of adsorbed DOM.83 This band indeed disappeared on heating, implying its involvement in formate creation. Unfortunately, establishment of a reliable marker in the presence of the methanol CH3 stretching band envelope was precluded. The potential wealth of IR band structure in DOM below 1200 cm−1 was likewise obscured, here by the rising absorption edge of the intense TiO2 lattice vibration. This appears to a limitation of DRIFTS as compared to the pressed wafer method. However, as supporting evidence for disproportionation, Fig. 8b shows a small but distinct increase in the methanol (co-product) trace at 50 °C. Furthermore, the contemporaneous growth and stability of the Pt–COad band established two pertinent facts. It confirmed that HCHO was indeed the source of adsorbed CO on Pt in the dark. It also militated against the view of an alternative route to formate via adventitious oxidation, e.g., via O-insertion into the aldehyde. The extreme sensitivity of Pt–COad to the presence of O2 has been amply demonstrated.
MS analysis of gaseous products from formalin at 65 °C for both Pt/TiO2 and the pure support, taken through the identical procedure, are shown in Fig. 9. This revealed that significant thermal decomposition was already taking place at 50 °C. The H2 : CO2 stoichiometry reverted from an initial value of 2 : 1 to 1.2 : 1 by 65 °C, i.e., close to that expected from eqn 12. More H2 and CO2 were produced over the platinized sample, hinting at its active involvement in the process. The other important observation was the concurrent generation of CO on both samples, in amount roughly twice as large as H2 or CO2. Application of UV light at 65 °C did not change significantly the conversion rates or selectivities to these products. The low-area DRIFTS trace for CO in Fig. 8b was deceptive, since CO has a relatively weak IR absorption as a gas phase species. It was actually quite consistent with the MS results based on prior IR calibration work. Production of CO may have resulted from special conditions obtaining in this model reaction. The most obvious difference was the relatively high coverage of TiO2 by adsorbed formate, not seen heretofore starting from methanol.
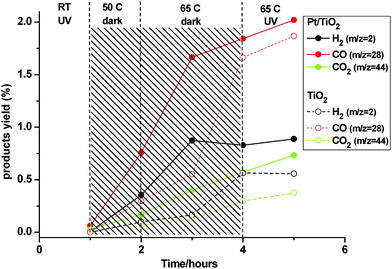 |
| | Fig. 9 MS response at m/z = 2 (H2), 28 (CO), and 44 (CO2) from dark and illuminated Pt/TiO2 (full lines and symbols) and pure TiO2 (dashed lines, hollow symbols) obtained by heating in formalin at various temperatures. | |
There is a substantial body of evidence in the literature suggesting that formate is not only a pivotal intermediate in WGS,84 but also a strong hole scavenger in photocatalysis, being especially useful in photo-deposition of various heavy metal ions.85–87 Formic acid can decompose in either the forward (f) or reverse (r) direction of the WGS shift equilibrium:
| |  | (13a) |
However, it is well-known that excess adsorbed
water or steam can drive the desired (forward) process almost exclusively; not so much by equilibrium control but rather a dramatic acceleration (x100) in the kinetics, as reported over Rh/CeO
2.
88,89 Shido and Iwasawa observed a substantial drop in the
activation energy; from 56 kJ mol
−1in vacuo, to 33 kJ mol
−1 in the presence of
water, and proposed a transition state that included
water coordinated with the adsorbed
formate. This view has gained considerable strength from more recent studies, effectively promoting the fWGS by “steaming” of presorbed
formate.
90–93 Our results appear consistent with such a model in providing even more dramatic evidence for the lability of
formate in the dark. This feature may be indicative of “reactant-assisted” kinetics and attributed to the higher level of adsorbed
water expected below 100 °C. On the other hand, CO as majority product does not fit into this scheme. The discrepancy may arise due to the absence of sufficient
water, after its consumption in the
Cannizzaro reaction (
eqn 11), to direct the fWGS more selectively. This was borne out by model studies exposing Pt/TiO
2 to
formic acid and then to pure
water in sequence. Quite different results were obtained, possibly linked to displacement by
water of some presorbed
formate. The products were mainly CO
2 and H
2, with very little CO. Curiously, CO
2 evolution initially preceded that of H
2, appearing already at 40 °C. However, H
2 generation increased dramatically above 50 °C, such that the WGS (1 : 1) product ratio was gradually approached. This hints at partial accumulation of adsorbed
H on the support and/or metal. No evidence was found for photo-enhancement of the rate at any temperature, a surprising result because
formate is reported to decompose,
via the CO
2 radical anion, to gaseous CO
2 by successive reaction with photo-generated holes:
| | | HCOO− + h+ → CO2·− + H+ | (14) |
This reinforces the view that the presence of
water in the dark is a sufficient condition to destabilize substantially the formate.
The foregoing studies provide a mechanistic scheme that goes a long way to explain the observed photo/thermal synergy. Illumination at room temperature makes the aldehyde and some H2, but formate creation (via the Cannizzarro reaction) and its subsequent decomposition occur very slowly (cf.Fig. 5). Heating alone does not create the aldehyde necessary for the dark stage to proceed. Only a combination of illumination and mild heating can drive effectively the entire sequence from methanol to H2 and CO2.
Despite the coherent picture drawn up thus far, it should be recognized that the model studies were made under conditions not necessarily obtaining in methanol photo-reforming proper. This is especially true in terms of the relative abundance of intermediates in steady-state and evident competition between the various species for adsorption sites. To confirm that the formaldehyde/formate route actually occurs under true reforming conditions, a final test was made in a reactant vapour mixture slightly enriched in methanol (CH3OH : H2O = 2 : 1) in order to improve detection of any intermediates. The DRIFTS and MS results are summarized in Fig. 10 and 11, respectively. The first interesting feature (offset slightly for clarity) was the appearance of weak bands of formate already at room temperature under UV irradiation. The boxes in Fig. 10a are intended as aids to visualize the presence of relatively broad bands underlying the fine structure, whose provenance has already been discussed. During heating the familiar pattern of growth and eventual decay of these bands, already seen in the HCHO model study (cf.Fig. 8), was reproduced. Only the relative intensities were lower as expected. During formate decomposition at 65 °C, a band at ∼1445 cm−1, tentatively attributed to adsorbed bicarbonate, grew in intensity. This is one process that may be invoked to explain the “missing” CO2 in earlier photo-reforming experiments. The slight decay in the formate during the dark interval at 50 °C (Fig. 10b) showed that its supply was interrupted. This implies that the aldehyde disproportionates so rapidly that it cannot accumulate significantly even in steady-state under illumination. The MS analysis further reinforced this conclusion insofar as virtually no H2 was produced during the same dark interval (see Fig. 11). An approximate rate of H2 evolution was estimated from the preceding 2 h under illumination at 50 °C as only 0.25% per hour, while the rate at 65 °C recovered to ∼0.9% per hour, i.e., close to that obtained with stoichiometric levels of reactants (cf.Fig. 7). The apparent activation energy from the (two) methanol reforming tests was determined as ∼40 kJ mol−1. This lay between the two values reported by Shido and Iwasawa but closer to the lower one (∼33 kJ mol−1), suggestive of partial water-assisted formate decomposition. However, just as in the formaldehyde study, a substantial amount of CO was produced, once again attributable to the deficit of water vapour. Measurement of the true level of CO is an analytical problem in that methanol, N2, and especially formaldehyde, contribute at mass 28. Furthermore, a conservative estimate of the detection limit for gas-phase CO in this DRIFTS set-up was 0.1% due to the relatively short optical path inside the reaction chamber. Thus, despite having measured H2/CO2 ratios exceeding the 3 : 1 ratio indicative of complete reforming, no definitive statement can be made as regards carbon product selectivity in the absence of GC analysis. However, from a practical perspective there are enough hints to conclude that CO production will be minimized by working close to stoichiometric or, better yet, in a slight excess of water. The last is actually an established procedure in commercial reformer operation.9,10 A recent advance94 has shown that CO levels can be dramatically reduced by adsorption of sulfate or phosphate ions without affecting the rate of photo-reforming.
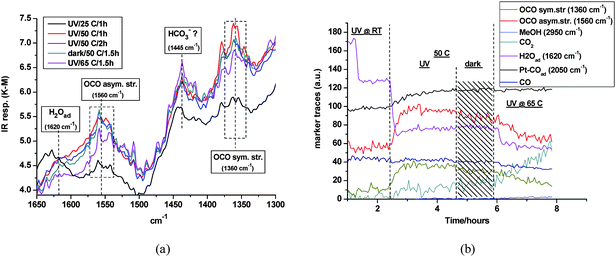 |
| | Fig. 10 (a) DRIFTS detail – combined UV/heat-induced spectral changes during photo-reforming over Pt/TiO2; (b) selected DRIFTS markers response during the same experiment. | |
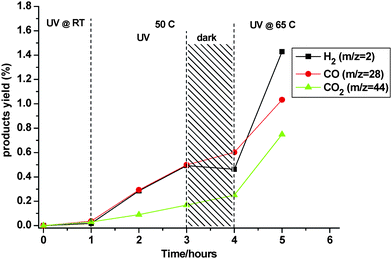 |
| | Fig. 11 MS response for H2 (m/z = 2), CO (m/z = 28), and CO2 (m/z = 44) during UV illumination of 1% Pt/TiO2 in the presence of methanol/water vapour (∼2 : 1). | |
The main unresolved issue is whether adsorbed CO could be involved in a parallel mechanism of photo-reforming of methanol or is merely a spectator species. An alternative 3-step reaction sequence can be posited:
in which evidence is only lacking for the last step, involving
water (or OH) in the forward
water–gas shift. However, tests at various CO pressures were inconclusive both in the dark and under illumination. Even starting from conditions favouring co-reactant adsorption on Pt,
viz., sub-monolayer amounts of Pt–CO
ad in the presence of excess
water vapour, failed to produce measurable levels of
hydrogen. This result was not surprising in so far as the original report
95 claiming evidence of photo-assisted
water–gas shift over Pt/TiO
2 determined a very low quantum yield of
ϕ ≈ 0.005.
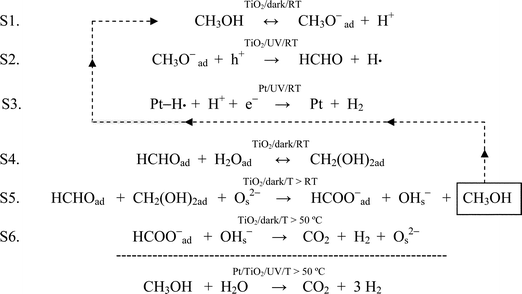
In summary, the following mechanism is believed to be operative in photo-reforming of methanol:
Steps S1–S3 represent photo-dehydrogenation to formaldehyde, while steps S4–S6 describe the dark generation of formate, and its thermal decomposition to CO2 and H2. The interesting point to note is that the methanol product from the Cannizzaro reaction (S5) is recycled back into step S1 such that, on balance, two out of three H2 molecules are photo-produced, each by a single electron/hole pair. Thus, when thermal activation is applied along with band-gap illumination, the quantum yield for H2 generation can exceed unity, at least in principle. Migration of protons to Pt (S1 to S3) is presumably channeled via the least basic surface hydroxyl groups on the titania surface. Having Brønsted acid character, these may also be responsible for CO (and water) production from formate by abstracting OH. The most basic hydroxyls, represented above as OHs− (S5), tend to remain on the support where they may assist in formate decomposition to CO2 and H2 (S6). The relevance to photocatalysis of the amphoteric surface properties of TiO2 has already been remarked upon.33–36 Partial fluorination96 appears to be a promising surface modification to activate water, considered to be rate-determining in steam-reforming processes in general.
Conclusions and outlook
In-situ DRIFTS, adapted for optical pumping and coupled to on-line mass spectrometry, has proven to be a valuable technique to investigate and monitor processes occurring at the surface of photocatalysts under working conditions. By determining both co-products and their quantitative relation, this study has effectively demonstrated that band-gap irradiation promotes methanol reforming over Pt/TiO2, albeit slowly, at ambient temperature. More significantly, a photo/thermal synergy has been discovered that drives complete reforming at a much higher rate. This raises the prospects for technical development after a re-appraisal of the quantum efficiency and the CO2/CO selectivity in a conventional photoreactor. A mechanism has been proposed in which the initial photo-product, formaldehyde, undergoes a sequence of dark processes that culminate in formate decomposition, thereby rationalizing the observed synergy. As a priority, future investigations should assess the influence on photo-reforming activity of textural and surface properties of a wide variety of titanias, especially their hydrophilicity, along with the effects of surface derivatization and additives to restrict CO production. As regards the metal component, substitution of Pt by, e.g., Au or Pt-based alloys with Ru or Sn, which all moderate CO adsorption, may also prove beneficial. Photo-reforming of ethanol is currently under investigation in this laboratory.
Appendix
| Name |
Assignment |
Band centre |
Left edge |
Right edge |
Left baseline |
Right baseline |
|
|
cm−1 |
cm−1 |
cm−1 |
cm−1 |
cm−1 |
|
Dioxomethylene (DOM) linear polymer (ex. HCHO/H2O).82
Adsorbed methanediol anion.83
|
| H2Ovap |
ν
O–H
|
3860
|
4000 |
3790 |
4000 |
3790 |
| H2Oad |
ν
O–H
|
3500
|
3518 |
3118 |
3751 |
3110 |
| CH4 |
ν
C–H
|
3015
|
3023 |
3010 |
3023 |
3010 |
| CH3OH |
ν
as
C–H
|
2950
|
3002 |
2921 |
3028 |
2796 |
|
CH2O2 |
ν
as
C–H
|
2910
|
2919 |
2895 |
3023 |
2795 |
|
OCH2OHad− |
ν
as
C–H
|
2765
|
2783 |
2694 |
2784 |
2693 |
| HCOOad− |
ν
C–H
|
2740
|
2775 |
2700 |
2775 |
2700 |
| CO2 |
ν
as
O=C=O
|
2350
|
2391 |
2267 |
2391 |
2266 |
| CO |
ν
C≡O
|
2170
|
2228 |
2146 |
2229 |
2145 |
| Ptx+–COad |
ν
C≡O
|
2120
|
2130 |
2097 |
2131 |
2097 |
| Pt–COad |
ν
C≡O
|
2050
|
2096 |
1929 |
2142 |
1928 |
| Pt3–COad |
ν
C≡O
|
1830
|
1897 |
1777 |
1897 |
1776 |
| HCHO |
ν
C=O
|
1745
|
1796 |
1725 |
1796 |
1725 |
| H2Oad |
δ
O–H
|
1630
|
1731 |
1609 |
1731 |
1502 |
| HCOO−ad |
ν
as
O=C=O
|
1560
|
1575 |
1496 |
1681 |
1495 |
| HCO3−ad |
ν
s
O=C=O
|
1445
|
1460 |
1414 |
1460 |
1413 |
| HCOO−ad |
ν
s
O=C=O
|
1360
|
1395 |
1317 |
1397 |
1316 |
Acknowledgements
The authors wish to thank Ms. Y. S. Loo for catalyst preparation, and Drs. Simo Pehkonen (CEWIC, Oulu, Finland) and Pierre Pichat (CNRS, Ecully, France) for consultations and technical advice. The interest and encouragement of Dr. P. K. Wong (ICES) is greatly appreciated.
References
-
S. Gottesfeld, Polymer Electrolyte and Direct Methanol Fuel Cells in Encyclopaedia of Electrochemistry: Online, 2007, Wiley-VCH Search PubMed.
-
Advances in Fuel Cells, ed. T. S. Zhao, K.-D. Kreuer, T. Van Nguyen, Vol. 1, 2007, Elsevier Search PubMed.
- J. H. Wee, Renewable Sustainable Energy Rev., 2007, 11, 1720–1738 CrossRef CAS.
- W. Grochala and P. P. Edwards, Chem. Rev., 2004, 104, 1283–1315 CrossRef CAS.
-
G. A. Olah, A. Goeppert, G. K. Surya Prakash, Beyond Oil and Gas: The Methanol Economy, 2006, Wiley-VCH Search PubMed.
- A. Hamnett, Catal. Today, 1997, 38, 445–457 CrossRef CAS.
- T. Schultz, S. Zhou and K. Sundmacher, Chem. Eng. Technol., 2001, 24, 1223–1233 CrossRef CAS.
- R. R. Davda, J. W. Shabaker, G. W. Huber, R. D. Cortright and J. A. Dumesic, Appl. Catal., B: Environ., 2005, 56, 171–186 CrossRef CAS.
-
A. Kundu, Y. G. Shul, D. H. Kim, Advances in Fuel Cells, Elsevier, 2007, Ch. 7, pp. 419–472 Search PubMed.
- B. A. Peppley, J. C. Amphlett, L. M. Kearns and R. F. Mann, Appl. Catal., A: Gen., 1999, 179, 21–29 CrossRef CAS , 31–49.
- D. R. Palo, R. A. Dagle and J. D. Holladay, Chem. Rev., 2007, 107, 3992–4021 CrossRef CAS.
- J. Highfield, T. Liu, Y. S. Loo, B. Grushko and A. Borgna, Phys. Chem. Chem. Phys., 2009, 11, 1196–1208 RSC.
- C. Song, Catal. Today, 2002, 77, 17–49 CrossRef CAS.
- J. G. Highfield, Tr. Phys. Chem., 1995, 5, 91–156 Search PubMed.
- G. W. Huber, S. Iborra and A. Corma, Chem. Rev., 2006, 106, 4044–4098 CrossRef CAS.
- S. Fernando, S. Adhikari, C. Chandrapal and N. Murali, Energy Fuels, 2006, 20, 1727–1737 CrossRef CAS.
- A. V. Bridgwater, Chem. Eng. J., 2003, 91, 87–102 CrossRef CAS.
- C. N. Hamelinck and A. P. C. Faaij, J. Power Sources, 2002, 111, 1–22 CrossRef CAS.
- A. V. Bridgwater, Appl. Catal., A: Gen., 1994, 116, 5–47 CrossRef CAS.
- J. Han and H. Kim, Renewable Sustainable Energy Rev., 2008, 12, 397–416 CrossRef CAS.
- Z. Abu El-Rub, E. A. Bramer and G. Brem, Ind. Eng. Chem. Res., 2004, 43, 6911–6919 CrossRef CAS.
- D. Sutton, B. Kelleher and J. R. H. Ross, Fuel Process. Technol., 2001, 73, 155–173 CrossRef CAS.
- D. Mohan, C. U. Pittman Jr and P. H. Steele, Energy Fuels, 2006, 20, 848–889 CrossRef CAS.
-
J. B. Hansen, F. Joensen, in Natural Gas Conversion I, Elsevier, 1991, 457 Search PubMed.
- V. L. Halloin and S. J. Wajc, Chem. Eng. Sci., 1994, 49, 4691 CrossRef CAS.
-
J. G. Highfield, A. Bill, E. Uenala, F. Geiger, & B. Eliasson, Proceedings of 11th International Symposium on Alcohol Fuels (ISAF XI), Sun City, South Africa, April, 1996, Vol. 2, p. 528 Search PubMed.
- J. N. Chheda, G. W. Huber and J. A. Dumesic, Angew. Chem., Int. Ed., 2007, 46, 7164–7183 CrossRef CAS.
- G. W. Huber, J. W. Shabaker and J. A. Dumesic, Science, 2003, 300, 2075–2077 CrossRef CAS.
- R. D. Cortright, R. R. Davda and J. A. Dumesic, Nature, 2002, 418, 964–967 CrossRef CAS.
- J. R. Salge, B. J. Dreyer, P. J. Dauenhauer and L. D. Schmidt, Science, 2006, 314, 801–804 CrossRef CAS.
- R. M. Navarro, M. C. Sánchez Sánchez, M. C. Alvarez-Galvan, F. del Valle and J. L. G. Fierro, Energy Environ. Sci., 2009, 2, 35–54 RSC.
- X. L. Fu, J. L. Long, X. X. Wang, D. Y. C. Leung, Z. X. Ding, L. Wu, Z. Zhang, Z. H. Li and X. Z. Fu, Int. J. Hydrogen Energy, 2008, 33, 6484–6491 CrossRef CAS.
- P. Pichat, J.-M. Herrmann and J. Disdier, Nouv. J. Chim., 1981, 5, 627–636 Search PubMed.
- P. Pichat, M.-N. Mozzanega, J. Disdier and J.-M. Herrmann, Nouv. J. Chim., 1982, 6, 559–564 Search PubMed.
- P. Pichat, Nouv. J. Chim., 1987, 11, 135–140 Search PubMed.
- P. Pichat, Catal. Today, 1994, 19, 313–334 CrossRef CAS.
- L. Millard and M. Bowker, J. Photochem. Photobiol., A: Chem., 2002, 148, 91–95 CrossRef CAS.
- L. S. Al-Mazroai, M. Bowker, P. Davies, A. Dickinson, J. Greaves, D. James and L. Millard, Catal. Today, 2007, 122, 46–50 CrossRef CAS.
- N. Strataki, V. Bekiari, D. I. Kondarides and P. Lianos, Appl. Catal., B: Environ., 2007, 77, 184–189 CrossRef CAS.
- J. G. Highfield and M. Graetzel, J. Phys. Chem., 1988, 92, 464–467 CrossRef.
- J. G. Highfield and P. Pichat, New J. Chem., 1989, 13, 61–66 Search PubMed.
- N. Murakami, O. O. P. Mahaney, T. Torimoto and B. Ohtani, Chem. Phys. Lett., 2006, 426, 204–208 CrossRef CAS.
- N. Murakami, O. O. P. Mahaney, R. Abe, T. Torimoto and B. Ohtani, J. Phys. Chem. C, 2007, 111, 11927–11935 CrossRef CAS.
- J. Ryczkowski, Catal. Today, 2007, 124, 11–20 CrossRef CAS.
- J. Ryczkowski, Catal. Today, 2001, 68, 263–381 CrossRef CAS.
- T. Bürgi and A. Baiker, Adv. Catal., 2006, 50, 227–283.
- J. G. Highfield, M. R. Prairie and A. Renken, In-Situ Methods in Catalysis, Reading, U.K., Sep. 1990, Catal. Today, 1991, 9, 39–46 CrossRef CAS.
- S. Kataoka, M. I. Tejedor-Tejedor, J. M. Coronado and M. A. Anderson, J. Photochem. Photobiol., A: Chem., 2004, 163, 323–329 CrossRef CAS.
- S. H. Szczepankiewicz, J. A. Moss and M. R. Hoffmann, J. Phys. Chem. B, 2002, 106, 2922–2927 CrossRef CAS.
- S. H. Szczepankiewicz, J. A. Moss and M. R. Hoffmann, J. Phys. Chem. B, 2002, 106, 7654–7658 CrossRef.
- J. M. Coronado, S. Kataoka, I. Tejedor-Tejedor and M. A. Anderson, J. Catal., 2003, 219, 219–230 CrossRef CAS.
-
J. Highfield, H. J. Chen, C. Chong, Y. S. Loo, Z. Chen, 17th International Conference on Photochemical Conversion & Storage of Solar Energy (IPS-17), Sydney, Australia, 27 Jul–1 Aug 2008, Final program & Abstract Book, p. 129 Search PubMed.
-
J. Highfield, Y. S. Loo, Z. Zhong, R. Li, B. Grushko, Proceedings of the International Congress
on Nanotechnology (ICNT-2005), San Francisco, USA, 31 Oct–4 Nov 2005 Search PubMed.
- J. Highfield, Y. S. Loo, Z. Zhong and B. Grushko, Carbon, 2007, 45, 2597–2607 CrossRef CAS.
- F. C. Meunier, A. Goguet, S. Shekhtman, D. Rooney and H. Daly, Appl. Catal., A: Gen., 2008, 340, 196–202 CrossRef CAS.
- A. L. McClellan and H. F. Harnsberger, J. Colloid Interface Sci., 1967, 23, 577–599 CrossRef CAS.
- B. Kraeutler and A. J. Bard, J. Am. Chem. Soc., 1978, 100, 4317–4318 CrossRef CAS.
- J.-M. Herrmann, J. Disdier, P. Pichat, A. Fernandez, A. Gonzalez-Elipe, G. Munuera and C. LeClercq, J. Catal., 1991, 132, 490–497 CrossRef.
- U. Siemon, D. Bahnemann, J. J. Testa, D. Rodriguez, M. I. Litter and N. Bruno, J. Photochem. Photobiol., A: Chem., 2002, 148, 247–255 CrossRef CAS.
- S. C. Chan and M. A. Barteau, Langmuir, 2005, 21, 5588–5595 CrossRef CAS.
- S. C. Kim, M. C. Heo, S. H. Hahn, C. W. Lee, J. H. Joo, J. S. Kim, I. K. Yoo and E. J. Kim, Mater. Lett., 2005, 59, 2059–2063 CrossRef CAS.
- C. Millon, D. Riassetto, G. Berthomé, F. Roussel and M. Langlet, J. Photochem. Photobiol., A, 2007, 189, 334–348 CrossRef CAS.
- S. Shironita, K. Mori, T. Shimizu, T. Ohmichi, N. Mimura and H. Yamashita, Appl. Surf. Sci., 2008, 254, 7604–7607 CrossRef CAS.
- D. Riassetto, C. Holtzinger, M. Messaoud, S. Briche, G. Berthomé, F. Roussel, L. Rapenne and M. Langlet, J. Photochem. Photobiol., A, 2009, 202, 214–220 CrossRef CAS.
- J.-M. Herrmann, J. Disdier and P. Pichat, J. Phys. Chem., 1986, 90, 6028–6034 CrossRef CAS.
- P. Hollins, Surf. Sci. Rep., 1992, 16, 51–94 CrossRef.
- H. Gao, W. Xu, H. He, X. Shi, X. Zhang and K. Tanaka, Spectrochim. Acta, Part A, 2008, 71, 1193–1198 CrossRef.
- G. Jacobs, P. M. Patterson, U. M. Graham, A. C. Crawford, A. Dozier and B. H. Davis, J. Catal., 2005, 235, 79–91 CrossRef CAS.
- T. Iwasita, F. C. Nart, B. Lopez and W. Vielstich, Electrochim. Acta, 1992, 37, 2361–2367 CrossRef CAS.
- T. van der Meulen, A. Mattson and L. Österlund, J. Catal., 2007, 251, 131–144 CrossRef CAS.
- F. Boccuzzi and A. Chiorino, J. Phys. Chem., 1996, 100, 3617–3624 CrossRef CAS.
- G. A. Attard, H. D. Ebert and R. Parsons, Surf. Sci., 1990, 240, 125–135 CrossRef CAS.
- P. Pillonel, S. Derrouiche, A. Bourane, F. Gaillard, P. Vernoux and D. Bianchi, Appl. Catal., A: Gen., 2005, 278, 223–231 CrossRef CAS.
- F. P. Rotzinger, J. M. Kesselman-Truttmann, S. J. Hug, V. Shklover and M. Graetzel, J. Phys. Chem. B, 2004, 108, 5004–5017 CrossRef CAS.
- S. Sato and J. M. White, J. Am. Chem. Soc., 1980, 102, 7206–7210 CrossRef CAS.
- C. Revilliod, A. J. McEvoy and M. Graetzel, Sol. Energy Mater., 1991, 24, 522–537 CrossRef CAS.
- X. Fu, L. A. Clark, W. A. Zeltner and M. A. Anderson, J. Photochem. Photobiol., A, 1996, 97, 181–186 CrossRef CAS.
-
J. C. Kennedy, A. K. Datye, M. R. Prairie, 1996, Abstr. Proc. 2nd International Symposium Advanced Oxidation Technologies., San Francisco, CA, 28 Feb–1 Mar 1996 Search PubMed.
- B. Sanchez, A. I. Cardona, M. Romero, P. Avila and A. Bahamonde, Catal. Today, 1999, 54, 369–377 CrossRef CAS.
- X. Sun and J. Lin, J. Phys. Chem. C, 2009, 113, 4970–4975 CrossRef CAS.
- S. Morooka, N. Matubayasi and M. Nakahara, J. Phys. Chem. A, 2007, 111, 2697–2705 CrossRef CAS.
- G. Busca, J. Lamotte, J.-C. Lavalley and V. Lorenzelli, J. Am. Chem. Soc., 1987, 109, 5197–5202 CrossRef CAS.
- Y. H. Yeom, N. Ulagappan and H. Frei, J. Phys. Chem. A, 2002, 106, 3345–3349 CrossRef CAS.
- See, e.g. G. Jacobs and B. H. Davis, Catalysis, 2007, 20, 122–285 Search PubMed and references contained therein.
- T. Mishra, J. Hait, N. Aman, R. K. Jana and S. Chakravarty, J. Colloid Interface Sci., 2007, 316, 80–84 CrossRef CAS.
- X. Wang, S. O. Pehkonen and A. K. Ray, Ind. Eng. Chem. Res., 2004, 43, 1665–1672 CrossRef CAS.
- V. N. H. Nguyen, R. Amal and D. Beydoun, Chem. Eng. Sci., 2003, 58, 4429–4439 CrossRef CAS.
- T. Shido and Y. Iwasawa, J. Catal., 1992, 136, 493–503 CAS.
- T. Shido and Y. Iwasawa, J. Catal., 1993, 141, 71–81 CrossRef CAS.
- J. M. Pigos, C. J. Brooks, G. Jacobs and B. H. Davis, Appl. Catal., A: Gen., 2007, 328, 14–26 CrossRef CAS.
- G. Jacobs, P. M. Patterson, U. M. Graham, A. C. Crawford and B. H. Davis, Int. J. Hydrogen Energy, 2005, 30, 1265–1276 CrossRef CAS.
- G. Jacobs, P. M. Patterson, U. M. Graham, A. C. Crawford, A. Dozier and B. H. Davis, J. Catal., 2005, 235, 79–91 CrossRef CAS.
- G. Jacobs, P. M. Patterson, U. M. Graham, D. E. Sparks and B. H. Davis, Appl. Catal., A: Gen., 2004, 269, 63–73 CrossRef CAS.
- G. P. Wu, T. Chen, X. Zong, H. J. Yan, G. J. Ma, X. L. Wang, Q. Xu, D. G. Wang, Z. B. Lei and C. Li, J. Catal., 2008, 253, 225–227 CrossRef CAS.
- S. Sato and J. M. White, J. Am. Chem. Soc., 1980, 102, 7206–7210 CrossRef CAS.
- J. W. Kim, J. S. Lee and W. Y. Choi, Chem. Commun., 2008, 756–758 RSC.
|
| This journal is © The Royal Society of Chemistry 2009 |
Click here to see how this site uses Cookies. View our privacy policy here. 


