Starburst triphenylamine-based cyanine dye for efficient quasi-solid-state dye-sensitized solar cells
Received
2nd April 2009
, Accepted 28th May 2009
First published on 11th June 2009
Abstract
A new starburst triphenylamine-based unsymmetrical organic cyanine sensitizer I and the corresponding cyanine dye II containing one triphenylamine unit for the purpose of comparison were designed and synthesized. They were successfully applied in quasi-solid-state dye-sensitized solar cells (DSSCs). The absorption spectra, electrochemical and photovoltaic properties of I and II were extensively investigated. It was found that the HOMO and LUMO energy levels tuning can be conveniently accomplished by alternating the donor moiety, which was confirmed by electrochemical measurements. The quasi-solid-state DSSCs based on the dye I showed the better photovoltaic performance: a maximum monochromatic incident photon-to-current conversion efficiency (IPCE) of 83%, a short-circuit photocurrent density (Jsc) of 9.12 mA cm−2, an open-circuit photovoltage (Voc) of 0.54 V, and a fill factor (ff) of 0.64, corresponding to an overall conversion efficiency of 3.19% under standard global AM 1.5 solar conditions. This work suggests that the cyanine dyes based on the starburst triarylamine donor are promising candidates for improvement of the performance of the quasi-solid-state DSSCs.
Broader context
Solar energy is a clean, renewable and inexhaustible energy source. The conversion of solar energy to electricity using dye-sensitized solar cells (DSSCs) represents one of the most promising methods for future large-scale power production because of its low-cost and high efficiency. At present, those with high conversion efficiencies over 10% are all based on volatile electrolytes, which will easily lead to long-term instability of the device and environmental problems. Quasi-solid-state DSSCs have been supposed as potential candidates that can overcome these problems and promote practical applications in the future. Here we employ a trimethine cyanine conjugated linker along with a hydrophobic starburst triphenylamine electron-donor and a hydrophilic carboxylic acid electron-acceptor to construct a high molar extinction coefficient organic cyanine photosensitizer dye. In conjunction with a quasi-solid-state electrolyte, we have fabricated a 3.19% cell exhibiting excellent stability measured under thermal and light-soaking dual stress.
|
Introduction
Dye-sensitized solar cells (DSSCs) based on nanocrystalline porous TiO2 films have attracted much attention because of their relatively higher efficiency and low cost compared with conventional inorganic photovoltaic devices.1,2 DSSCs based on the Ru-complex dyes can produce a photoelectric conversion yield of 11% under standard AM 1.5 sun light irradiation. Recently, organic DSSCs have received more and more attention because of their ease of synthesis, high molar extinction coefficient and simple preparation process of low cost in comparison to Ru-complexes. Coumarin,3–5merocyanine,6indoline,7,8 polyene,9hemicyanine,10,11triphenylamine,12–16fluorene17–19 and tetrahydroquinoline20 based-organic dyes have been developed and showed good performance.
Most organic sensitizers are constituted by donor, linker and acceptor moieties and usually have the rod-like configuration. Generally organic dyes used for efficient solar cells are required to possess a broad and intense spectral absorption in the visible light region. One strategy towards this end is to introduce more π-conjugation segments between the donor and acceptor, thereby forming D–π–π–A structures.12,20–22 However, the rod-like molecules are prolonged, which may facilitate the recombination of electrons to the triiodide and the formation of aggregation between molecules.23 The close π–π aggregation can not only lead to self-quenching and reduction of electron injection into TiO2, but also to the instability of the organic dyes due to the formation of excited triplet states and unstable radicals under light irradiation.24 Therefore, the notion of incorporating a nonplanar triphenylamine or bis-dimethylfluorenylamino moiety into the organic framework was proposed. In this way, the conversion efficiency has reached a record 9.1% and the performance of the cells can be retained over 1200 hours without an obvious decline.14,17,25–30
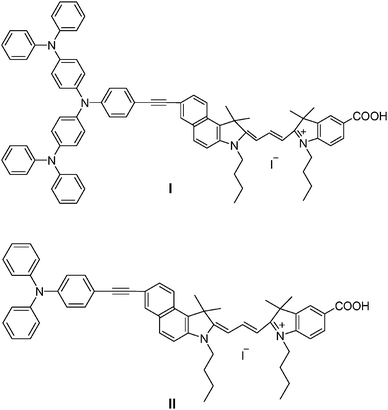
In this work, a novel unsymmetrical organic cyanine sensitizer I (Scheme 1) that contains the starburst triphenylamine moiety acting as an electron donor and carboxylic acid moiety acting as an acceptor, the two functions being connected by trimethine cyanine, has been designed and synthesized. We have also synthesized the corresponding cyanine dye II (Scheme 1) for the purpose of comparison. The tailored starburst triarylamine moiety in sensitizer I not only extends the absorption but also increases the molar extinction coefficient as compared to simple triphenylamines. Also, the nonplanar structure of starburst triarylamine suppresses aggregation, disfavoring molecular stacking. Finally, the starburst triarylamine molecule has aroused great interest for the excellent hole transport capability, and it has become classic hole transporting material.31–33 On the other hand, cyanine dyes have very high absorption extinction coefficients (∼105 M−1 cm−1), an intense and broad absorption band in the visible and near-infrared region, and excellent sensitizing properties in photography. Herein, we report on the synthesis, characterization, photovoltaic properties and stability tests of the triphenylamine-based cyanine sensitizers I and II.
Experimental
Equipment
NMR spectra were obtained on a Brücker AM 500 spectrometer. The UV-Vis spectra were measured with a model CARY 100 spectrophotometer. MS were recorded on an ESI mass spectrometer. The cyclic voltammograms of dyes were obtained with a Versastat II electrochemical workstation (Princeton applied research) using a normal three-electrode cell with a Pt working electrode, a Pt wire counter electrode, and a regular calomel reference electrode in saturated KCl solution.
Materials
Optically transparent conducting glass (FTO glass, fluorine-doped tin oxide over-layer, transmission > 90% in the visible, sheet resistance 15 Ω/square) was obtained from Geao Science and Educational Co. Ltd., China and cleaned by a standard procedure. Titanium (IV) isopropoxide and 3-methyl-2-oxazolidinone were purchased from Aldrich. Lithium iodide was obtained from Fluka. THF was pre-dried over 4 Å molecular sieves and distilled under an argon atmosphere from sodium benzophenone ketyl immediately prior to use. Triethylamine and pyridine were distilled under normal pressure and dried over potassium hydroxide. Starting materials 4-ethynyltriphenylamine (1), 2-(7-bromo-3-butyl-2-methylene-1,1-dimethyl-1H-benzo[e]indolin-2-ylidene)acetaldehyde[e]indolin-2-ylidene)acetaldehyde (2), 2-(7-ethynyl-3-butyl-2-methylene-1,1-dimethyl-1H-benzo[e]indolin-2-ylidene)acetaldehyde (6), 5-carboxyl-1-butyl-2,3,3-trimethyl-3H-indolium iodide (8) were prepared according to published procedures.34 All other chemicals were purchased from Aldrich and used as received without further purification.
Preparation of dye-sensitized nanocrystalline TiO2electrodes
The preparation of the dye-sensitized TiO2electrode was prepared using the procedure reported in the literature. A TiO2colloidal dispersion was made according to this reference.1a Commercial TiO2 (P25, Degussa AG, Germany) was used as the material. Films of nanocrystalline colloidal TiO2 on FTO were prepared by sliding a glass rod over the conductive side of the FTO. Sintering was carried out at 450 °C for 30 min. Before immersion in the dye solution, these films were soaked in a 0.2 M aqueous TiCl4 solution overnight in a closed chamber, which can significantly increase the short-circuit photocurrent. The thickness of the TiO2 film was about 12 µm. After being washed with deionized water and fully rinsed with ethanol, the films were heated again at 450 °C followed by cooling to 80 °C and dipping into a 3 × 10⁻⁴ M solution of dyes in methanol for 12 h at room temperature. Fumed silica nanoparticles (5 wt%) with a 12 nm primary particle size provided from Degussa were mixed with BMII (1-butyl-3-methylimidazolium iodide) based liquid electrolytes to produce a stable gel. Quasi-solid-state electrolytes are composed of 0.5 M iodine and 0.45 M benzimidazole (BI) in pure BMII. The dye-coated TiO2 film, as the working electrode, was placed on the top of an FTO glass with sputtered Pt as a counter electrode. The redox electrolyte was introduced into the inter-electrode space by capillary force.
Photoelectrochemical measurements
The photocurrent action spectra were measured with a Model SR830 DSP Lock-In Amplifier, a Model SR540 Optical Chopper (Stanford Research Corporation, USA), a 7IL/PX150 xenon lamp with power supply and a 7ISW301 Spectrometer. The irradiation source for the photocurrent density–voltage (J–V) measurement is an AM 1.5 solar simulator (91160, Newport Co., USA). The incident light intensity was 100 mW cm−2 calibrated with a standard Si solar cell. The tested solar cells were masked to a working area of 0.15 cm2. Volt–current characteristic were performed on a Model 2400 Sourcemeter (Keithley Instruments, Inc., USA).
Synthesis
[3-Butyl-7-(4-diphenylamino-phenylethynyl)-1,1-dimethyl-1,3-dihydrobenzo[e]indol-2-ylidene]-acetaldehyde (3).
2-(7-Bromo-3-butyl-2-methylene-1,1-dimethyl-1H-benzo[e]indolin-2-ylidene)-acetaldehyde
2 (0.42 g, 1.13 mmol), 4-ethynyltriphenylamine 1 (0.3 g, 1.13 mmol), PPh3 (2.9 mg, 0.01 mmol), Pd(PPh3)2Cl2 (2.9 mg, 0.01 mmol) and CuI (5.2 mg, 0.02 mmol) were added in 20 mL triethylamine. The mixture was stirred in an Ar atmosphere under reflux for 12 h. After the solvent was removed by a rotary evaporator, the residue was extracted with chloroform and water. The organic layer was dried with anhydrous magnesium sulfate overnight. After the solvent was evaporated, the remained solid was purified by column chromatography (silica gel) with an eluent of tetrachloromethane/ethyl acetate = 5/1 (v/v) to afford 0.47 g product, yield 75%. 1H-NMR (CDCl3, 500 MHz), δ: 10.08 (d, J = 9.0 Hz, 1H), 8.04 (d, J = 1.5 Hz, 1H), 8.00 (d, J = 9.0 Hz, 1H), 7.81 (d, J = 8.9 Hz, 1H), 7.60 (m, 1H), 7.42 (s, 1H), 7.40 (s, 1H), 7.30 (m, 5H), 7.18 (d, J = 8.9 Hz, 1H), 7.13 (s, 2H), 7.12 (d, J = 7.1 Hz, 2H), 7.07 (s, 1H), 7.04 (s, 1H), 7.01 (s, 1H), 5.50 (d, J = 9.0 Hz, 1H), 3.79 (t, J = 7.7 Hz, 2H), 1.95 (s, 6H), 1.73 (m, 2H), 1.45 (m, 2H), 1.01 (t, J = 7.2 Hz, 3H).
Tris(4-iodophenyl)amine (4).
10 g (40 mmol) of triphenylamine, 13.5 g (80 mmol) of potassium iodide, 340 mL of acetic acid and 30 mL of distilled water were heated to 80 °C with stirring for 1 h. Then 12 g (56 mmol) of potassium iodate was added into the solution. After stirring at 50 °C for 6 h, the mixture was poured into distilled water to induce the precipitation of the crude product. The precipitation was filtered and recrystallized with chloroform to give 22.8 g (69%) of white solid. 1H-NMR (CDCl3, 500 MHz), δ: 7.54 (d, J = 8.8 Hz, 6H), 6.82 (d, J = 8.8 Hz, 6H).
N
1-(4-(Diphenylamino)phenyl)-N1-(4-iodophenyl)-N4,N4-diphenylbenzene-1,4-diamine (5).
Tris(4-iodophenyl)amine (2 g, 3.2 mmol), N,N-diphenylamine (1.62 g, 9.6 mmol), potassium carbonate (3.21 g, 23 mmol), activated copper bronze (0.83 g, 13.0 mmol) and 18-crown-6 (1.20 g, 0.38 mmol) were refluxed in 1,2-dichlorobenzene (20 mL) for 24 h. The solvent was removed by decompressing distillation and the residue was purified by column chromatography on silica gel using dichloromethane and petrol ether with the ratio of 1 : 1 (v/v) as the eluent to give 5 as a white solid (324 mg, yield 14.4%). 1H-NMR (CDCl3, 500 MHz), δ: 7.30–7.32 (m, 4H), 7.2–7.28 (m, 10H), 7.00–7.10 (m, 14H), 7.60 (m, 4H). 13C NMR (CDCl3, 125 MHz), δ: 148.6, 148.1, 147.7, 133.0, 132.8, 130.2, 130.1, 129.9, 126.1, 125.8, 125.3, 125.1, 124.8, 123.9, 123.3, 115.4; MS (ESI) m/z: 705.1 (M).
2-(7-(2-(4-(Bis(4-(diphenylamino)phenyl)amino)phenyl)ethynyl)-3-butyl-1,1-dimethyl-1H-benzo[e]indolin-2-ylidene) acetaldehyde (7).
A mixture of 5 (150 mg, 0.21 mmol), 6 (71 mg, 0.21 mmol), Ph3P (5.7 mg, 0.022 mmol), Pd(Ph3P)2Cl2 (21.2 mg, 0.022 mmol), CuI (6.8 mg, 0.044 mmol), 20 mL of THF and 20 mL of triethylamine were refluxed under dry nitrogen for 20 h with stirring. The solvent was removed on the rotary evaporator. The residue was dissolved in 50 mL of chloroform and washed twice with deionized water, and dried over anhydrous magnesium sulfate. The solvent was removed on the rotary evaporator and the residue was purified by column chromatography on silica gel using dichloromethane and acetone with the ratio of 50 : 1 (v/v) as the eluent to give 7 as a yellow solid (0.15 g, yield 65%).1H-NMR (CDCl3, 500 MHz), δ: 10.15 (d, J = 8.8 Hz, 1H), 8.02 (d, J = 9.2 Hz, 2H), 7.80 (d, J = 8.8 Hz, 2H), 7.60 (d, J = 8.8 Hz, 2H), 7.20–7.50 (m, 10H), 7.20 (d, 2H), 6.50–7.50 (m, 19H), 5.49 (d, J = 8.8 Hz, 1H),3.79 (t, J = 7.2 Hz, 2H), 2.00 (s, 6H), 1.75 (m, 2H), 1.45 (m, 2H), 1.00 (t, J = 7.2 Hz, 3H).
2-[(3-Butyl-1,1-dimethyl-5-carboxyl-indoline-2-ylidene)propenyl]-[3-butyl-7-(4-bis-triphenylamino-phenylethynyl)-1,1-dimethyl]-1H-benz[e]indolium iodide (I).
Compound 3 (70 mg, 0.078 mmol) and 5-carboxyl-1-butyl-2,3,3-trimethyl-3H-indolium iodide (30.3 mg, 0.078 mmol) were added into 5 mL of acetic anhydride. The solution was heated to 110 °C for 1 h with stirring. The mixture was poured into 50 mL of water under stirring. The resulting blue precipitate was separated by filtration and washed with 20 mL of water. The crude product was purified by column chromatography on silica gel using CH2Cl2/CH3OH with the ratio of 10 : 1 (v/v) as an eluent to give I as a blue solid (40 mg, yield 41.0%).1H-NMR (CDCl3, 500 MHz), δ: 8.54 (t, J = 13.4 Hz, 1H), 8.11–8.14 (t, 3H), 8.08 (d, J = 8.8 Hz, 1H), 7.92 (d, J = 8.8 Hz, 1H), 7.69 (d, J = 9.0 Hz, 1H), 7.42 (m, 3H), 7.25 (m, 8H), 7.11 (m, 9H), 7.01 (m, 16H), 4.40 (m, 2H), 4.21(m, 2H), 2.00 (s, 6H), 1.80–1.95 (m, 4H), 1.75 (m, 6H), 1.51–1.70 (m, 4H), 1.10 (m, 6H); 13C-NMR (CDCl3, 125 MHz), δ: 175.9, 173.6, 150.2, 148.3, 147.7, 145.1, 143.7, 141.5, 140.0, 139.8, 137.8, 134.0, 132.8, 132.6, 131.8, 130.6, 120.2, 129.0, 128.2, 126.9, 126.0, 125.3, 125.0, 124.0, 122.7, 122.0, 120.8, 114.5, 111.6, 110.0, 104.8, 104.4, 91.7, 88.2, 77.4, 77.1, 76.8, 67.9, 50.9, 48.6, 45.1, 44.7, 31.9, 30.1, 29.7, 29.3, 28.1, 27.7, 25.6, 22.7, 21.4, 20.3 14.0; MS (ESI) m/z:1136.3 (M − I−).
2-[(3-Butyl-1,1-dimethyl-5-carboxyl-indoline-2-ylidene)propenyl]-[3-butyl-7-(4-bis-triphenylamino-phenylethynyl)-1,1-dimethyl]-1H-benz[e]indolium iodide (II).
The product was synthesized according to the procedure as described above for the synthesis of I, giving product II in 71% yield. 1H-NMR (DMSO-d6, 500 MHz), δ: 8.50 (t, J = 13.6 Hz, 1H), 8.35 (d, J = 8.9 Hz, 1H), 8.28 (s, 1H), 8.15 (d, J = 8.8 Hz, 1H), 8.12 (s, 1H), 8.03 (d, J = 8.5 Hz, 1H), 7.85 (d, J = 9.2 Hz, 1H), 7.72 (d, J = 9.0 Hz, 1H), 7.48 (d, J = 8.5 Hz, 2H), 7.36 (m, 5H), 7.12 (m, 6H), 6.92 (d, J = 8.5 Hz, 2H), 6.58 (d, J = 13.5 Hz, 1H), 6.55 (d, J = 13.2 Hz, 1H), 4.30 (s, 2H), 4.15 (s, 2H), 1.98 (s, 6H), 1.75 (m, 10H), 1.45 (m, 4H), 0.85 (m, 6H); 13C NMR (DMSO-d6, 125 MHz), δ: 175.5, 174.0, 148.1, 147.2, 147.1, 145.0, 144.4, 143.9, 139.9, 134.0, 132.8, 132.6, 131.6, 130.6, 129.7, 129.4, 127.0, 125.0, 124.1, 123.7, 123.6, 122.1, 122.0, 120.6, 115.6, 104.1, 91.4, 88.5, 50.9, 48.9, 45.2, 30.0, 29.7, 28.3, 27.9, 20.4, 19.2, 14.2, 14.0; MS (ESI) m/z: 802.4 (M − I−).
Results and discussion
Synthesis
The synthetic route to cyanine dyes (I and II) is depicted in Scheme 2. The bridging benzo[e]indoline units are employed to provide conjugation between the donor and the anchoring groups as well as to increase the molar extinction coefficients of the dyes. Two butyl chains on the indole nucleus can improve the solubility and form a tightly packed insulating monolayer blocking the I3− or cations approaching the TiO2. The iodo-starburst triarylamine intermediate is attached to 2-(7-ethynyl-3-butyl-2-methyl-ene-1,1-dimethyl-1H-benzo[e]indolin-2-ylidene) acetaldehyde (6) by the Sonogashira coupling reaction. In the next step, the target product (I) was prepared viaKnoevenagel condensation of the aldehyde with 5-carboxyl-1-butyl-2,3,3-trimethyl-3H-indolium iodide in the presence of acetic anhydride. All the intermediates and cyanine dyes (I and II) were characterized by standard spectroscopic methods.
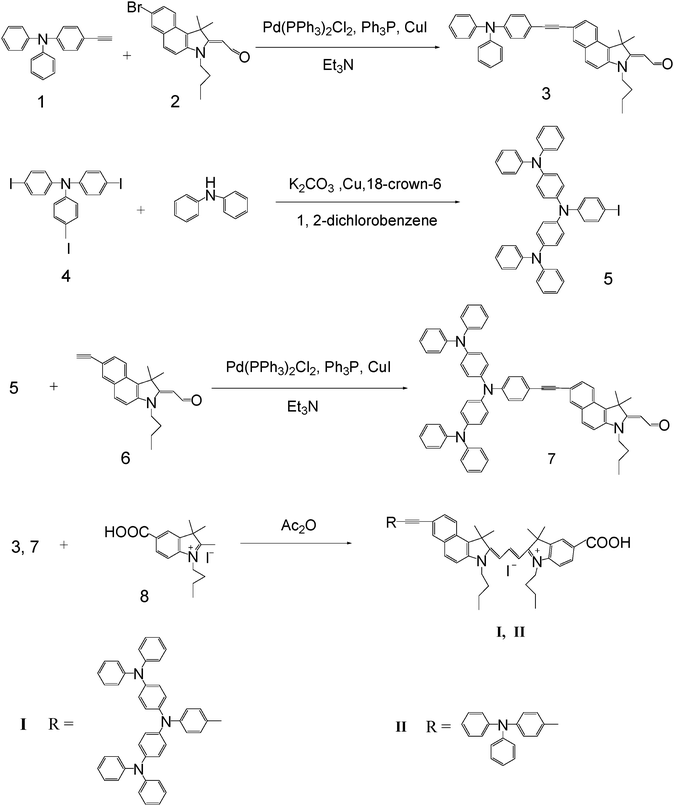 |
| | Scheme 2 The synthetic procedure of the cyanine dyes I and II. | |
Absorption properties in solution and on TiO2 film
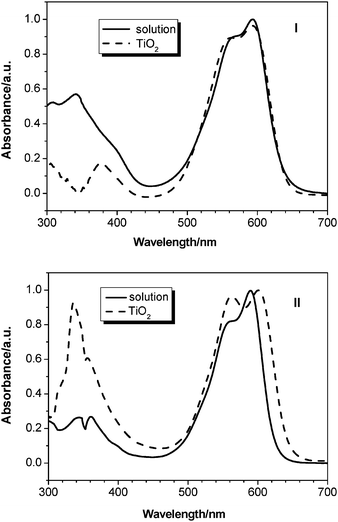
Normalized absorption spectra of cyanine dyes I and II in a diluted solution of CH2Cl2/ethanol (v/v 1 : 1) are shown in Fig. 1 and their absorption data are listed in Table 1. In the UV-Vis spectra, I and II exhibit two major prominent bands, appearing at 300–450 nm and at 480–680 nm, respectively. The former is ascribed to a localized aromatic π–π* transition and the later is of charge-transfer character, in which I and II show two typical cyanine dye absorption peaks at 561 and 590 nm with high coefficients. The shape of the low energy peak in the absorption spectra of I on TiO2 is very similar to that obtained in solution. This is because I, containing the nonplanar structure of starburst triphenylamine, can suppress cyanine dye aggregates on the TiO2nanocrystal surface. On the other hand, the shape and relative intensity of high energy part (region from 300 to 450 nm) is different. We note that I shows one typical triphenylamine absorption peaks at 330 nm in dichloromethane/ethanol (v/v: 1 : 1) and the absorption band has a larger extinction coefficient (Fig. 1). It has been speculated that it may be caused by the increase of the triarylamine units. However, the absorption peak of TiO2electrodes sensitized by I occurs at 376 nm and the absorption band is red-shifted by 46 nm compared with the solution spectra (Fig. 1). The large red-shift may be attributed to the difference in energy transfer process between the solution and the film, and the energy-transfer process takes place more easily in the film than in solution. The detailed reason for this needs further studies. The extinction coefficient of the π–π* transition band of I is larger than II, which can be attributed to the increase of the triarylamine units. However, the charge transfer band has a larger extinction coefficient in II than in I. It has been speculated that it may be caused by the decrease of co-planarity between the electron donor and the electron acceptor in the ground-state as well as in the Franck–Condon excited state because of the starburst triarylamine structure in I.30 The corresponding maximum extinction coefficients of I and II were 9.8 × 10⁴ and 12 × 104 M−1 cm−1, respectively. In comparison with conventional ruthenium complexes (for example, 1.39 × 10⁴ M−1 cm−1 at 541 nm for N3)35 the present dye molecules show about six times as high absorption coefficients. The greater maximum absorption coefficients of the organic dyes allow a correspondingly thinner nanocrystalline film so as to avoid a decrease of the film mechanical strength. This also benefits the electrolyte diffusion in the film and reduces the recombination possibility of the light-induced charges during transportation.6,36
Table 1 Optical properties and redox potential of I and II
|
Dye
|
λ
max
a/nm (ε × 10−4 M−1 cm−1) |
λ
max
b/nm |
Amountc/10−8 mol cm−2 |
E
1/
2(oxd.)
d/V |
E
D/
D
+
e/V |
E
0–0
f/eV |
E
D*/
D
+
g/V |
|
Absorption maximum in CH2Cl2/ethanol (v/v 1 : 1).
Absorption maximum on TiO2 film.
Amount of the dyes adsorbed on TiO2 film.
E
1/
2(oxd.) stands for half-wave potential vs.Ag/AgCl.
E
D/
D
+
is measured by using Ag/AgCl as the reference electrode and ferrocene/ferrocenium (Fc/Fc+) redox couple as the external standard in the TiO2 film, the potentials measured vs.Ag/AgCl were converted to the normal hydrogen electrode (NHE) by addition of +0.21 V.
E
0–0 is estimated from the absorption thresholds attached to a nanocrystalline TiO2 film.
E
D*/
D
+
is estimated by subtracting E0–0 from ED/D+.
|
|
I
|
308 (5.1), 340 (5.6), 593 (9.8) |
595 |
1.36 |
0.65, 0.88, 1.25, 1.76 |
0.86 |
1.82 |
−0.96 |
|
II
|
339 (2.7), 358 (2.7), 588 (12) |
599 |
3.78 |
1.11, 1.81 |
1.32 |
1.83 |
−0.51 |
Fig. 1 shows the absorption spectra of I and II on 12 µm thick TiO2 films after 12 h adsorption. The absorption spectra of I attached to TiO2 film was similar to those of CH2Cl2/ethanol (v/v 1 : 1) solution, while that of II was broadened on both sides compared to those in CH2Cl2/ethanol (v/v 1 : 1) solution, indicating that the formation of II aggregates is on the TiO2 surface. It is known that the dyes, especially cyanine dyes, have a strong tendency to aggregate in solution or at the solid–liquid interface due to a strong attractive force between the molecules. Dye aggregates usually have three forms: Red-shifted J-aggregates, blue-shifted H-aggregates and both red- and blue-shifted Herring-bone aggregates.37 The experimental results indicate that II used in this work form Herring-bone aggregates on the TiO2nanocrystal surface and I is unable to form aggregates. It is confirmed that this is an effective way to lower the tendency to aggregate by introducing a starburst triphenylamine moiety.
Electrochemical properties
The highest occupied molecular orbital (HOMO) and the lowest unoccupied molecular orbital (LUMO) levels of the sensitizer are required to match the conduction band edge level of the TiO2electrode. To evaluate the possibility of electron transfer from the excited dye molecule to the conductive band (Ecb) of TiO2, cyclic voltammograms were performed in acetonitrile solvent using 0.1 M tetrabutylammonium hexafluorophosphate as the supporting electrolyte, TiO2 films stained with sensitizer as the working electrode, Pt as the counter electrode and Ag/AgCl as the reference electrode. The scan rate was 50 mV s−1. The Ag/AgCl reference electrode was calibrated using a ferrocene/ferrocenium (Fc/Fc+) redox couple as an external standard, and the E1/2 of the Fc/Fc+ redox couple was found to be 0.42 V vs. the Ag/AgCl reference electrode.38 The potentials vs.NHE were calibrated by addition of 0.63 V to the potentials vs.Fc/Fc+.39 Therefore, the potentials measured vs.Ag/AgCl were converted to normal hydrogen electrode (NHE) by addition of +0.21 V. The voltammetric results are presented in Fig. 2, Fig. 3 and the data are collected in Table 1. Dye I adsorbed on TiO2 film shows four quasi-reversible redox couples at 0.65, 0.88, 1.25, 1.76 V vs.Ag/AgCl (Table 1 and Fig. 2), respectively, which correspond to the oxidations of the three triphenylamine units in the donor moiety and trimethine cyanine unit. Under similar conditions, dye II shows two irreversible oxidation processes located at 1.11 and 1.81 V vs. Ag/AgCl, respectively, which are assigned to the oxidation of one triphenylamine group and trimethine cyanine unit.
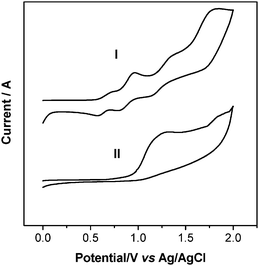 |
| | Fig. 2 Oxidative cyclic voltammetry plots of I and II attached to a nanocrystalline TiO2 film deposited on conducting FTO glass. | |
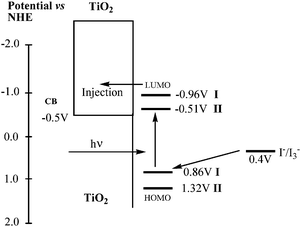 |
| | Fig. 3 Schematic energy diagram for DSSC based on I and II attached to a nanocrystalline TiO2 film deposited on conducting FTO glass. | |
It can be obtained from Table 1 and Fig. 2 that the first half-wave potentials of I and II are 0.65 and 1.11 V (vs.Ag/AgCl). The ground state oxidation potential (ED/D+) corresponding to the HOMO levels are 0.86 and 1.32 V (vs. NHE), respectively. The oxidation potential for I is significantly lower than that of II, demonstrating the extent of destabilization of HOMO caused by the starburst triphenylamine group. From Fig. 1, we know that the absorption thresholds for dyes I and II are 680 and 676 nm on TiO2 film, which correspond to the band gap energy (E0–0) of 1.82 and 1.83 eV, respectively. The estimated excited state potential (ED*/D+) corresponding to the LUMO levels, calculated from ED/D+ − E0−0, are −0.96 and −0.51 V, respectively. It is found that the HOMO levels of the dyes in this series are more positive than the iodine/iodide redox potential value (0.4 V), ensuring that there is enough driving force for the dye regeneration reaction to compete efficiently with the recapture of the injected electrons by the dye cation radical. On the other hand, the LUMO levels of these dyes are more negative than the bottom of the conduction band of TiO2 (−0.5 V), indicating that the electron injection process from the excited dye molecule to TiO2 conduction band is energetically permitted. From these values, we can systematically record the contributions of different groups and attain a HOMO and LUMO energy library by alternating the donor group independently.23 This screening strategy helps us to optimize the TiO2–dye–hole transporting materials system in terms of balance between photovoltage, driving forces and spectral response for future preparation of highly efficient dyes by matching suitable donor–spacer–acceptor components.40
Performances of liquid electrolyte dye-sensitized solar cells
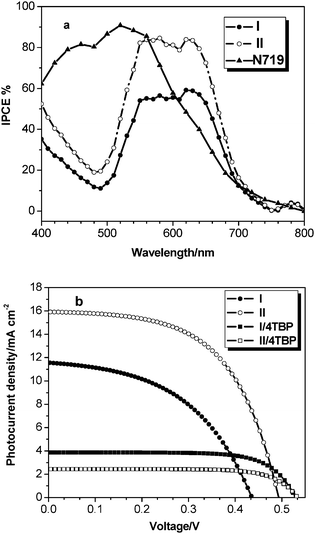
Fig. 4(a) shows the incident monochromatic photon-to-current conversion efficiency (IPCE) obtained with a sandwich cell using 0.5 M LiI + 0.05 M I2 in acetonitrile and 3-methyl-2-oxazolidinone (volume ratio: 9 : 1) mixture solution as redox electrolyte. The IPCE data of both sensitizers I and II plotted as a function of excitation wavelength exhibit a high plateau at 59% and 84%, respectively. The sensitizer IIIPCE spectrum is both red- and blue-shifted by about 10 nm as compared to I, which is consistent with the absorption spectra of the sensitizer II herring-bone aggregates. Under standard global AM 1.5 solar conditions, I-sensitized cell gave a short-circuit photocurrent density (Jsc) of 11.58 mA cm−2, an open-circuit voltage (Voc) of 0.439 mV, and a fill factor (ff) of 0.55, corresponding to an overall conversion efficiency of 2.59% (see Table 2). II-sensitized cell gave a Jsc of 15.92 mA cm−2, Voc of 0.495 mV, and ff of 0.56, corresponding to an overall conversion efficiency of 4.19%. The lower efficiency of I as compared to II-sensitized cell is due to its insufficient dye regeneration, narrower IPCE spectra, lower photocurrent and fewer amounts of the dye adsorbed on TiO2 film (see Table 1). In order to improve the open-circuit potential (Voc), 0.5 M 4-tert-butylpyridine (4-TBP) was added to the electrolyte. Although this gave rise to a modest increase of Voc by about 0.06 V, a dramatic decrease of the short-circuit current density (Jsc) was observed, resulting in lower overall solar cell efficiencies. This implies that addition of 4-TBP leads to a shift of the TiO2 conduction band edge to more negative potential, in which this will result in a decrease of the electron injection efficiency.8 Also, the TiO2 conductive band levels are relatively close in energy to the excited state levels of the dye II when 4-TBP is present in the electrolyte, so the Jsc value of II is drastically decreased.
Table 2 Performance parameters of liquid electrolyte solar cells sensitized by dyesa
|
Dye
|
J
sc/mA cm−2 |
V
oc/V |
ff |
η (%) |
|
The listed data are results from the measurement which has the closest value to the average of 6 × measurement.
4-TBP: 4-tert-butylpyridine.
|
|
I
|
11.58 |
0.439 |
0.55 |
2.59 |
|
I/4-TBPb |
3.93 |
0.522 |
0.71 |
1.46 |
|
II
|
15.92 |
0.495 |
0.56 |
4.19 |
|
II/4-TBP |
2.45 |
0.537 |
0.71 |
0.94 |
|
N719
|
18.5 |
0.648 |
0.65 |
7.79 |
 |
| | Fig. 4
IPCE (a) and photocurrent–voltage curves (b) of TiO2electrodes obtained with liquid electrolyte solar cells sensitized by dyes with I (●), II (○), I/4-TBP (■), and II/4-TBP (□) sensitized TiO2electrodes. | |
Performances of quasi-solid-state electrolyte dye-sensitized solar cells
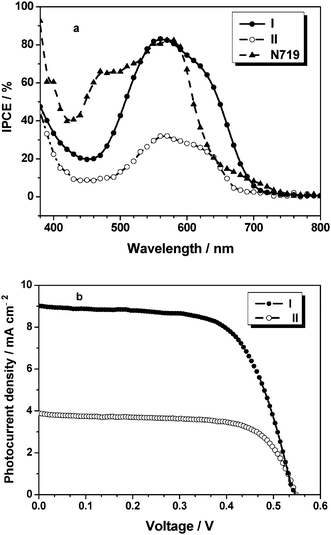
Since long-term stability is a vital parameter for sustained cell operation, we substituted the liquid electrolyte with a quasi-solid-state one. I and II organic dyes were evaluated as sensitizers for the quasi-solid-state dye-sensitized solar cell using 0.5 M iodine and 0.45 M benzimidazole (BI) in pure BMII (1-butyl-3- methylimidazolium iodide) as redox electrolyte.41Fig. 5(a) shows the incident monochromatic photon-to-current conversion efficiency (IPCE) of TiO2electrodes obtained with quasi-solid-state solar cells sensitized by dyes I and II. From Fig. 5(a) we can see that I and II can efficiently convert visible light to photocurrent in the region from 400 to 700 nm. The IPCE data exceed 50% for I and 15% for II in the spectral range 507–649 nm, respectively, which reaches its maximum of 83% for I at 558 nm and 32% for II at 562 nm, respectively. The IPCE performance of the quasi-solid-state DSSCs based I is higher than that of II, though the action spectra for I is similar to that for II. In addition, the IPCE value of I in the range 600 to 700 nm is higher than that for the standard N719. Therefore, the I type of sensitizer could become very attractive, where an extended absorption spectra will enhance the cell efficiency.
 |
| | Fig. 5
IPCE (a) and photocurrent–voltage curves (b) of TiO2electrodes obtained with quasi-solid-state solar cells sensitized by dyes with I (●), II (○). | |
Photovoltaic performances of the I and II sensitized TiO2 film electrodes with a quasi-solid-state electrolyte are listed in Table 3 under standard global AM 1.5 solar conditions (100 mW cm−2), and the corresponding photocurrent–voltage curves are shown in Fig. 5(b). The I-sensitized cell gave a short circuit photocurrent density (Jsc) of 9.12 mA cm−2, an open circuit voltage (Voc) of 0.540 V and a fill factor (ff) of 0.64, corresponding to an overall conversion efficiency (η) of 3.19%. Under the same conditions, the II-sensitized cell gave a Jsc value of 4.48 mA cm−2, a Voc of 0.552 V and an ff of 0.68, corresponding to the η value of 1.69%.
Table 3 Performance parameters of quasi-solid-state solar cells sensitized by dyesa
|
Dye
|
J
sc/mA cm−2 |
V
oc/V |
ff |
η (%) |
|
The listed data are results from the measurement which has the closest value to the average of 6 × measurement.
|
|
I
|
9.12 |
0.540 |
0.64 |
3.19 |
|
II
|
4.48 |
0.552 |
0.68 |
1.69 |
|
N719
|
13.3 |
0.636 |
0.67 |
5.65 |
The influence of more than 20 different benzimidazole (BI) additives on the performance of a Ru complex (N719) dye-sensitized TiO2 solar cell with an I−/I3−redox electrolyte in acetonitrile was investigated.42 It was found that addition of benzimidazole drastically reduced the Jsc of the solar cell, but enhanced the Voc and ff. The addition of N-methyl-benzimidazole to I−/I3−quasi-solid-state electrolytes for dye-sensitized solar cells was reported.39 We note that in a quasi-solid-state device used in this work, the two cells displayed improved Voc and ff values, but lower Jsc values, which is consistent with the results for 4-TBP additives added in liquid cells. According to previous studies,41,42 it was speculated that the influence of BI on the dye-sensitized solar cell performance was due to the electron donor ability of the nitrogen lone pairs in the BI ring. Adsorption of negatively charged ions or Lewis base molecules like BI shifts the TiO2 conduction band edge to a more negative potential, which decreases the electron injection rate from the exiting dye and explains the lower Jsc values in the presence of BI. However, the Jsc value of the II-sensitized solar cell drastically decreased, which may be because the relative closeness between the excited state level in II and TiO2 CB levels results in slower injection kinetics and poorer injection efficiencies in the quasi-solid-state electrolyte. On the other hand, benzimidazole can adsorb onto the Lewis acid sites of the TiO2 surface, which more efficiently suppresses the dark current arising from the I3−reduction by the conduction band electrons at the semiconductor electrolyte junction and gives higher Voc.
It is interesting to compare the conversion efficiency (η) of I and II-sensitized solar cells in quasi-solid-state electrolytes with that in liquid electrolytes, in which the η value is a little enhanced for I and drastically decreased for II in quasi-solid-state electrolytes. The reason is most likely because improved Voc and ff values can compensate for the loss of Jsc for I but is unable for the tremendous loss of Jsc for II, resulting in enhanced η for I and decreased η for II in quasi-solid-state electrolytes. This suggests that a combination of reduced injection driving force (∼0.2 V) and weaker coupling between the excited state level in II and TiO2 CB levels result in slower injection kinetics and poorer injection efficiencies in cases where the TiO2 CB levels are relatively close in energy to the excited state levels of the dye in the quasi-solid-state electrolyte. Those observations in quasi-solid-state cells are somewhat different from the results in liquid cells, which means that other factors, such as pore penetration by intimate contacts between dye and quasi-solid-state electrolyte, should also be considered in the performance of quasi-solid-state cells. The larger η of I than II in quasi-solid-state cells can be tentatively attributed to the well injection efficiency capability from the starburst triarylamine group and the prevention of dye aggregates on the semiconductor.
Fig. 6 shows the photovoltaic performance during a long term accelerated aging of a I sensitized solar cell using a quasi-solid-state electrolyte in a solar simulator at full intensity (100 mW cm−2) and 60 °C.31 Values for the short-circuit current (Jsc), open-circuit potential (Voc), fill factor (ff), and overall efficiency (η) were recorded over a period of 1000 h. I-sensitized solar cell was subjected to accelerated testing in a solar simulator at 100 mW cm−2 intensity at 60 °C. Jsc increased gradually for the first 400 h and then remained almost constant for 1000 h. The increase in photocurrent from the initial value is calculated to be ∼35%. Contrasting to the Jsc increase under illumination, Voc dropped by ∼38 mV. The decrease in Voc may be due to an enhancement of the dark current. The Jsc gain compensates the loss of Voc, resulting in almost constant efficiency during light soaking. As a consequence, the η first increased from 2.34 to 3.19% and then remained almost constant for 1000 h.
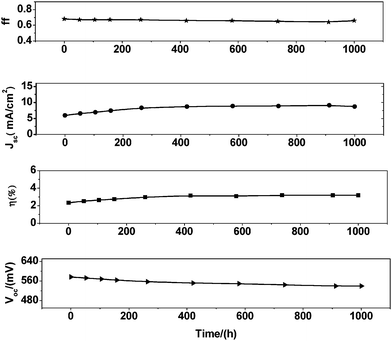 |
| | Fig. 6 Stability test photovoltaic parameter (Jsc, Voc, ff, and η) variations with aging time for the device based on 12 µm film sensitized with I and quasi-solid-state electrolyte during successive 1 sun visible-light soaking at 60 °C. | |
Conclusion
In summary, a new cyanine dye I that contained a starburst triphenylamine donor and carboxylic acid acceptor bridged by a trimethine cyanine conjugation fragment has been synthesized and investigated for dye-sensitized solar cells. And we also synthesized the corresponding cyanine dye II containing one triphenylamine unit for the purpose of comparison. The photovoltaic performance of two dyes as sensitizers in mesoporous TiO2 solar cells was investigated using liquid electrolytes containing the iodide/triiodide redox couple and quasi-solid-state electrolytes with 0.5 M iodine and 0.45 M BI in pure BMII as redox electrolyte. The quasi-solid-state DSSCs based on the dye I achieved the better photovoltaic performance of 3.19% (Jsc = 9.12 mA cm−2, Voc = 0.54 V, ff = 0.64) under AM 1.5 solar simulator (100 mW cm−2) and long-term stability. Our finding demonstrates that introduction of a starburst triphenylamine group as the electron-donor unit brought about improved photovoltaic performance compared with the single triphenylamine unit counterpart in quasi-solid-state electrolytes. It might be a promising way to inhibit aggregation between molecules and enhance the stability of the solar cells. Work to extend the spectral response of these sensitizers further into the red and near IR spectral region is in progress.
Acknowledgements
This work was supported by NSFC/China (20772031), the National Basic Research 973 Program (2006CB806200) and the Scientific Committee of Shanghai.
References
-
(a) M. K. Nazeeruddin, A. Kay, I. Rodicio, R. H. Baker, E. Müller, P. Liska, N. V. Lachopoulos and M. Grätzel, J. Am. Chem. Soc., 1993, 115, 6382 CrossRef CAS;
(b) L. Moreira Gonçalves, V. de Zea Bermudez, H. A. Ribeiro and A. Magalhães Mendes, Energy Environ. Sci., 2008, 1, 655 RSC;
(c) M. Pagliaro, G. Palmisano, R. Ciriminna and V. Loddo, Energy Environ. Sci., 2009, 2 10.1039/b903030a.
-
(a) P. Wang, C. Klein, R. H. Baker, S. M. Zakeeruddin and M. Grätzel, J. Am. Chem. Soc., 2005, 127, 808 CrossRef CAS;
(b) J. H. Yum, I. Jung, C. Baik, J. Ko, M. K. Nazeeruddin and M. Grätzel, Energy Environ. Sci., 2009, 2, 100 RSC;
(c) T. W. Hamann, R. A. Jensen, A. B. F. Martinson, H. V. Ryswyk and J. T. Hupp, Energy Environ. Sci., 2008, 1, 66 RSC.
- K. Hara, K. Sayama, Y. Ohga, A. Shinpo, S. Suga and H. Arakawa, Chem. Commun., 2001, 569 RSC.
- K. Hara, Z. S. Wang, T. Sato, A. Furube, R. Katoh, H. Sugihara, Y. Dan-oh, C. Kasada, A. Shinpo and S. Suga, J. Phys. Chem. B, 2005, 109, 15476 CrossRef CAS.
- Z. S. Wang, Y. Cui, Y. Dan-oh, C. Kasada, A. Shinpo and K. Hara, J. Phys. Chem. C, 2008, 112, 17011 CrossRef CAS.
-
(a) K. Sayama, K. Hara, N. Mori, M. Satsuki, S. Suga, S. Tsukagoshi, Y. Abe, H. Sugihara and H. Arakawa, Chem. Commun., 2000, 1173 RSC;
(b) W. J. Wu, J. L. Hua, Y. H. Jin, W. H. Zhan and H. Tian, Photochem. Photobiol. Sci., 2008, 7, 63 RSC.
-
(a) T. Horiuchi, H. Miura, K. Sumioka and S. Uchida, J. Am. Chem. Soc., 2004, 126, 12218 CrossRef CAS;
(b) B. Liu, W. H. Zhu, Q. Zhang, M. Xu, Z. Ning, Y. Xie and H. Tian, Chem. Commun., 2009, 1766 RSC.
- T. Marinado, D. P. Hagberg, M. Hedlund, T. Edvinsson, E. M. J. Johansson, G. Boschloo, H. Rensmo, T. Brinck, L. C. Sun and A. Hagfeldty, Phys. Chem. Chem. Phys., 2009, 11, 133 RSC.
- K. Hara, T. Sato, R. Katoh, A. Furube, T. Yoshihara, M. Murai, M. Kurashige, S. Ito, A. Shinpo, S. Suga and H. Arakawa, Adv. Funct. Mater., 2005, 15, 246 CrossRef CAS.
- Z. S. Wang, F. Y. Li and C. H. Huang, Chem. Commun., 2000, 2063 RSC.
- Q. H. Yao, F. S. Meng, F. Y. Li, H. Tian and C. H. Huang, J. Mater. Chem., 2003, 13, 1048 RSC.
- M. Velusamy, K. R. J. Thomas, J. T. Lin, Y. C. Hsu and K. C. Ho, Org. Lett., 2005, 7, 1899 CrossRef CAS.
- T. Kitamura, M. Ikeda, K. Shigaki, T. Inoue, N. Anderson, X. Ai, T. Lian and S. Yanagida, Chem. Mater., 2004, 16, 1806 CrossRef CAS.
- D. P. Hagberg, T. Edvinsson, T. Marinado, G. Boschloo, A. Hagfeldt and L. Sun, Chem. Commun., 2006, 2245 RSC.
- H. N. Tian, J. X. Pan, R. K. Chen, M. Liu, Q. Y. Zhang, A. Hagfeldt and L. C. Sun, Adv. Funct. Mater., 2008, 18, 3461 CrossRef CAS.
- P. Qin, H. J. Zhu, T. Edvinsson, G. Boschloo, A. Hagfeldt and L. C. Sun, J. Am. Chem. Soc., 2008, 130, 8570 CrossRef CAS.
- S. Kim, J. K. Lee, S. O. Kang, J. Ko, J. H. Yum, S. Fantacci, F. D. Angelis, D. D. Censo, M. K. Nazeeruddin and M. Grätzel, J. Am. Chem. Soc., 2006, 128, 16701 CrossRef CAS.
- D. Kim, J. K. Lee, S. O. Kang and J. Ko, Tetrahedron, 2007, 63, 1913 CrossRef CAS.
- H. Choi, J. K. Lee, K. Song, S. O. Kang and J. Ko, Tetrahedron, 2007, 63, 3115 CrossRef CAS.
- R. Chen, X. Yang, H. N. Tian and L. Sun, J. Photochem. Photobiol., A, 2007, 189, 295 CrossRef CAS.
- S. L. Li, K. J. Jiang, K. F. Shao and L. M. Yang, Chem. Commun., 2006, 2792 RSC.
- R. Chen, X. Yang, H. N. Tian, X. Wang, A. Hagfeldt and L. Sun, Chem. Mater., 2007, 19, 4007 CrossRef CAS.
- D. P. Hagberg, T. Marinado, K. M. Karlsson, K. Nonomura, P. Qin, G. Boschloo, T. Brinck, A. Hagfeldt and L. Sun, J. Org. Chem., 2007, 72, 9550 CrossRef CAS.
- D. Liu, R. W. Fessenden, G. L. Hug and P. V. Kamat, J. Phys. Chem. B, 1997, 101, 2583 CrossRef CAS.
- H. Choi, C. Baik, S. O. Kang, J. Ko, M. S. Kang, M. K. Nazeeruddin and M. Grätzel, Angew. Chem., Int. Ed., 2008, 47, 327 CrossRef CAS.
- S. Hwang, J. H. Lee, C. Park, H. Lee, C. Kim, C. Park, M. H. Lee, W. Lee, J. Park, K. Kim, N. G. Park and C. Kim, Chem. Commun., 2007, 46, 4887 Search PubMed.
- K. R. J. Thomas, J. T. Lin, Y. C. Hsu and K. C. Ho, Chem. Commun., 2005, 4098 RSC.
-
(a) M. Liang, W. Xu, F. Cai, P. Chen, B. Peng, J. Chen and Z. Li, J. Phys. Chem. C, 2007, 111, 4465 CrossRef CAS;
(b) Z. J. Ning, Q. Zhang, W. J. Wu, H. Pei, B. Liu and H. Tian, J. Org. Chem., 2008, 73, 3791 CrossRef CAS.
- M. S. Tsai, Y. C. Hsu, J. T. Lin, H. C. Chen and C. P. Hsu, J. Phys. Chem. C, 2007, 111, 18785 CrossRef CAS.
- K. R. Justin Thomas, Y. C. Hsu, J. T. Lin, K. M. Lee, K. C. Ho, C. H. Lai, Y. M. Cheng and P. T. Chou, Chem. Mater., 2008, 20, 1830 CrossRef CAS.
- Z. J. Ning, Z. Chen, Q. Zhang, Y. L. Yan, S. X. Qian, Y. Cao and H. Tian, Adv. Funct. Mater., 2007, 17, 3799 CrossRef CAS.
- Y. Shirota, J. Mater. Chem., 2000, 10, 1 RSC.
- Y. Shirota, J. Mater. Chem., 2005, 15, 75 RSC.
-
(a) W. H. Zhan, W. J. Wu, J. Y. Hua, Y. H. Jing, F. S. Meng and H. Tian, Tetrahedron Lett., 2007, 48, 2461 CrossRef CAS;
(b) X. M. Ma, J. Hua, W. Wu, Y. Jin, F. Meng, W. Zhan and H. Tian, Tetrahedron, 2008, 64, 345 CrossRef CAS.
- T. Horiuchi, H. Miura and S. Uchidab, Chem. Commun., 2003, 3036 RSC.
- A. C. Khazraji, S. Hotchandani, S. Das and P. V. Kamat, J. Phys. Chem. B, 1999, 103, 4693 CrossRef CAS.
- M. Guo, P. Diao, Y. J. Ren, F. Meng, H. Tian and S. M. Cai, Sol. Energy Mater. Sol. Cells, 2005, 88, 23 CrossRef CAS.
- P. Leriche, P. Frere, A. Cravino, O. Aleveque and J. Roncali, J. Org. Chem., 2007, 72, 8332 CrossRef CAS.
- J. P. Lu, P. F. Xia, P. K. Lo, Y. Tao and M. S. Wong, Chem. Mater., 2006, 18, 6194 CrossRef CAS.
- C. Y. Li, X. H. Yang, R. K. Chen, J. X. Pan, H. N. Tian, H. J. Zhu, X. N. Wang, A. Hagfeldta and L. C. Sun, Sol. Energy Mater. Sol. Cells, 2007, 91, 1863 CrossRef CAS.
-
(a) P. Wang, S. M. Zakeeruddin, P. Comte, I. Exnar and M. Grätzel, J. Am. Chem. Soc., 2003, 125, 1166 CrossRef CAS;
(b) G.-L. Zhang, Y. Bai, R. Li, D. Shi, S. Wenger, S. M. Zakeeruddin, M. Grätzel and P. Wang, Energy Environ. Sci., 2009, 2, 92 RSC.
- K. Hitoshi and A. Hironori, J. Photochem. Photobiol., A, 2004, 162, 441 CrossRef CAS.
|
| This journal is © The Royal Society of Chemistry 2009 |
Click here to see how this site uses Cookies. View our privacy policy here. 