Modeling and performance assessment of Pd- and Pd/Au-based catalytic membrane reactors for hydrogen production
M. Engin
Ayturk
,
Nikolas K.
Kazantzis
and
Yi Hua
Ma
*
Worcester Polytechnic Institute, Department of Chemical Engineering, 100 Institute Road, Worcester, MA 01069, USA. E-mail: yhma@wpi.edu; Fax: +1-508-831-5853; Tel: +1-508-831-5398
First published on 27th February 2009
Abstract
A mathematical steady-state modeling framework for the isothermal operation of a membrane reactor for methane steam reforming is developed, and a comparative performance assessment of the catalytic membrane reactor (CMR) versus a conventional packed bed reactor (PBR) is accordingly conducted. A detailed literature benchmarking suggests that the models developed in the present study predict total methane conversion levels within 99% of the experimental values reported in the literature. The proposed Pd- and Pd/Au-based CMR model is utilized for the aforementioned performance analysis under a broad range of reactor operating conditions such as temperature (350–750 °C), pressure (2–30 bars), steam to methane ratio (1–15), membrane thickness (1–50 µm), and permeate-side sweep ratio (1–100). In all simulation runs conducted, the superior performance of both the Pd- and Pd/Au-based CMR over the PBR was amply demonstrated. Furthermore, within the proposed CMR modeling framework, an index-based analysis is conducted that concretely quantifies progress towards the attainment of key process intensification objectives. In particular, by appropriately defining the Δ-index, which explicitly captures potential performance and process intensification benefits associated with attainable total CH4 conversion levels under different reactor operating conditions, it is shown that the optimum CMR performance is achieved at high pressure and low temperature operating conditions, which was particularly suitable for the attainment of key process intensification objectives as well as optimum performance target levels.
Broader contextCombining reaction, separation and product concentration in a single process unit via the utilization of the catalytic membrane reactors (CMR) based on composite Pd- and Pd/Alloy membranes fabricated by the electroless plating on porous sintered metal supports, provide a wide range of potential applications for the separation and production of hydrogen. In addition to the methane steam reforming and the water–gas shift reaction of the coal-derived syngas, the Pd- and Pd/Alloy-based CMR technology is attractive for the enhancement of the productivity and the economics of numerous industrial processes including hydrogenation, dehydrogenation and hydrodealkylation reactions, tritium recovery, dry reforming of methane, non-oxidative methane aromatization etc., as well as for the distributed addition of reactants and control of the reactant contact. In this context, the targeting analysis provided by the delta-index approach can be used to quantitatively capture and optimize the benefits of operating conditions, performance target levels and the key process intensification advantages of the desired CMR application. |
1. Introduction
Transforming today's oil dominated energy and transportation system to one running on hydrogen, represents one of the most daunting challenges, as global competition for oil supplies steadily intensifies. The production of hydrogenvia natural gas steam reforming (MSR) and/or water–gas shift (WGS) reaction of the coal-derived syngas in Pd- and sulfur tolerant Pd/Alloy-based catalytic membrane reactors (CMRs) is an attractive technology, which generates further interest primarily due to its great potential for process intensification.1,2 The MSR process is a well-understood and time-tested technology, which accounts for over 95% of the hydrogen (∼9–11 million tons yr−1) produced in the U.S. (48% globally).3 Indeed, the efficiency of the MSR process is about 65–75%, among the highest of commercially available production methods. Being among the least expensive and most abundant feedstocks, natural gas can play a vital role for the production of hydrogen by utilizing advanced CMR and sequestration technologies during the near- to mid-term transition to a sustainable hydrogen economy.4,5 Composite Pd and Pd/Alloy membranes supported on porous sintered metal supports with high flux, stable selectivity and improved thermal, chemical and mechanical stability can be readily scaled-up and integrated to high-pressure and high-temperature hydrogen separation and production applications.6–10 The advantages of the Pd-based CMRs over the conventional packed bed reactors (PBRs) in the MSR process have been amply demonstrated in several experimental and theoretical/modeling studies.11–28From a traditional process intensification perspective, CMRs exhibit considerable advantages over traditional reformers including the elimination of high and low temperature shift reactors, pre-Ox and hydrogen separator, thus enabling reaction, separation and product concentration processes to take place in a single unit operation. In addition, the continuous removal of the product hydrogen during the MSR process by a CMR provides enhanced conversion beyond the static thermodynamically determined equilibrium until the limitations imposed by the underlying kinetics of the reaction system and/or the catalyst become dominant. Compared to the conventional process, higher attainable conversion levels in a Pd- and/or Pd/Alloy-based CMR allow operation to be conducted at lower temperatures, thus providing prolonged catalyst lifetime, lower production costs, reduced material costs for the reactor and the production of high-pressure CO2 readily available for sequestration.3,5,29–32 It should be emphasized that for the attainment of key process intensification goals, the integration of CMRs into the MSR process not only provides compactness, modularity, reduced equipment size to production capacity ratio and operational flexibility, but also leads to considerable efficiency improvement in the use of material and energy resources, enhanced cost and waste management as well as superior environmental performance/compatibility for a given production capacity target.29,33–36 In addition, compact reformer designs utilizing CMR technology provide economically viable opportunities and/or pathways for onsite hydrogen production and the development of a hydrogen infrastructure which could supply hydrogen for commercial, domestic, vehicle and stationary energy applications.4,5
Motivated by the above considerations, the main objective of the present study is to develop a systematic and comprehensive modeling framework for the assessment of the impact of operating conditions on Pd- and Pd/Au-based CMR performance, to conduct a comparative performance assessment of the proposed CMRs versus conventional PBRs within a rather broad operating regime, as well as appropriately define indicators representing quantitative criteria through which progress towards the attainment of key process intensification goals is demonstrated. The present paper is organized as follows: In Section 2 the proposed model and its structural characteristics are presented. Section 3 encompasses a thorough discussion on the study's main research findings resulting from detailed simulation studies. Finally, a few concluding remarks are provided in Section 4.
2. Mathematical model
2.1 Methane steam reforming and water–gas shift reactions
Let us first consider the methane steam reforming (MSR) and water–gas shift (WGS) reactions, which are shown in Table 1. In a commercial reformer, the reaction takes place in a multi-tubular reactor configuration on supported Ni catalysts and operates at temperatures as high as 850 °C, within a pressure range of 16–41 bar and steam-to-methane ratios between 2 and 4.26The configuration of the single-tube membrane reactor used in this study is schematically illustrated in Fig. 1. As can be inferred from Fig. 1.ri and ro are the inner and outer radius for the membrane support in [m] and Ri and Ro are the inner and outer radius for the membrane reactor in [m].
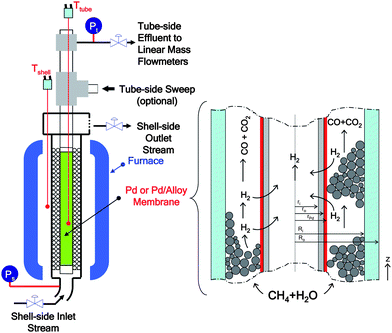 | ||
| Fig. 1 Schematic for the catalytic membrane reactor. | ||
The intrinsic reaction kinetics for the MSR and WGS reaction on a supported Ni catalyst was studied in detail and experimentally verified by Xu and Froment37 also in a tubular reactor. The reaction kinetics model reported by Xu and Froment was based on a Langmuir–Hinshelwood mechanism and adopted in this study. The rate expressions for reactions (i) to (iii) of Table 1 were given as follows:
 | (1) |
 | (2) |
 | (3) |
where ri is the reaction rate in [kmol kg−1catalyst–h], and Pi is the partial pressure of component i in the feedstock in [bar]. Based on Dalton's law, the partial pressures of the species can be expressed as follows:
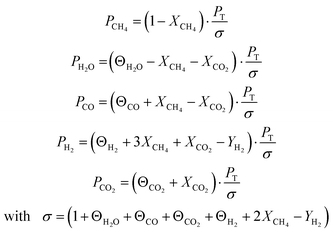 | (4) |
Reaction rate constants:  i = 1,2,3 i = 1,2,3 |
|
| k 1,648K | 1.8 × 10⁻⁴ kmol-bar0.5/kgcat-h |
| k 2,648K | 7.6 kmol/kgcat-h-bar |
| k 3,648K | 2.2 × 10⁻⁵ kmol-bar0.5/kgcat-h |
| E 1 | 240.1 kJ mol−1 |
| E 2 | 67.1 kJ mol−1 |
| E 3 | 243.9 kJ mol−1 |
Adsorption constants: j = CO, H2, CH4, H2O j = CO, H2, CH4, H2O |
|
| K CO,648K | 40.9 bar−1 |
| K H2,648K | 2.9 × 10⁻²bar−1 |
| K CH4,823K | 1.8 × 10⁻¹bar−1 |
| K H2O,823K | 0.4 (-) |
| ΔHCO | −70.7 kJ mol−1 |
| ΔHH2 | −82.9 kJ mol−1 |
| ΔHCH4 | −38.3 kJ mol−1 |
| ΔHH2O | 88.7 kJ mol−1 |
Equilibrium constants:  i = 1,2,3, where ΔGRxn = ΣνijGj° i = 1,2,3, where ΔGRxn = ΣνijGj° |
|
| G°CH4 | = −75.3 + 7.6 × 10⁻² × T(K) + 1.9 × 10⁻⁵ × T(K)2 |
| G°H2O | = −241.7 + 4.2 × 10⁻² × T(K) + 7.4 × 10⁻⁶ × T(K)2 |
| G°CO | = −109.9–9.2 × 10⁻² × T(K) + 1.5 × 10⁻⁶ × T(K)2 |
| G°H2 | = 0 |
| G°CO2 | = −393.4 + 3.8 × 10⁻³ × T(K) + 1.3 × 10⁻⁶ × T(K)2 |
The membrane reactor model is structurally comprised of the requisite set of (stoichiometrically) independent mass–balance equations that describe the steady-state spatial profiles of methane, carbon dioxide and hydrogen conversion along the tubular membrane reactor's length. Standard mass–balance equations capturing the net rates of depletion/formation for methane, carbon dioxide and hydrogen constitute the model equations and are given below:
 | (5) |
 | (6) |
 | (7) |
The above model equations are accompanied by the following set of boundary conditions dictated by physical reasons:
The main underlying assumptions for the reactor model realized by Eqn (5) to (7) were steady state operation, isothermal conditions, negligible pressure drop, plug flow in the reactor, and no interphase and intraparticle mass transfer limitations.
2.2 Hydrogen permeability in Pd and Pd/Au
As listed in Table 3, the permeability of hydrogen has been investigated extensively for Pd foils.38–43The hydrogen permeability of Pd foils within the temperature range listed in Table 3 was plotted in the Arrhenius form as shown in Fig. 2. In Fig. 2, the pre-exponential factor, Q0 and the activation energy, Ep, for the average H2 permeability were determined via linear regression analysis as 6322.7 m3-µm m−2-h-atm0.5 and 15.6 kJ mol−1, respectively and led to the following expression for the average H2 permeability of hydrogen in Pd foils in m3-µm m−2-h-atm0.5.
 | (8) |
| References | Q o/m3-µm m−2-h-atm0.5 | E a/kJ mol−1 | Temp. (°C) | Pressure (atm) |
|---|---|---|---|---|
| Koffler et al.41 | 5.7 × 10⁻³ | 15.7 | 27–436 | 4 × 10⁻⁷–7 × 10⁻⁵ |
| Toda43 | 4.5 × 10⁻³ | 13.5 | 170–290 | 0.05–0.85 |
| Davis39 | 9.9 × 10⁻³ | 18.6 | 200–700 | 3 × 10⁻⁵–1.0 |
| Balovnev38 | 6.6 × 10⁻³ | 15.5 | 100–620 | 3 × 10⁻¹⁰–7 × 10⁻⁷ |
| Morreale et al.44 | 4.9 × 10⁻³ | 13.8 | 350–900 | 1–27.9 |
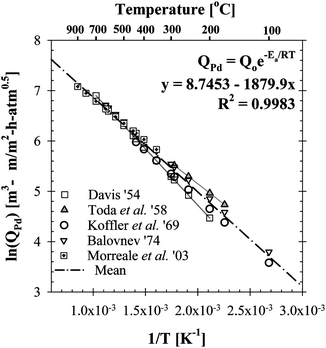 | ||
| Fig. 2 The Arrhenius plot of the literature data listed in Table 3 for the estimation of an average H2 permeability for Pd foils. | ||
The average H2 permeability for Pd in Eqn (8) approximates the reported H2 permeability data (Table 3) within an error of ±16% as reported by Ayturk.45Eqn (8) was used to estimate the rate of hydrogen removal in the catalytic membrane reactor model.
The CMR model was further utilized for the performance assessment of a Pd/Au-based membrane reactor for the methane steam reforming (MSR) and water–gas shift (WGS) reactions. In conjunction with their enhanced sulfur resistance,46Pd/Au alloys were chosen simply due to their improved hydrogen permeability, which was reported to be 2 times higher than that of pure-Pd foils at 500 °C and at a Au content range of 5–20 wt%.47–49 Therefore, the average hydrogen permeability given in Eqn (8) was modified according to the permeability data reported by Gryaznov,48 and currently summarized in Fig. 3.
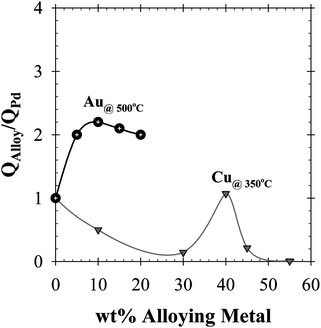 | ||
| Fig. 3 The normalized H2 permeability plot for Pd, Pd/Au and Pd/Cu foils.2,48–50 | ||
Coupled with the reaction rate expressions in Equations (i), (ii) and (iii) of Table 1, the hydrogen permeability in Eqn (8) and the partial pressures given in Eqn (4), the set of ordinary differential Eqn (5), (6) and (7) with the associated boundary conditions was solved numerically via a 4th order Runga–Kutta algorithm using the Matlab® software package. Simulation results are discussed next in greater detail.
3. Results and discussion
3.1 Model validation
The validation of the CMR and PBR models was accomplished by simulating both the membrane reactor and the packed bed reactor conditions reported by Xu and Froment,37 Matzakos et al.,21 Assaf et al.,11 Shu et al.,26 Oertel et al.,22 Hoang et al.,16 Hou and Hughes,17 Oklany et al.23 and Jorgensen et al..18 As can be inferred from Fig. 4, the membrane reactor model developed in this study predicted the total methane conversion within 99% of the experimental and simulation values reported in the literature.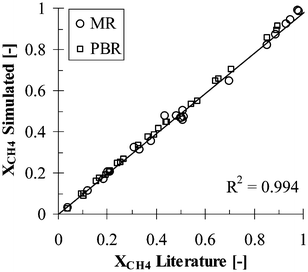 | ||
| Fig. 4 Literature versus simulated total methane conversion values. | ||
3.2 Performance analysis of the CMRvs PBR model
The performance analysis was conducted by simulating the reactor model equations for different operating parameters such as reactor temperature, pressure, steam to methane ratio and the membrane thickness, as well as evaluating their impact on the total methane conversion for both CMR and PBR cases. The reference conditions and the range of simulation parameters used for the Pd-based CMR performance analysis are shown in Table 4.| Parameters | Reference →[Range] | Description |
|---|---|---|
| r o [m] | 2.5 × 10⁻²→[0.63–5 × 10⁻²] | Outer radius of the membrane |
| R i [m] | 6.6 × 10⁻²→[1.3–6.6 × 10⁻²] | Inner radius of the reactor |
| L [m] | 12→[0.1–30] | Reactor length |
| ϕ b [-] | 50%→[10–50%] | Bed porosity |
| η [-] | 1→[1 × 10⁻³ −1] | Overall effectiveness factor |
| F 0 CH4 [kmol h−1] | 1→[0.1–1500] | Feed CH4 flow rate |
| m = F0H2O/F0CH4 | 3→[1–15] | H2O-to-CH4 ratio |
| s = F0Sweep /F0CH4 | 10→[1–100] | Sweep factor |
| T [ °C] | 500→[350–750] | Reaction temperature |
| P T [bar] | 30→[2–30] | Reaction-side total P |
| P P [bar] | 1→[0–1] | Permeate-side total P |
| δ [µm] | 5→[1–50] | Membrane thickness |
One of the major advantages of the membrane reactor over a conventional PBR is the conversion enhancement of the equilibrium-limited methane steam reforming viain-situ removal of hydrogen at moderate temperatures (i.e., ∼500 °C). The effects of temperature and pressure on the total methane conversion for a 5 µm thick Pd- and Pd/Au-based CMRs are shown in Fig. 5a and b, respectively, and compared to that of a conventional PBR.
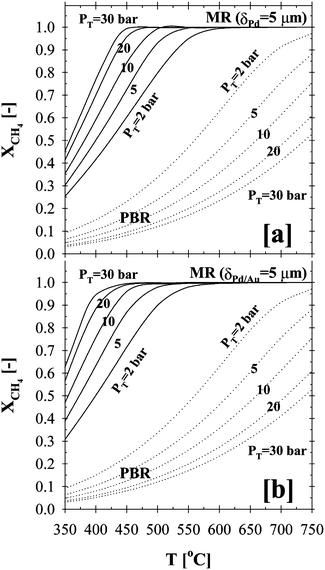 | ||
| Fig. 5 Temperature and pressure effects on the total methane conversion in (a) Pd- and (b) Pd/Au-based CMR and PBR (H2O:CH4:HeSweep = 3:1:10; T = 350–750 °C; PT = 2–30 bar; Pp = 1 bar; r0 = 2.5 × 10⁻² m; Ri = 6.6 × 10⁻² m; L = 12 m; δPd or Pd/Au = 5 µm; ϕb = 0.50; η = 1). | ||
Since the MSR reaction, shown in Table 1, is highly endothermic and accompanied by a volume expansion, it is thermodynamically favored at high temperatures and low pressures. The results shown in Fig. 5 also indicated that the total methane conversion for the conventional PBR decreased with increased pressure over the entire temperature range studied. This is due to the fact that high pressure not only enhances the forward reaction rates, but also greatly favors the backward reaction rates of the MSR reaction based on the reaction stoichiometry shown in Table 1.
In addition, the resulting high PBR conversions at elevated temperatures (i.e., ∼97% at 750 °C in Fig. 5) is due to the low pressure gradient (1 bar) used for the simulations. In agreement with Oertel et al.,22 the low partial pressure in the reaction side may lead to the decomposition of methane to carbon and hydrogen, thus resulting in a relatively high total methane conversion. It should be also noted that the low partial pressures could favor the undesirable soot formation and result in the deactivation of the reformer catalyst due to poisoning. Furthermore, in good agreement with pertinent values reported in the literature, further analysis indicated that, at 750 °C, the total methane conversion for pressures 10, 20 and 30 bars were 75%, 61% and 53%, respectively. In general, the industrial size reformers are operated at high pressures of 30–40 bars to improve the energy efficiency of the overall process.
On the other hand, as the driving force for the hydrogen permeation increased with higher pressure on the reaction side, the in-situ removal of the high partial pressure hydrogen resulted in an enhancement of the total methane conversion in the case of both CMRs over the entire temperature range as shown in Fig. 5. While the total methane conversion for the PBR at 500 °C was below ∼20% above 10 bars, complete conversion was achieved in the case of the Pd- and Pd/Au-based CMRs, as can be deduced from Fig. 5. In agreement with the simulation results, membranes prepared in our lab have been shown to be stable under MSR conditions for over 6000 h with total methane conversion and hydrogen purity values exceeding 95% and 99%, respectively.51
Although it is possible to conduct further CMRvsPBR performance assessment comparisons at different operating conditions (i.e., T and P, etc.), it is not a trivial task to quantitatively and uniquely identify the optimum conditions that would correspond to optimal reactor performance. However, in order to develop a concrete quantitative performance evaluation framework for CMRs coupled with progress assessment towards the attainment of key process intensification objectives, a set of indicators, which can be readily evaluated by simulating the current CMR and PBR models, could be used. These indicators should be physically meaningful, insightful and mathematically realized by indices, i.e. mathematical quantities that can be readily calculated on the basis of available reactor models such as the ones presented in this study. In particular, the proposed reactor performance criteria and process intensification indicators should be realized in terms of conversion, hydrogen recovery, membrane selectivity, reaction temperature and prolonged catalyst lifetime, process modularity, as well as energy and fuel savings and effective use of resources. In an effort to appropriately define indicators that would also introduce concrete quantitative criteria for the attainment of the aforementioned key process intensification objectives, a process indicator can be defined and mathematically realized through the Δ-index, representing the difference between the total CH4 conversion achieved by the CMR and the one by PBR, when their respective behavior is simulated under similar conditions. Please notice that the Δ-index is a function of process parameters as well as operating conditions and given by the following Eqn (9).
| Δ = XCH4,MR − XCH4,PBR | (9) |
In contrast to qualitative process intensification indicators reported in the literature,34,35 which were expressed as ratios and thresholds with mathematical criteria of the >1 and/or <1 type, the difference approach introduces a more physically transparent, meaningful, and explicit criterion that enables a more direct and insightful quantitative assessment of the performance of CMRs over the more traditional PBRs. These methodological advantages become evident through the results shown in Fig. 5 and the trends in temperature and pressure profiles clearly highlighted via the Δ-index plot shown in Fig. 6
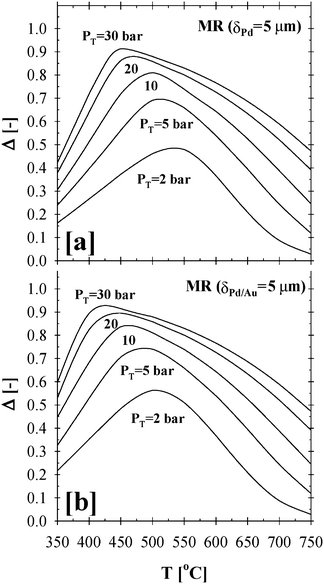 | ||
| Fig. 6 Δ-index plot summarizing the impact of pressure and temperature effects on the total methane conversion for the (a) Pd- and (b) Pd/Au-based CMRs (H2O:CH4:HeSweep = 3:1:10; T = 350–750 °C; PT = 2–30 bar; Pp = 1 bar; r0 = 2.5 × 10⁻² m; Ri = 6.6 × 10⁻² m; L = 12 m; δPd or Pd/Au = 5 µm; ϕb = 0.50; η = 1). | ||
Based on the previously defined Δ-index, the optimum operating conditions for the 5 µm thick Pd- and Pd/Au-based CMR were predicted to occur at a high pressure of 30 bars and a low temperature range of 425–450 °C and 400–425 °C, respectively, as shown in Fig. 6a and b. It should also be noted that the enhancement of the total methane conversion by a value as high as 90–95% at a lower temperature range of 400–450 °C will significantly prolong the lifetime of an active catalyst, help reduce material costs and result in fuel savings towards the attainment of less energy intensive process conditions.
It should be pointed out that methane steam reforming generally takes place in the presence of excess steam to prevent coke formation on the surface of the catalyst and to enhance the reaction conversion. The effect of steam to methane ratio (m) on the total methane conversion was investigated within a molar steam to methane ratio range of 1 to 10 at 500 °C and over a pressure range of 2–30 bars, as shown in Fig. 7. In all cases simulated, the maximum was achieved within a steam-to-methane ratio of 2–3. Although the methane conversion was increased linearly with the use of excess steam for both CMR and PBR, the Δ-index plot showed that the performance deteriorated for m > 3. Since high steam-to-methane ratios (m > 3) would also require additional amount of energy to produce steam, the suggested range of operating conditions shown in Fig. 7 would also help improve the energy efficiency of the process. It was also interesting to note that both Pd- and Pd/Au-based CMRs resulted in an almost identical performance pattern at a reaction-side pressure of 15 bar and above (Fig. 7). The difference in the Δ-index values of Pd- and Pd/Au-based CMRs for total pressure of 5 and 2 bar were ∼5 and ∼10%, respectively. However, the performance of the Pd/Au-based CMR under similar conditions (5 and 2 bar) was as high as 75 and ∼58% compared to that of a PBR.
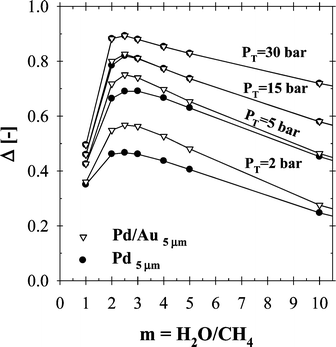 | ||
| Fig. 7 The effect of steam to methane ratio on CMR performance (H2O:CH4:HeSweep = (1–10):1:10; T = 500 °C; PT = 2–30 bar; Pp = 1 bar; r0 = 2.5 × 10⁻² m; Ri = 6.6 × 10⁻² m; L = 12 m; δPd or Pd/Au = 5 µm; ϕb = 0.50; η = 1). | ||
Fig. 8 shows the effect of the Pd and Pd/Au membrane thickness on the total methane conversion at 350 and 500 °C, over a pressure range of 2–30 bar, and a steam-to-methane ratio of 3. As can be inferred from Fig. 8a and b, the thinner the separation layer, the higher the rate of hydrogen removal and thus the total conversion efficiency. At 350 °C, the Δ-index plot for both the Pd- and Pd/Au-based CMRs showed similar trends as a function of increased reaction pressure. According to the simulation results at 500 °C, the Δ-index plots highlight the thickness range where the transition between the permeation and kinetics limitations takes place. For instance, the CMR operated at 500 °C and a pressure of 5, 10, 20 and 30 bar was predicted to be limited by the permeation of the Pd-film above a thickness of 3, 5, 8 and 9 µm, respectively. On the other hand, the performance of the Pd/Au-based CMR (Fig. 8b) at 500 °C and over a pressure range of 20–30 bar was only limited by the reaction kinetics due to the higher H2 permeability enhanced by alloying Pd with Au.
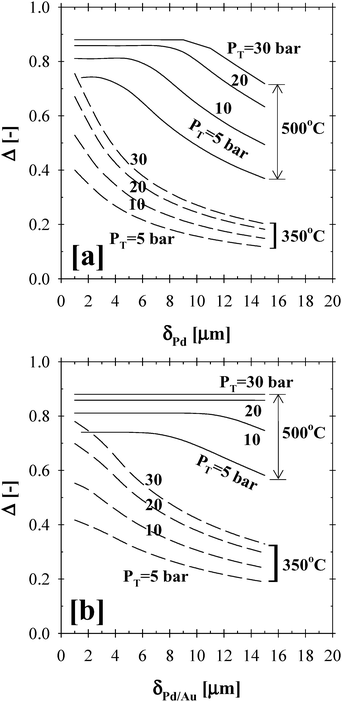 | ||
| Fig. 8 The effect of membrane thickness on the (a) Pd- and (b) Pd/Au-based CMR performance (H2O:CH4:HeSweep = 3:1:10; T = 350–500 °C; PT = 5–30 bar; Pp = 1 bar; r0 = 2.5 × 10⁻² m; Ri = 6.6 × 10⁻² m; L = 12 m; δPd or Pd/Au = 1–15 µm; ϕb = 0.50; η = 1). | ||
Moreover, the effect of the sweep gas ratio was studied at 350 °C, over a pressure range of 15–30 bars, steam to methane ratio of 3 and for Pd and Pd/Au membrane thickness range of 1–15 µm. As shown in Fig. 9, the addition of the sweep stream to the permeate side of the membrane reactor had a noticeable effect on achieving the maximum methane conversion due to the increased driving force for the hydrogen permeation flux, especially for 5 and 10 µm thick Pd and/or Pd/Au films. Indeed, the Δ-index plots in Fig. 9a and b clearly demonstrated that the impact of the sweep gas on the CMR performance was significant up to a sweep ratio of ∼40. It should be noted that the simulations based on the varying sweep ratio were conducted by assuming that there was no mass transfer resistance at the permeate-side due to the binary diffusion of hydrogen through the inert sweep gas.
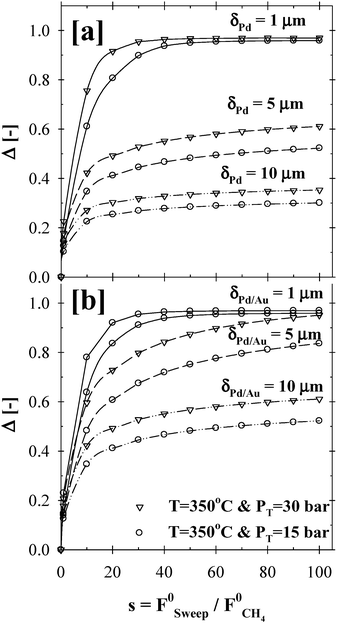 | ||
| Fig. 9 The effect of sweep gas flow rate on the (a) Pd- and (b) Pd/Au-based CMR performance (H2O:CH4:HeSweep = 3:1:(1:10:100); T = 350 °C; PT = 15–30 bar; Pp = 1 bar; r0 = 2.5 × 10⁻² m; Ri = 6.6 × 10⁻² m; L = 12 m; δPd or Pd/Au = 1–10 µm; ϕb = 0.50; η = 1). | ||
In addition to the aforementioned process intensification results, the membrane compactness was further demonstrated in Fig. 10. As the membrane surface area or the ratio ro/Ri increased as shown in Fig. 10a, the maximum conversion in a 5 µm thick Pd-based CMR was achieved at a shorter distance along the length of the reactor above 400 °C, thus requiring a smaller unit compared to that of conventional PBRs. In addition, operating the CMR at high pressures not only resulted in the attainment of the maximum conversion but also required a smaller reactor volume, as shown in Fig. 10b.
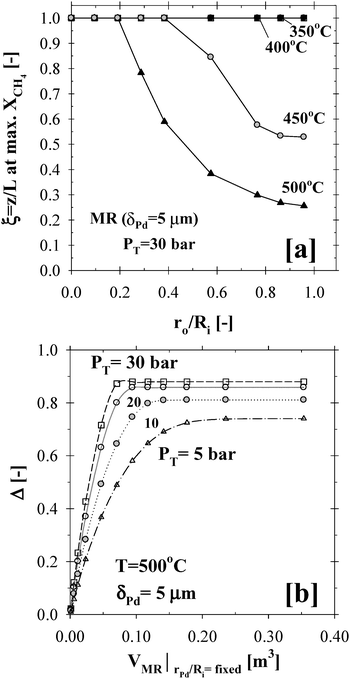 | ||
| Fig. 10 Reactor compactness and the effects of temperature and pressure on the (a) Membrane surface area (r0/Ri ratio) and (b) Reactor volume (H2O:CH4:HeSweep = 3:1:10; T = 350–500 °C; PT = 30 bar; Pp = 1 bar; r0 = 2.5 × 10⁻² m; Ri = 6.6 × 10⁻² m; L = 12 m; δPd = 5 µm; ϕb = 0.50; η = 1). | ||
As pointed out by Al-Otaibi and El-Halwagi33 identifying bounds on process performance prior to carrying out extensive design and optimization computations is critical. Therefore, targeting is an important concept that refers to the identification/determination and optimization of the process performance limits without commitment to the final design configuration. Indeed, targeting analysis is of great importance from a process systems engineering perspective, which could help identify benchmarks for improvement opportunities and intensification strategies ahead of detailed design. In this respect, the Δ-index approach can be further utilized not only for the identification of best performance of the CMR design and subsequent benchmarking analysis but also for targeting specific production and/or design scenarios. For instance, Pd- and Pd/Au-based CMRs operating at 450 °C, a total reaction-side pressure of 30 bar and a steam-to-methane ratio of 3 would require a membrane surface area of 1.65 and 0.82 m2, respectively, based on a thickness of 5 µm and for a plant producing 1500 kg H2 day−1. The reference geometry for the single-tube, as summarized in Table 4, was already high enough (1.91 m2) to meet the set design criteria with complete methane conversion and Δ-index values above 91%. The total methane conversion for a traditional PBR under identical operating conditions was only ∼8%.
4. Conclusions
Compared to attainable performance levels associated with a conventional PBR, the model simulations based on the Pd- and Pd/Au-based membrane reactors showed that total methane conversion was significantly higher in the case of CMRs over the entire regime of operating conditions examined in the present study. The proposed CMR modeling framework was further utilized for process intensification analysis purposes in conjunction with the introduction of a key process intensification and performance indicator mathematically realized by the Δ-index. According to the Δ-index analysis, the maximum performance (Δ ≥ 90%) for both Pd- and Pd/Au-based industrial CMRs was attained within the operating conditions ranges of temperature 400–450 °C, pressure ≥20 bar, thickness <10 µm, steam-to-methane ratio 2.5 ≤ m ≤ 3 and sweep factor s ≥ 40. It was also shown that the superior performance of the CMRs over PBRs, offers great advantages for the realization of key process intensification objectives that would yield high reaction conversion levels, low temperature operation, prolonged catalyst lifetime, energy and fuel savings, improved process economics, compact modular design prospects and operational flexibility.Acknowledgements
The authors gratefully acknowledge the financial support provided by the U.S. Department of Energy under Award Number DE-FC26-07NT43058.References
- E. Kikuchi, Catal. Today, 2000, 56, 97 CrossRef CAS.
- J. Shu, B. P. A. Grandjean, A. Van Neste and S. Kaliaguine, Can. J. Chem. Eng., 1991, 69, 1036–1060 CAS.
- Y. H. Ma, in Membrane Technology: Volume: 2 Membranes for Energy Conversion, ed. K.-V. Peinemann and S. P. Nunes, Wiley-VCH, 2008, vol. 2, p. 245 Search PubMed.
- DOE, Hydrogen Program Plan, Office of Fossil Energy, 2003 Search PubMed.
- DOE, Hydrogen, Fuel Cells & Infrastructure Technologies Program Multi-Year Research, Development and Demonstration Plan, Office of Energy Efficiency and Renewable Energy, 2007 Search PubMed.
- M. E. Ayturk, I. P. Mardilovich, E. E. Engwall and Y. H. Ma, J. Membr. Sci., 2006, 285, 385 CrossRef.
- Y. H. Ma, B. C. Akis, M. E. Ayturk, F. Guazzone, E. E. Engwall and I. P. Mardilovich, Ind. Eng. Chem. Res., 2004, 43, 2936–2945 CrossRef CAS.
- Y. H. Ma, I. P. Mardilovich and E. E. Engwall, US Pat. 7,175,694, 2007.
- Y. H. Ma, P. P. Mardilovich and Y. She, US Pat. 6,152,987, 2000.
- P. P. Mardilovich, Y. She, Y. H. Ma and M.-H. Rei, AIChE J., 1998, 44, 310 CrossRef CAS.
- E. M. Assaf, C. D. F. Jesus and J. M. Assaf, Braz. J. Chem. Eng., 1998, 15 Search PubMed.
- G. Barbieri, G. Marigliano, G. Perri and E. Drioli, Ind. Eng. Chem. Res., 2001, 40, 2017–2026 CrossRef CAS.
- G. Barbieri, V. Violante, F. P. Di Maio, A. Criscuoli and E. Drioli, Ind. Eng. Chem. Res., 1997, 36, 3369–3374 CrossRef CAS.
- F. A. N. Fernandes and A. B. Soares Jr., Fuel, 2006, 85, 579–573.
- F. Gallucci, L. Paturzo and A. Basile, Int. J. Hydrogen Energy, 2004, 29, 611–617 CrossRef CAS.
- D. L. Hoang, S. H. Chan and O. L. Ding, Chem. Eng. J., 2005, 112, 1–11 CrossRef CAS.
- K. Hou and R. Hughes, Chem. Eng. J., 2001, 82, 311–328 CrossRef CAS.
- S. L. Jorgensen and P. E. H. L. Nielsen, Catal. Today, 1995, 25, 303–307 CrossRef.
- G. Marigliano, G. Barbieri and E. Drioli, Catal. Today, 2001, 67, 85–99 CrossRef CAS.
- G. Marigliano, G. Barbieri and E. Drioli, Chem. Eng. Process., 2003, 42, 231–236 CrossRef CAS.
- A. N. Matzakos, S. L. Wellington, T. Mikus, J. Michael and K. Ward, US Pat. 6,821,501 B2, 2004.
- M. Oertel, J. Schmitz, W. Weirich, D. Jendryssek-Neumann and R. Schulten, Chem. Eng. Technol., 1987, 10, 248–255 CrossRef.
- J. S. Oklany, K. Hou and R. Hughes, Appl. Catal., A, 1998, 170, 13–22 CrossRef CAS.
- M. N. Pedernera, J. Pina and D. O. Borio, Chem. Eng. J., 2007, 134, 138–144 CrossRef CAS.
- M. N. Pedernera, J. Pina, D. O. Borio and V. Bucala, Chem. Eng. J., 2003, 94, 29–40 CrossRef CAS.
- J. Shu, B. P. A. Grandjean and S. Kaliguine, Appl. Catal., A, 1994, 119, 305–325 CrossRef CAS.
- J. Tong, Y. Matsumura, H. Suda and K. Haraya, Ind. Eng. Chem. Res., 2005, 44, 1454–1465 CrossRef CAS.
- N. Itoh, Y. Kaneko and A. Igarashi, Ind. Eng. Chem. Res., 2002, 41, 4702–4706 CrossRef CAS.
- E. Drioli, A. Criscuoli and E. Curcio, Chem. Eng. Technol., 2003, 26, 975–981 CrossRef CAS.
- A. G. Dixon, Int. J. Chem. React. Eng., 2003, 1, R6 Search PubMed.
- P. Ferreira-Aparicio, M. Benito, K. Kouachi and S. Menad, J. Catal., 2005, 231, 331–343 CrossRef CAS.
- G. Q. Lu, J. C. Diniz da Costa, M. Duke, S. Giessler, R. Socolow, R. H. Williams and T. Kreutz, J. Colloid Interface Sci., 2007, 314, 589–603 CrossRef CAS.
- M. Al-Otaibi and M. El-Halwagi, Chem. Eng. Res. Des., 2006, 84, 943–951 CrossRef CAS.
- P. Bernardo, G. Barbieri and E. Drioli, Chem. Eng. Res. Des., 2006, 84, 405–411 CrossRef CAS.
- A. Criscuoli and E. Drioli, Ind. Eng. Chem. Res., 2007, 46, 2268–2271 CrossRef CAS.
- E. Drioli, Clean Technol. Environ. Policy, 2003, 5, 3–4 Search PubMed.
- J. Xu and G. F. Froment, AIChE J., 1989, 35, 88–96 CrossRef CAS.
- Y. A. Balovnev, Russ. J. Phys. Chem., 1974, 48, 409–410.
- W. Davis, USAEC Report KAPL-1227, U.S. Atomic Energy Commission, 1954 Search PubMed.
- C. Hermann, P. Quicker and R. Dittmeyer, J. Membr. Sci., 1997, 136, 161–172 CrossRef CAS.
- S. A. Koffler, J. B. Hudson and G. S. Ansell, Trans. Metall. Soc. AIME, 1969, 245, 1735–1740 Search PubMed.
- B. D. Morreale, M. V. Ciocco, B. H. Howard, R. P. Killmeyer, A. V. Cugini and R. M. Enick, J. Membr. Sci., 2004, 241, 219 CrossRef CAS.
- G. Toda, J. Res. Inst. Catal. Hokkaido Univ., 1958, 6, 13 Search PubMed.
- B. D. Morreale, M. V. Ciocco, R. M. Enick, B. I. Morsi, B. H. Howard, A. V. Cugini and K. S. Rothenberger, J. Membr. Sci., 2003, 212, 87 CrossRef CAS.
- M. E. Ayturk, Ph.D. Thesis,Worcester Polytechnic Institute, Worcester, MA 01069, 2007.
- A. A. Rodina, M. A. Gurevich and N. I. Doronicheva, Russ. J. Phys. Chem., 1971, 45, 621–623.
- D. L. McKinley, US Pat. 3,350,845, 1967.
- V. Gryaznov, Sep. Purif. Methods, 2000, 29 Search PubMed.
- D. L. McKinley and W. V. Nitro, US Pat. 3,247,648, 1966.
- A. G. Knapton, Platinum Met. Rev., 1977, 21, 44–50 CAS.
- A. N. Matzakos, in NHA Annu. Hydrogen Conf., Long Beach, CA, 2006 Search PubMed.
| This journal is © The Royal Society of Chemistry 2009 |


