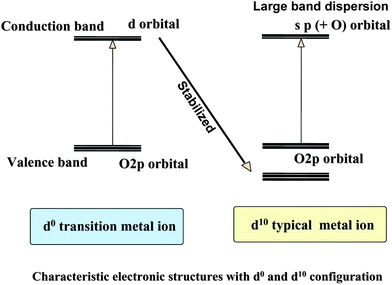
Photocatalytic water splitting by RuO2-loaded metal oxides and nitrides with d0- and d10 -related electronic configurations
Yasunobu
Inoue
*
Department of Chemistry, Nagaoka University of Technology, Nagaoka, 940-2137, Japan. E-mail: inoue@analysis.nagaokaut.ac.jp; Fax: +81 258 47 9830; Tel: + 81 258 47 9832
First published on 20th February 2009
Abstract
This article reviews photocatalysis for water splitting by various kinds of metal oxides and nitrides such as ferroelectric metal oxides, different kinds of titanates with d0 (Ti4+) electronic configuration as a core metal ion, and various typical metal oxides with d10 (In3+, Ga3+, Ge4+, Sn4+, Sb5+) configuration, and d10 (Ga3+) metal nitride, together with d10s2 (Pb2+) and d0f0 (Ce4+) metal oxides. Ferroelectric metal oxides with single domain structure showed anomalous photovoltaic effects that controlled the behavior of photoexcited electrons. Various metal oxides involving ionic alkaline metal/alkaline earth metal ions showed good correlation between photocatalytic activity and the distortion of octahedral XO6/tetrahedral XO4 (X = core metal ion). When the metal oxides involved covalent metal ions such as Zn2+ and Pb2+, the activity was invoked even in distortion-free structures: this is due to strong electronic effects that affect the band structure. The activity of d10 metal oxides and nitrides is associated with conduction bands of hybridized sp orbitals with large dispersion that are able to generate photoexcited electrons with large mobility. A feature of the photocatalytically active metal oxides and nitrides discovered so far, which is their closed shell electronic structures is discussed.
 Yasunobu Inoue Yasunobu Inoue | Yasunobu Inoue received his Doctoral degree in Chemistry from Tokyo Institute of Technology and became a faculty member of Nagaoka University of Technology. He is currently Specially Appointed Professor in Research(Chemistry) at Nagaoka University of Technology. In 2002, he received an award for his academic achievements from the Catalysis Society of Japan. His research focuses on water photolysis by solids, the artificial control of heterogeneous catalysis using surface acoustic waves and resonance oscillation, and the design of selective catalysts for hydrogenation and partial oxidation. |
Broader contextThe potential for splitting water by a combination of photocatalysts and solar energy is receiving strong interest because of its importance to the hydrogen economy. The development of highly efficient and visible-light driven photocatalysts is therefore an urgent and important issue. Since the discovery in 1972 that TiO2 can be used for electrochemical photolysis of water, efforts have been devoted to finding new photocatalyst materials. A number of photocatalysts active for water splitting have completely different crystal and electronic structures, so it is desirable to reveal the fundamental factors that determine their photocatalytic activity in an attempt to establish useful concepts for development of new photocatalysts. We show that remarkable photocatalytic performance can be induced for metal oxides/nitrides consisting of distorted octahdedral/tetrahedral coordination and of valence and conduction band structures with large dispersion. |
1. Introduction
In view of the current importance of hydrogen as a clean chemical source, the overall splitting of water by the combination of photocatalysts and solar energy has drawn strong attention as one ideal process, and the development of highly efficient and visible-light driven photocatalysts is therefore an urgent and important issue. Since the discovery of TiO2 by Honda–Fujishima1 for the electrochemical photolysis of water splitting in 1972, efforts have been devoted to finding new photocatalyst materials. Fig. 1 shows the types of elements in periodic table whose metal ions have been found to constitute active metal oxides and nitrides for water splitting. There are three kinds of groups in the metal ions: (i) the transition metal ions Ti, Zr, Nb, Ta and W, (ii) the rare earth metal ion Ce, and (iii) the typical metal ions Ga, In, Ge, Sn and Sb. Fig. 2 shows the representative transition metal oxides and typical metal oxides. For the transition metal ions, there are various kinds of titanates [SrTiO3,2 A2Ti6O13 (A = Na, K, Rb),3,4 BaTi4O9,5,6 A2La2Ti3O10 (A = K, Rb, Cs),7,8 Na2Ti3O7,9 K2Ti4O910], zirconium oxide (ZrO211) niobates [A4Nb6O17 (A = K, Rb),12 Sr2Nb2O7,13 Cs2Nb4O11,14 Ba5Nb4O1515], tantalates [ATaO3 (A = Na, K),16,17 MTa2O6 (M = Ca, Sr, Ba),18,19 Sr2Ta2O7,13 ACa2Ta3O10 (A = H, Na, Ca),20 A2SrTa2O7·nH2O (A = H, K, Rb),21 ALn Ta2O7 (A = H, Na, Rb, Cs, Ln = La, Pr, Nd, Sm),22 K3Ta3B2O12,23 Ba5Ta4O1524] and tungstates (PbWO4,25,26 PbxWO427). The core metal ions of these transition metal oxides are Ti4+, Zr4+, Nb5+, Ta5+ and W6+, and it is notable that all the metal ions have d0 electronic configuration in common. For the rare earth metal ions Sr-doped CeO2 was found recently to be photocatalytically active.28 The core metal ion Ce4+ has d0 electronic configuration. For the typical metal ions, there are various kinds of indates [MIn2O4 (M = Ca, Sr),29,30 AInO2 (A = Li, Na),31 LaInO332], gallates [Ga2O3,33 ZnGa2O4,34 MGa2O4 (M = Ca, Sr)], germanate (Zn2GeO4),35 stannates [M2SnO4 (M = Ca, Sr)29], and antimonates [NaSbO3,29,36 MSb2O6 (M = Ca, Sr),36 M2Sb2O7 (M = Ca, Sr)36]. The core metal ions are Ga3+, In3+, Ge4+, Sn4+ and Sb5+, and interestingly, all have d10 electronic configuration. Furthermore, d10 metal nitrides such as β-Ge3N4,37 divalent metal ion-doped GaN38,39 and a solid solution40,41 of GaN with ZnO, were found to be active. Especially, the solid solution is interesting, because of its capability to split water under visible light (<550 nm). The kinds and number of d10 photocatalysts discovered in recent years are almost comparable to those of d0 metal oxides established in the past three decades.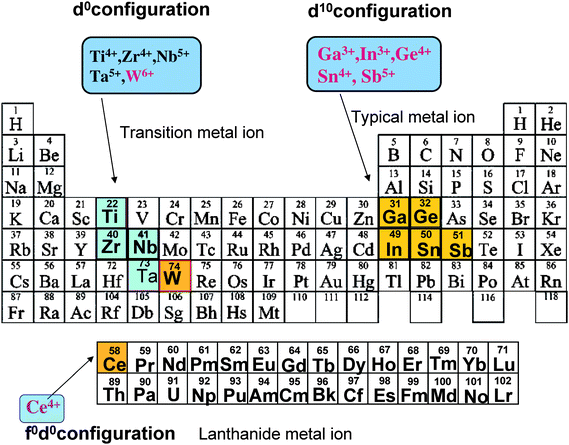 | ||
| Fig. 1 Elements in the Periodic Table and the metal ions used as photocatalysts for overall water splitting. Metal ions, shown in brown, were found in our study to make photocatalysts. | ||
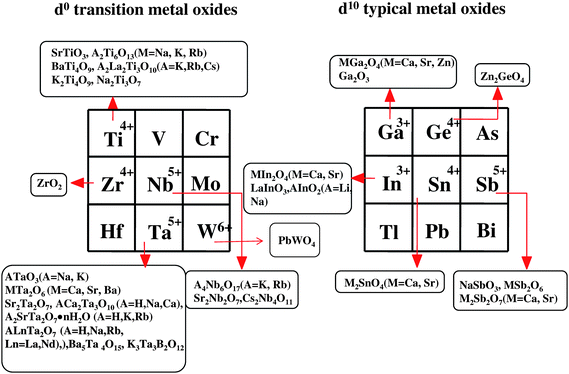 | ||
| Fig. 2 A list of metal oxides with d0 and d10 electronic configuration as photocatalysts for overall water splitting. Almost all of the metal oxides are powder, onto which NiO or RuO2 are loaded as the cocatalyst. | ||
A variety of the photocatalysts active for water splitting have completely different crystal structures and electronic structures. It is strongly desirable to reveal fundamental factors that determine their photocatalysis. In an attempt to establish the concepts useful for the development of photocatalysts, the present review is consolidated based on not only previous results, but also our recent new findings.
2. Concept for the design of efficient photocatalysts
There are three essential steps for water splitting reaction by solid photocatalysts, as shown in Fig. 3: the first is the photoexcitation of electrons from the valence band to the conduction band, the second is the transfer of the electrons and holes to the surface without recombination, and the third is the surface reactions of electrons with H+ and holes with OH−. In most powder photocatalysts, cocatalysts such as RuO2 and NiO are deposited in the form of fine particles on metal oxide surfaces, presented schematically in Fig. 3. The roles of the cocatalyst are to promote the separation of photoexcited charges and to accelerate the third step of surface reactions. The efficiency of the first and second steps is evidently determined by the life of charges generated, and prevention of the recombination of electrons and holes is important. With respect to this, we have taken the following simple concepts into consideration: (i) electric fields, (ii) the symmetry of metal–oxygen octahedral/tetrahedral coordination forming metal oxides, and (iii) the electronic structures of valence and conduction bands. Presented here are the effects of internal bulk electric fields of ferroelectric metal oxides, distorted metal–oxygen octahedral/tetrahedral structures, and atomic orbital hybridization and dispersion of bands on photocatalytic properties.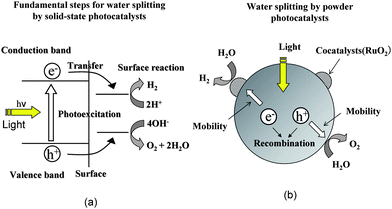 | ||
| Fig. 3 (a) Fundamental steps for water splitting by solid-state photocatalysts and (b) important factors in cocatalyst-loaded powder photocatalysts. | ||
3. Preparation conditions for high photocatalytic performance
There are several experimental factors for determining the performance of powder photocatalysts. The photocatalytic activity depends on preparation methods and is mainly associated with the properties of metal oxides absorbing light energy and the states of cocatalyst loaded on the metal oxides.The case of a RuO2-loaded CaIn2O4 photocatalyst32 is given as an example. The metal oxide was generally synthesized by a solid-state reaction of starting metal compounds at high temperatures. The photocatalytic water splitting reaction was carried out using pure water (distilled and ion-exchanged) in a closed gas circulating apparatus under an Ar gas atmosphere. Fig. 4 shows the photocatalytic activity of RuO2-loaded CaIn2O4 as a function of calcination temperatures upon synthesis of CaIn2O4 from Ca(CO3)2 and In2O3.32 The activity increased considerably with increasing calcination temperatures from 1273 K, reached a maximum at around 1473 K, and decreased sharply above 1500 K. The X-ray diffraction patterns showed that the major diffraction peaks of the (320), (121), and (401) planes of CaIn2O4 became narrower with increasing calcination temperatures. The surface area decreased with increasing temperature. SEM images show that CaIn2O4 particles grew considerably in the 1323–1473 K temperature range, and markedly in the 1523–1573 K range, causing the agglomeration of the particles. Thus, with an increase in calcination temperatures, both crystallization and sintering of CaIn2O4 take place. Similar activity-calcination temperature patterns were observed for other metal oxides such as BaTi4O9,5 ZnGa2O4,34 and Zn2GeO4.35
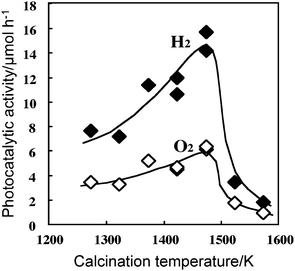 | ||
| Fig. 4 Dependence of photocatalytic activity of 1 wt% RuO2-loaded CaIn2O4 on calcination temperature in the preparation of CaIn2O4. Photocatalyst: powder, photocatalyst amount 0.25 g; water volume, 30 ml; Ar gas pressure, 1.3 kPa; light source, Xe lamp without filter; light intensity, 400 W. Ref. 32. | ||
Crystallization eliminates structural imperfections such as vacancies and dislocation, which frequently make the recombination sites of photoexcited charges. Thus, activity enhancement with increasing calcination temperature is associated with crystallization. Sintering of the crystals causes the extraordinary growth of CaIn2O4 particles and thus a sharp drop in surface area. Significant decreases in the surface area of CaIn2O4 are responsible for activity decreases.
The photocatalytic activity is also a function of the amount and states of cocatalyst. For RuO2 loading, ruthenium compounds such as RuCl3 aqueous solution, Ru3(CO)12 in THF, or Ru(C5H7O2)3 in THF were loaded on CaIn2O4 by impregnation or photodeposition, and then oxidized at 673–773 K to convert the ruthenium species to ruthenium oxide. Without RuO2, little hydrogen was produced, but the loading of RuO2 permitted significant production of both H2 and O2. Production increased markedly in loading range 0.25–1.0 wt%, reached a plateau at around 1–1.5 wt%, and decreased slightly with further loading to 2.0 wt%. The binding energy of the Ru 3d5/2 level in XP spectra taken for loaded RuO2 particles was close to that for standard RuO2 powder, indicating that the active Ru species was Ru4+ in RuO2 particles. Namely, increasing the amounts of RuO2 loaded on CaIn2O4 raised the production of H2 and O2, but excess amounts conversely lowered efficiency, because of the agglomeration and growth of RuO2 particles. Thus, highly dispersed states of RuO2 particles are appropriate for high photocatalytic performance.
Based on these results, high efficiency for photocatalytic water splitting is achieved by the combination of well-crystallized metal oxides with highly dispersed RuO2.
4. d0 metal oxides
One of the most important issues to achieve high efficiency in photocatalysis by solids is to control the behavior of photoexcited electrons and holes. The internal electric fields due to dipole moment in crystals are considered to be useful. Here, the effects of macroscopic electric fields of ferroelectric crystals and the microscopic electric fields generated in distorted metal–oxygen octahedral/tetrahedral coordination of metal oxides are presented.4.1 Effects of polarization fields in semiconducting ferroelectric metal oxides
Ferroelectric crystals have a spontaneous polarization axis. The “poling” procedure of imposing a high dc voltage through the crystal permits the arrangement of the polarization axis to have the same direction, and enables one to obtain a single domain structure. If an outer electric field is vertically applied to the ferroelectric crystal, the surface exposes the positive plane on one side and negative plane on the opposite side, presented schematically in Fig. 5. When the single domain ferroelectric crystal is heated above the Curie temperature and then cooled down without an electric field, the single domain structure changes to randomly oriented structures of polarization axis (multi domain structure). The single domain structure gives rise to an internal field in the ferroelectric crystal. Upon light irradiation for photoexcitation, it is thought that the aligned internal field permits not only the efficient separation of photoexcited charges at a light-absorption center, but also the accumulation of opposite charges on the positive and negative surfaces.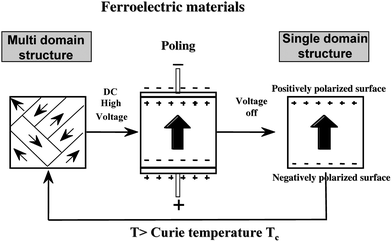 | ||
| Fig. 5 Conversion of multi-domain structure to single domain structure by the application of high dc voltage (poling) to ferroelectric materials, and the reverse process by heat treatment above Curie temperature. Single domain structure exposes (+) and (−) surface on the front and back surfaces, when the polarization axis is vertical to the surface. | ||
Fig. 6 shows the short-circuit photocurrents of Sr-doped Pb(Zr,Ti)O3 (denoted here as PSZT) with a single domain structure.42 UV light irradiation to the negative surface generated a instantaneous photocurrent due to the pyroelectric effect, immediately followed by a steady photocurrent. The photocurrent continued during light-on. With light-off, the photocurrent disappeared after a transient pyroelectric current in the opposite direction. Upon UV irradiation to the positive plane, opposite photocurrent changes occurred. Fig. 7 shows the open-circuit photovoltages. Positive voltages as high as 26 V were observed for irradiation to the negative surface. The irradiation of one plane of a non-polar semiconductor disc by light with energy larger than the band gap generates photovoltages between the front and back planes of the disc by Dember effect (due to the gradient density of photoexcited electrons and holes with different mobility). In the Dember effect, the direction of photocurrent depends on the direction of light irradiation, and the resulting voltages cannot exceed the energy gap of the semiconductor. For PSZT, however, the direction of the photocurrents was determined by the direction of the polarization axis, and photovoltages were larger, by a factor of 8, than the band gap. This is defined as the anomalous photovoltaic effect (APV effect). According to a model proposed for ferroelectric polycrystalline materials, the larger-than-band-gap photovoltages VA, are given by the equation:43
| VA = PsSN0/Es{1 + EbS/(Es(L−2S)} | (1) |
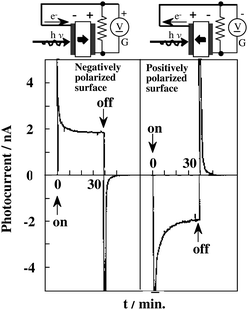 | ||
| Fig. 6 Photocurrents generated to PSZT by UV irradiation to either the (+) or (−) surface. The direction of photocurrent was determined by the direction of polarization axis. Ref. 42. | ||
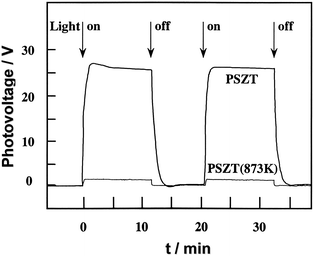 | ||
| Fig. 7 Anomalous photovoltaic (APV) effects of PSZT with single domain and multi-domain structures. PSZT (873 K) shows that PSZT was subjected to heat treatment at a temperature (873 K) above Curie temperature (553 K) and cooling in the absence of electric fields. PSZT (873 K) has a multi-domain structure. Ref. 42. | ||
For water splitting, two device type photocatalysts were prepared using various kinds of ferroelectric materials having the opposite direction of polarization axis, i.e. exposing either positive or negative polar surfaces. One method was the employment of single domain ferroelectrics as a photocatalyst by depositing thin film cocatalyst (Pt) on either the positive or negative surface of the ferroelectrics (denoted here as Pt/(+) ferroelectric material and Pt/(−) ferroelectric material, respectively). The other was the use of positive and negative surfaces as a substrate for thin film photocatalysts: thin films of TiO2 and WO3 photocatalysts were deposited on the ferroelectric substrates through a Pt thin layer (denoted as thin film photocatalyst/Pt/(+) ferroelectric material and thin film photocatalyst/Pt/(−) ferroelectric material, respectively).44
Water splitting was examined on Pt/(+)PSZT and Pt/(−)PSZT, in which 10 nm Pt was deposited on the positive and negative surfaces of PSZT, respectively.45 Upon UV light irradiation, Pt/(+)PSZT produced considerable H2 with a constant rate after an induction period, whereas H2 production was very limited with Pt/(−)PSZT. The activity of the former was 8.5 fold larger than that of the latter. Table 1 shows the results of ferroelectric LiNbO3 and LiTaO3 single crystals with different angles of polarization axis, and multi domain PSZT (heated at 873 K higher than the Curie temperature of 583 K). Pt/(+) LiTaO3 showed higher activity than Pt/(−) LiTaO3, and the difference was larger when the polarization axis was vertical to the surface. Similarly, for a multi domain PSZT that had lost the characteristics of (+) and (−) surfaces, and exposed an equivalent mixture of (+) and (−) surfaces, both surfaces had very small activity. PSZT repolarized to have a single domain structure again showed a 6-fold larger activity for (+) than for (−) surface.
| Ferroelectrics | Activity/µmol h−1 | Activity ratio (+)/(−) | ||
|---|---|---|---|---|
| (+) | (−) | |||
| PSZT |

|
0.17 | 0.02 | 8.5 |
| PSZT (873 K) |

|
0.01 | 0.01 | 1 |
| z-LiTaO3 |

|
0.36 | 0.13 | 2.8 |
| 36y-LiTaO3 |

|
0.28 | 0.14 | 2 |
| z-LiNbO3 |

|
<10−4 | <10−4 | 1 |
| 128y-LiNbO3 |

|
<10−4 | <10−4 | 1 |
| x-LiNbO3 |

|
<10−4 | <10−4 | 1 |
Differences in the photocatalytic activity between (+) and (−) surfaces is due to the direction of polarization axis: the internal polarization fields facilitate the transfer of photoexcited electrons to the positive surface where the reduction of H+ to H takes place readily through the deposited Pt metal surface. In contrast, the transfer of photoexcited electrons to the (−) surface is significantly depressed, which results in negligible H2 production. The (−) surface would preferably produce oxygen, because of the easier access of holes to the surface, but no significant evolution of O2 was observed during the present period of irradiation. There is a possibility that oxygen might be consumed by incorporation into the crystal lattice of PSZT or via the formation of peroxide.
In the use of ferroelectrics as a substrate, thin TiO2 and WO3 films were combined with (+) and (−)PSZT surface through Pt thin layer, which was defined as thin film/Pt/(+)PSZT and /(−)PSZT, respectively. As shown in Fig. 8, H2 was remarkably produced from TiO2/Pt/(+)PSZT, but much less for TiO2/Pt/(−)PSZT.46 Interestingly, the substrate polarization field affects the photocatalytic behavior of TiO2 deposited on it. Fig. 8 shows the results for WO3 thin film photocatalysts. Again, the H2 production was significantly larger for WO3/Pt/(+)PSZT, while no activity was observed for WO3/Pt/(−)PSZT. In oxidation/reduction potential, the conduction band (vacant empty band) of WO3 is lower than that of H+/H level. Thus, it is impossible for WO3 to photocatalytically produce H2 from H2O. However, the fact that WO3/Pt/(+)PSZT brought about steady H2 production but WO3/Pt/(−)PSZT failed indicates that the polarization fields of single domain PSZT as a substrate raise the reduction potential by light irradiation to a extent to which H+/H occurs. Namely, APV effects have the ability of inducing photocatalysis. Fig. 9 shows APV effects on photocatalytic activity. In the case of the single domain ferroelectric substrates, such as single domain PSZT, Mn-doped PZT(MPZT), PZT that have APV effects, H2 production takes place significantly for the (+) surface. On the other hand, H2 production was not observed with substrates having no APV effects such as multi-domain structure PSZT, MPZT, and PZT. Furthermore, substrates of LiNbO3 and quartz, that have no APV effects, exhibited no activity. The APV effects due to polarization fields not only activate thin film photocatalysts on the (+) surface, but also cause differences in the activity between (+) and (−) surfaces. This enabled us to design a photocatalyst differentiating reduction from oxidation sites, as shown in Fig. 10. The highest efficiency of photocatalysis will be obtained if one uses ferroelectric semiconductor materials which have both ferroelectric and semiconducting properties in an appropriate ratio.
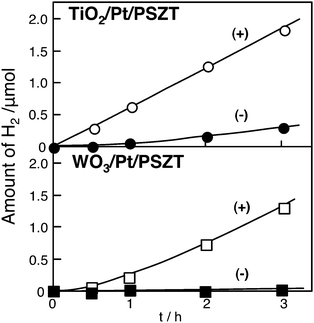 | ||
| Fig. 8 Different production of H2 by UV light irradiation to thin film TiO2 (upper) and WO3 (lower) deposited on (+) PSZT and (−) PSZT. Photocatalyst: disc, 25 mm diameter; water volume, 30 ml; Ar gas pressure, 13.3 kPa; light source, Hg–Xe lamp without filter; light intensity, 200 W. | ||
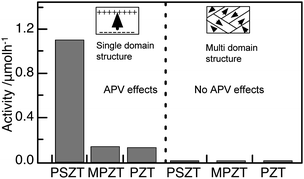 | ||
| Fig. 9 Photocatalytic activity for H2 production from water on thin WO3 films deposited on single domain and multi-domain ferroelectric substrates. PSZT: Sr-doped PZT, MPZT: Mn-doped PZT, PZT: lead zirconium titanate. Reaction conditions are the same as those described in Fig. 8. | ||
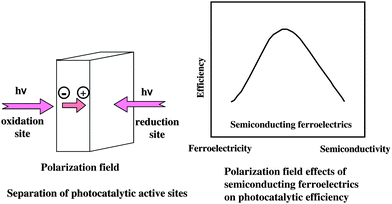 | ||
| Fig. 10 A model of semiconducting ferroelectric photocatalysts having separate reduction and oxidation sites. | ||
4.2 Effects of local electric fields in alkaline metal and alkaline earth metal titanates
As described above, internal polarization fields have positive effects on the acceleration of photocatalysis by controlling the behavior of photoexcited charges. Polarization fields of ferroelectric materials are due to bulk properties through the crystal. If one asks whether or not there are crystal structures that provide local polarization fields which play an important role in photocatalysis, the distorted structures of metal–oxygen octahedron/tetrahedron would be an answer.Among various kinds of alkaline metal and alkaline earth metal titanates available, titanates with tunnel structures are interesting from the viewpoint of local geometric structures and photocatalysis. Representative titanates are BaTi4O9 with a pentagonal prism tunnel structure and A2Ti6O13 (A = Na, K) with rectangular tunnel structures.3–5 In a series of barium titanates, the stable barium titanates are, BaTi4O9 (orthorhombic crystal structure, pentagonal prism tunnel structure), Ba2Ti9O20 (triclinic, hollandite-like tunnel structure), Ba4Ti13O30 (orthorhombic close-packed arrays), and Ba6Ti17O40 (monoclinic close-packed arrays).6 The examination of RuO2-loaded barium titanates showed that only BaTi4O9 was photocatalytically active for water splitting, as shown in Fig. 11. Fig. 12 shows the ESR signal of the barium titanates at 77 K in 4 kPa of He under UV irradiation. BaTi4O9 exhibited a strong signal with g = 2.018 and 2.004, whereas the other three barium titanates failed to show any characteristically strong signals. The BaTi4O9 signal was also obtained in gases, such as Ar, O2, and H247,48 and was assigned to a surface radical, O−, derived from a lattice oxygen O2−. Active A2Ti6O13 (A = Na, K) showed strong ESR signals at g = 2.020, 2.018, and 2.004 due to the O− radical under similar experimental conditions.49Table 2 summarises O− radical formation and photocatalysis for various kinds of titanates having different crystal structures. All titanates able to generate the O− radical are, without exception, photocatalytically active for water splitting.
| Titanates | Structures | Photocatalysis (with RuO2) | O − radical production |
|---|---|---|---|
a
 : active, : active,  : inactive, s: strong, m: medium, w: weak. : inactive, s: strong, m: medium, w: weak.
|
|||
| BaTi4O9 | Pentagonal prism tunnel |
 (s) (s) |
 (s) (s) |
| KTi3TaO9 | Pentagonal prism tunnel |
 (w) (w) |
 (w) (w) |
| Na2Ti6O13 | Rectangular tunnel (3P) |
 (s) (s) |
 (s) (s) |
| K2Ti6O13 | Rectangular tunnel (3P) |
 (s) (s) |
 (s) (s) |
| Rb2Ti6O13 | Rectangular tunnel (3P) |
 (m) (m) |
 (m) (m) |
| Na2BaTi10O22 | Rectangular tunnel (2P–3P) |
 (w) (w) |
 (w) (w) |
| K2SrTi10O22 | Rectangular tunnel (2P–3P) |
 (w) (w) |
 (m) (m) |
| Na2Ti3O7 | Zig-zag layer |
 (m) (m) |
 (s) (s) |
| K2Ti4O9 | Zig-zag layer |
 (w) (w) |
 (s) (s) |
| KTi3NbO9 | Pentagonal prism tunnel |

|

|
| Bi2Ti4O11 | Zig-zag layer |

|

|
| Cs2Ti6O13 | Infinity layer |

|

|
| BaTiO3 | Perovskite |

|

|
| NaLaTiO4 | Perovskite like |

|

|
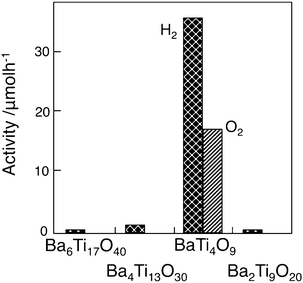 | ||
| Fig. 11 Photocatalytic activity of RuO2-loaded various barium titanates. Photocatalyst: powder, photocatalyst amount, 0.20 g; water volume, 20 ml; Ar gas pressure, 27 kPa; light source, Xe lamp without filter; light intensity, 400 W. Ref. 6. | ||
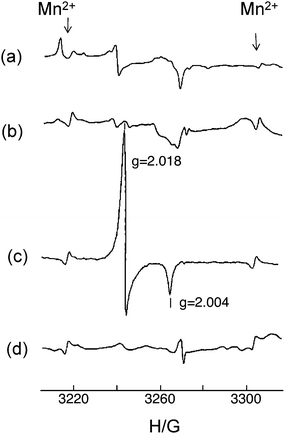 | ||
| Fig. 12 ESR signals for (a) Ba6Ti17O40, (b) Ba4Ti13O30, (c) BaTi4O9, and (d) Ba2Ti9O20 in a He atmosphere at 77 K. Ref. 6. | ||
Both the photocatalytic activity and the concentration of O− in BaTi4O9 varied by heat treatment, such as reduction in temperature 1073–1173 K or reduction followed by oxidation at 1173 K. Fig. 13 shows the correlation of photocatalytic activity on BaTi4O9 and the concentration of O− produced at the surface by UV irradiation. The activity increases almost in proportion to the concentration of O− radical,50 which indicates that the O− radical is associated with photocatalytic active sites. The O− radical appears as a result of photoexcitation, and its strong intensity indicates the efficient ability of BaTi4O9 to generate photoexcited charges.
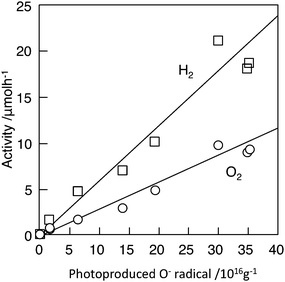 | ||
| Fig. 13 Linear correlation between the concentration of O− produced by UV irradiation on BaTi4O9 and the photocatalytic activity for H2 and O2 production of RuO2-loaded BaTi4O9. Photocatalyst: powder, photocatalyst amount, 0.20 g; water volume, 20 ml; Ar gas pressure, 27 kPa; light source, Xe lamp without filter; light intensity, 400 W. Ref. 50. | ||
Raman spectra showed that BaTi4O9 had an extremely strong peak at high wave number, 860 cm−1. This is due to a double bond-like, Ti–O bond with short distance, indicating that octahedral TiO6 are distorted. The characteristic peak was missing for the other barium titanates: Ba2Ti9O20, Ba4Ti13O30 and Ba6Ti17O40. Fig. 14 shows a pentagonal prism tunnel structure of BaTi4O9 that is composed of two strongly distorted octahedral TiO6, in which Ti4+ ions are displaced by 0.03 and 0.021 nm, respectively, from the center of gravity of the surrounding six oxygen ions.51,52 The out-of-center Ti ions generate a dipole moment of 5.7 and 4.1 D (D = debye).48 The dipole moment causes an internal local polarization field that promotes the formation of photoexcited charges. Thus, the unique photocatalytic properties of BaTi4O9 are associated with the geometric effects of distorted TiO6 with short and long Ti–O bonds. The photocatalytically active Na2Ti6O13 also has distorted octahedral TiO653 with a dipole moment of 6.7, 5.8, and 5.3 D.49 These results indicate that the distorted metal–oxygen octahedron is associated with high photocatalytic performance.
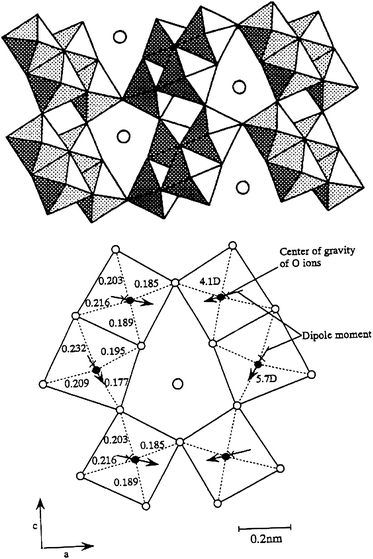 | ||
| Fig. 14 A pentagonal prism tunnel structure of BaTi4O9 and dipole moment inside octahedral TiO6. | ||
4.3 Effects of electronic structures
It is important to clarify the role of electronic structures, in particular band structures, to understand photocatalysis by solids. The electronic structure of BaTi4O9 was calculated by the plane-wave-density function theory (DFT) method performed using the CASTEP program.54 The valence electronic configurations were 5s2 5p6 6s2 for Ba, 3s2 3p6 3d2 4s2 for Ti, and 2s2 2p4 for O atoms. The unit cell size was [BaTi4O9]2, and the number of occupied orbitals was 112. Fig. 15 shows the energy band dispersion diagram and density of state (DOS) for BaTi4O9.55 The band gap was calculated to be 2.84 eV. The density contour maps showed that the valence band was composed of purely the O 2p orbital, whereas the orbitals of the conduction bands exclusively consisted of the Ti 3d orbital. The mixing of Ti 3d with the O 2p orbital was extremely small. Thus, the degree of hybridization in the valence and conduction bands was negligible for BaTi4O9, and the dispersion in k-space was quite small for the BaTi4O9 conduction band. This indicates that mobility of photoexcited electrons is low, suggesting that structure effects of distorted octahedral TiO6 play an important role in photocatalysis.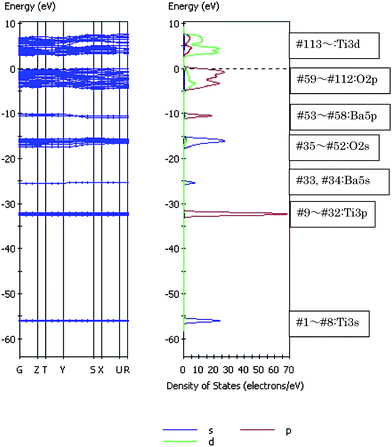 | ||
| Fig. 15 Energy band diagram and density of states (DOS) for BaTi4O9. DOS breaks down into the angular momentum of atomic orbitals (AOs). The contribution of atomic orbitals (AOs) in DOS is illustrated (purple line, s-orbital; red line, p-orbital; green line, d-orbital). | ||
5. d10 metal oxides
If one considers that metal oxides with a vacant d orbital (= d0) are useful for photocatalysis, then we can assume that this will also be the case for metal oxides with a completely occupied d orbital (= d10)—simply because both d0 and d10 configurations behave similarly from a quantum chemistry viewpoint. Accordingly, making this assumption we have found that typical metal oxides with d10 electronic configuration form a group of efficient photocatalysts for overall water splitting when combined with RuO2 as a cocatalyst. The photocatalytic properties of RuO2-loaded typical metal oxides involving In3+, Ga3+, Ge4+, Sn4+, and Sb5+ ions are stated here based on the local geometric structures and band structures.5.1 Effects of geometric structures
CaIn2O4 showed threshold absorption at around 450 nm, slightly higher absorption between 420 and 310 nm, and the largest level at 305 nm.32 SrIn2O4 provided a similar absorption pattern. A photocatalyst of 1 wt% RuO2-dispersed MIn2O4 (M = Ca, Sr) produced H2 and O2 from H2O under Xe lamp illumination. Both the products increased in proportion to irradiation time, and the production was nearly the same in the repeated run, indicative of the stability of RuO2-dispersed MIn2O4 (M = Ca, Sr) photocatalysts. The ratio of H2 to O2 was close to the stoichiometric ratio.
It is of interest to compare the photocatalytic activities of various RuO2-loaded indates such as alkaline metal, alkaline earth metal and lanthanum indates. Under Xe lamp illumination, LiInO2 showed negligible photocatalytic activity, and NaInO2 had a little activity. On the other hand, remarkable activity was observed for MIn2O4 (M = Ca, Sr), in which CaIn2O4 showed higher activity than SrIn2O4. Sr0.93Ba0.07In2O4 exhibited similar activity to that of the latter. LaInO3 produced a small amount of hydrogen only. Thus, activity was larger in the order CaIn2O4 > SrIn2O4, Sr0.93Ba0.07In2O4 ≫ LaInO3 > NaInO2 ≫ LiInO2, as shown in Fig.16. These results illustrate that there are intrinsic differences in photocatalytic properties among the indates, even though they have a common octahedrally coordinated In3+ (d10) metal ion as a core ion.
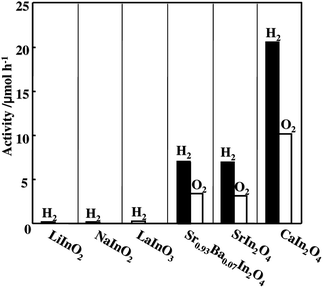 | ||
| Fig. 16 Photocatalytic activity of various alkaline metal and alkaline earth metal indates. Photocatalyst: powder, photocatalyst amount, 0.25 g; Ar gas pressure, 13.3 kPa; light source, Xe lamp without filter; light intensity, 400 W. Ref. 55. | ||
Fig. 17 shows the Raman spectra32 of CaIn2O4, SrIn2O4, Sr0.93Ba0.07In2O4, and NaInO2. The spectrum of CaIn2O4 consisted of five major peaks at 200, 262, 328, 406, and 545 cm−1 in the wave number region 200–600 cm−1. The strongest peak appearing at the highest wave number, 545 cm−1, was assigned to a vibration mode of ν1(A1g). SrIn2O4 showed a similar spectrum in which the peak positions were 191, 236, 321, 395, and 542 cm−1. Sr0.93Ba0.07In2O4 showed a similar Raman pattern to that of SrIn2O4: the major five peaks were observed at 188, 231, 317, 391, and 540 cm−1. On the other hand, NaInO2 showed two peaks at 330 and 504 cm−1.
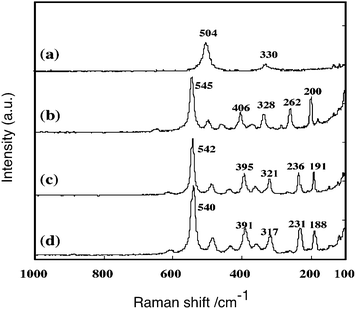 | ||
| Fig. 17 Raman spectra of (a) NaInO2, (b) CaIn2O4, (c) SrIn2O4 and (d) Sr0.93Ba0.07In2O4 measured at room temperature. Ref. 55. | ||
SrIn2O4 has an orthorhombic structure with the lattice parameter of a = 0.9809, b = 1.1449, and c = 0.3265 nm,56 whereas CaIn2O4 has an orthorhombic structure with a unit cell of a = 0.965, b = 1.13 and c = 0.321 nm.57 They have nearly the same crystal structure, although the size of the unit cell is slightly smaller for CaIn2O4. Sr0.93Ba0.07In2O4 has an orthorhombic crystal structure with a lattice parameter of a = 0.9858, b = 1.152, and c = 0.3273 nm.58 It is readily understood that the close similarity in the unit cell among them provided similar Raman patterns, as shown in Fig. 17. LaInO3 consists of an orthorhombic structure with a unit cell of a = 1.1402, b = 1.1796 and c = 0.8198 nm.59 NaInO2 has a hexagonal structure with a unit of a = 0.3232, b = 1.639 nm, α = β = 90°, γ = 120 °nm,60 and has a layer structure. LiInO2 has a tetragonal structure with a unit cell of a = 0.4312 and b = 0.9342 nm.61
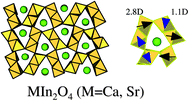
The positive effects of local internal fields due to dipole moment have been demonstrated for transition metal oxides with d0 configuration (cf. 4.2). It is interesting to see a correlation of activity and the distortion of octahedral InO6 for various indates with d10 configuration. Based on the deviation of the position of an In3+ ion from the center of gravity of the six oxygens surrounding the In3+ ion, the dipole moment generated inside the octahedral coordination was calculated. SrIn2O4 has two kinds of the distorted octahedral InO6 with dipole moment of 2.80 D (D = debye) and 1.11 D. For Sr0.93Ba0.07In2O4, the dipole moments were 1.70 and 2.58 D. On the other hand, LiInO2 and NaInO2 are composed of distortion-free normal InO6 without dipole moment. Fig. 18 shows the comparison of photocatalytic activity with dipole moment. The indates consisting of distorted InO6 having dipole moments are photocatalytically active,32 whereas the distortion-free indates exhibited negligible activity. Thus, a correlation between the photocatalytic activity and the distortion of InO6 octahedron is true for d10 metal oxides.
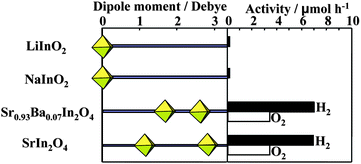 | ||
| Fig. 18 A correlation between photocatalytic activity and dipole moment of octahedral InO6 in AInO2 (A = Li, Na), Sr0.93Ba0.07In2O4, and SrIn2O4. Ref. 55. | ||
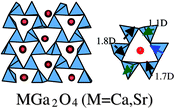
The absorption of light occurred at around 290 nm for M = Mg, 270 nm for M = Sr and 260 nm for M = Ba. The threshold wavelength shifted slightly toward longer wavelength in the order Mg > Sr > Ba, though the wavelength for the maximum absorption was at around 240 nm. Fig. 19 shows schematically the crystal structures of MGa2O4 (M = Mg, Sr, Ba). MgGa2O4 has a cubic crystal structure and is composed of GaO6 octahedron.62 In calculating the center of gravity of the six oxygen ions surrounding the Ga3+ ion, MaGa2O4 has a GaO6 octahedron nearly free from distortion, dipole moment zero. SrGa2O4 has a monoclinic crystal structure, in which GaO4 tetrahedron is the fundamental unit.63 There are three kinds of GaO4 tetrahedral units: one has a dipole moment of 0.80 D, and the other two have 1.2 D. BaGa2O4 has a hexagonal crystal structure consisting of GaO4 tetrahedron whose dipole moments are 1.70, 1.11 and 2.58 D.64 Both SrGa2O4 and BaGa2O4 have pentagonal prism-like tunnels in the tridymite-type structures.65Fig. 20 shows a comparison between the photocatalytic activity and dipole moment. It is notable that the distorted MGa2O4 (M = Sr, Ba) with dipole moments are photocatalytically active, whereas distortion-free MgGa2O4 exhibits negligible activity.
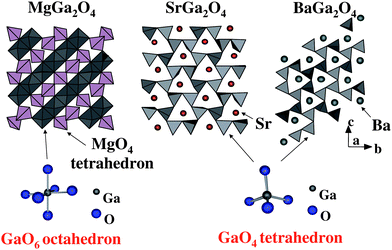 | ||
| Fig. 19 Schematic representation of crystal structures of MGa2O4 (M = Mg, Sr, Ba) and the geometry of involved octahedral GaO6 and tetrahedral GaO4. | ||
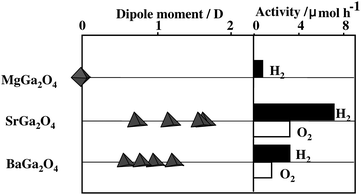 | ||
| Fig. 20 A correlation between photocatalytic activity and dipole moment of octahedral GaO6 and tetrahedral GaO4 in MGa2O4 (M = Mg, Sr, Ba). Photocatalyst: powder, photocatalyst amount 0.25 g; Ar gas pressure, 13.3 kPa; light source, Hg–Xe lamp without filter; light intensity, 200 W. | ||
Table 3 shows active d10 and d0 metal oxides having pentagonal prism-like tunnel structures.66 As described above, BaTi4O9 is a representative metal oxide with d0 configuration, which has distorted octahedral TiO6 with dipole moment. SrIn2O4 with d10 configuration has distorted octahedral InO6 with dipole moment. MGa2O4 (M = Sr, Ba) with d10 configuration have distorted GaO4 tetrahdera with dipole moment. These results indicate the important role of distorted octahedral and tetrahedral coordination for both d10 and d0 configurations in photocatalysis for water splitting. Several explanations can be offered for the reason why distorted units with dipole moments are effective in photocatalysis. There is the possibility that short or long metal–oxygen bonds affect photoexcitation and that the poor symmetry of octahedral and tetrahedral coordination tends to form isolated orbitals, giving rise to different photoexcitation efficiency. Another is the contribution of local internal fields due to the dipole moment inside the distorted units: the fields are considered useful for electron–hole separation upon photoexcitation.
| Configuration | XO6 octahedron | XO4 tetrahedron |
|---|---|---|
| d0 |

|
|
| d10 |
|
|
In a 1 wt% RuO2-dispersed ZnGa2O4 photocatalyst,34 the amounts of H2 and O2 produced from H2O increased in proportion to irradiation time from a Hg–Xe lamp. The repeat run showed nearly the same production, and the H2/O2 ratio approached the stoichiometric value of 2.0. In ZnGa2O4, Ga3+ ions have octahedral coordination, whereas Zn2+ ions are coordinated tetrahedrally.67 ZnGa2O4 consists of distortion-free normal GaO6 octahedron. Thus, the high photocatalyst performance, completely different from MgGa2O4, is somewhat puzzling. Light absorption by ZnGa2O4 occurred at around 300 nm, increased steeply at around 280 nm and reached a maximum level at 250 nm. It is interesting to see that a shift to longer wavelength by about 50 nm occurred with ZnGa2O4, compared to those of MGa2O4 (M = Mg, Sr, Ba). The shift suggests the strong contribution of Zn2+, different from the alkaline earth metal ions, to the electronic structures. Thus, the activity is strongly due to characteristic electronic structures, which will be discussed in detail later (cf. 5.2.2.).
A willemite structure of Zn2GeO4 consists of tetrahedral GeO4 and ZnO4. As shown in Fig. 21, one GeO4 tetrahedron and two kinds of tetrahedral ZnO4 are combined with each other through the edge oxygen.66 The two tetrahedral ZnO4 are heavily distorted to have dipole moments of 1.1 and 1.2 D. Replacing a Ge ion by a Si ion provides Zn2SiO4 with nearly the same structure as Zn2GeO4: the rhombohedral cell of Zn2GeO468 has a = 0.8836 nm and α = 107.42° and that of Zn2SiO4 has a = 0.8626 nm and α = 107.52°. Thus, Zn2SiO4 has two kinds of distorted tetrahedral ZnO4 with dipole moment of 1.1 D and 1.4 D. However, RuO2-loaded Zn2SiO4 was photocatalytically inactive for water splitting, indicating that only the tetrahedral GeO4 unit constituted the photocatalytic active site. This demonstrates that distorted tetrahedral XO4 (X = metal ion) is associated with the formation of photocatalytically active sites.32
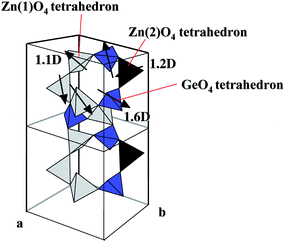 | ||
| Fig. 21 A schematic representation of local crystal structure of Zn2GeO4. | ||
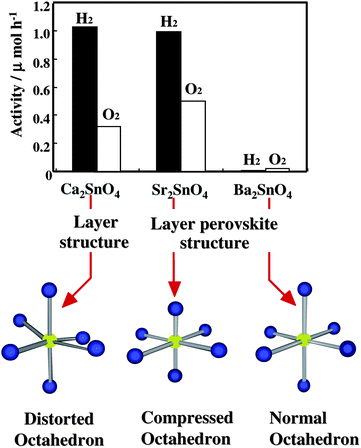 | ||
| Fig. 22 Photocatalytic activity of 1 wt% RuO2-loaded M2SnO4 (M = Ca, Sr, Ba) and the geometry of the octahedral SnO6 involved. Photocatalyst: powder, photocatalyst amount, 1.0 g; water volume, 700 ml; Ar gas pressure, 4.0 kPa; light source, Hg lamp without filter; light intensity, 450 W. | ||
As shown in Fig. 23, Ca2SnO4 has a layer structure in which the SnO6 octahedron are connected to each other by edges, forming columns along c-axis.69 On the other hand, Sr2SnO4 and Ba2SnO4 have a perovskite layer structure in which SnO6octahedron are connected by corner atoms, forming layer structures.70,71 The Sr or Ba ions are located between two-dimensional SnO6 layers. The crystal structures are different between Ca2SnO4 and M2SnO4 (M = Sr, Ba) and similar between Sr2SnO4 and Ba2SnO4. The findings that the photocatalytic activity was similarly large for both Ca2SnO4 and Sr2SnO4 but small for Ba2SnO4 indicate that the photocatalytic activity is independent of differences in the layer structures. The octahedral SnO6 in Ca2SnO4 is composed of four Sn–O bonds of 214.63 pm and two Sn–O bonds of 201.00 pm. The bond angles of ∠O–Sn–O deviate from 90°, and hence the octahedral SnO6 has a distorted form (Fig. 22). The bond length for octahedral SnO6 in Sr2SnO4 is 201.85 pm for four Sn–O bonds and 191.71 pm for two bonds. All bond angles of ∠O–Sn–O are 90°, indicating that the octahedral SnO6 has a compressed form (Fig. 22). On the other hand, Ba2SnO4 has similar bond lengths of 207.06 pm for four Sn–O bonds and 206.96 pm for two Sn–O bonds. All bond angles are close to 90°, which shows that the octahedral SnO6 is nearly normal. Thus, both photocatalytically active Ca2SnO4 and Sr2SnO4 are composed of distorted SnO6 unit, whereas inactive Ba2SnO4 has nearly distortion-free SnO6 unit. These results also indicate that the octahedral SnO6 of active Ca2SnO4 and Sr2SnO4 involve shorter bond length, whereas that of photocatalytically poor Ba2SnO4 is composed of longer Sn–O bond. The activity differences among them are due to geometric effects of the octahedral SnO6 that are distorted by the presence of short Sn–O bonds. Thus, in the alkaline earth metal stannates, it is confirmed that deformed octahedral SnO6 play an important role in photocatalysis.
 | ||
| Fig. 23 Layer structure of Ca2SnO4 and perovskite layer structures of Sr2SnO4 and Ba2SnO4. | ||
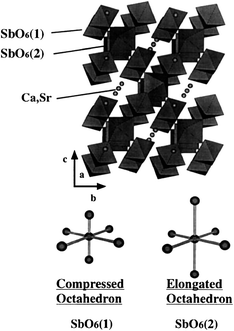 | ||
| Fig. 24 A schematic representation of weberite structure of M2Sb2O7 (M = Ca, Sr) and two kinds of octahedral SbO6. | ||
All of 1 wt% RuO2-loaded M2Sb2O7 (M = Ca, Sr), CaSb2O6 and NaSbO3, had the ability to split water under Hg–Xe lamp irradiation.36 M2Sb2O7 has two kinds of SbO6 in a weberite structure. As shown in Fig. 24, one type SbO6 is surrounded by four octahedral SbO6, and the other type SbO6 is connected to six octahedral units.72 The former is a compressed octahedron formed by two shorter Sb–O bonds and four bonds with the same bond length, whereas the latter is an elongated octahedron with two longer Sb–O bonds. NaSbO3 of ilmenite contains alternating layers of edge-sharing octahedral SbO6,73 which are distorted in such a way that the Sb ion has the out-of-center position. CaSb2O6 consists of infinite sheets of edge-sharing octahedral SbO6 alternating with layers of Ca ion.74 The octahedron is distorted by stretch in the one plane and contraction in the other direction. Photocatalytically active antimonates are composed of deformed octahedral SbO6.
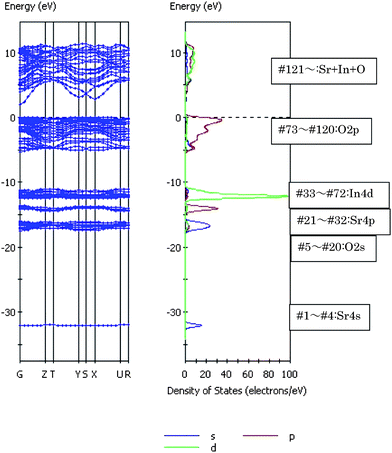 | ||
| Fig. 25 Energy band diagram and density of states (DOS) for SrIn2O4. DOS breaks down into the angular momentum of atomic orbitals (AOs). The contribution of atomic orbitals (AOs) in DOS is illustrated (purple line, s-orbital; red line, p-orbital; green line, d-orbital). | ||
5.2 Effects of electronic structures
The photocatalytic activity is closely associated with the behavior of photoexcited electrons and holes that is determined by the band level and dispersion. To understand the band structures, the energy band dispersion diagram and the density of state (DOS) were calculated by the DFT method.54 The core electrons were replaced by the ultra-soft core potentials.Fig. 25 shows the energy band dispersion diagram and the density of state (DOS) for SrIn2O4.55 The Sr4s orbital appeared at the deepest level, followed by the O2s, Sr4p, and In4d orbitals with increasing energy. There were no bonding interactions between Sr4p–O2p and In4d–O2p orbitals. The lowest part of the valence band (#73) was formed by the O2p orbital mixed slightly with the In 5s5p orbitals. Fig. 26 and 27 show the density contour maps of the HOMO and LUMO levels, respectively. The highest energy orbital (#120) showed the p orbital lobes on the O atom, which indicated that the highest orbital (HOMO) in the valence band was purely composed of the O2p orbital. On the other hand, the bottom of conduction band (LUMO) was formed by the hybridized In5s and 5p orbitals, with a small contribution from the O2p orbital. In view of large overlap between the In5s and 5p orbitals, the LUMO had very large dispersion, and hence the photoexcited electrons had large mobility, which evidently induced high photocatalytic performance. The Sr5s and Sr4d orbitals were mixed to the In5s5p orbitals at a higher energy of the conduction band. Excitation of electrons upon illumination occurred from the O2p to the In5s5p orbitals (the band gap was calculated to be 2.09 eV).
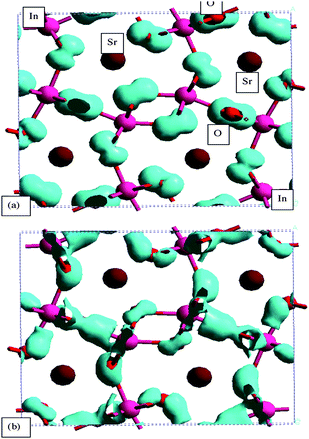 | ||
| Fig. 26 Density contour maps of orbitals at the top and bottom of the valence band for SrIn2O4. (a) The highest energy (HOMO) level (#120) and (b) the lowest energy level(#73) of the valence band. | ||
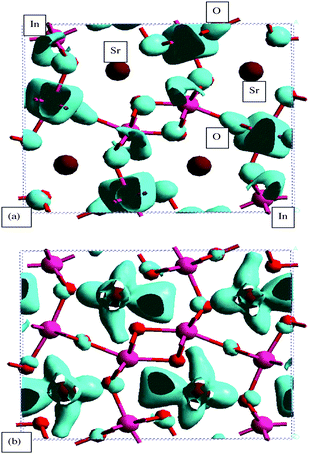 | ||
| Fig. 27 Density contour maps of orbitals at the lower part of the conduction band for SrIn2O4. (a) The lowest energy (LUMO) level (#121) and (b) slightly higher level (#129) of the conduction band. | ||
The energy-band diagram and the density of states (DOS) for LiInO2 and NaInO2 were similar.31 The O2s and In4d orbitals were located at deep core levels for both LiInO2 and NaInO2. The valence bands were essentially composed of the O2p orbital in both cases, and the lower part of conduction bands consisted of In5s5p hybridized orbitals (there was an interesting difference in the calculated band gaps: LiInO2 had the normal band gap of 2.03eV, whereas NaInO2 the extremely small band gap of 0.51 eV. The small band gap for the latter is associated with In–In interactions by the large overlap of the In atom orbitals). The atomic orbitals forming the valence and conduction bands were similar between SrIn2O4 and AInO2 (A = Li, Na). However, there were differences in the degrees of mixing with In atom orbitals at conduction bands between Sr and Li (or Na) atom orbitals. The energy difference between the top of valence band and Sr5s orbital was 5.5 eV, whereas differences between the top of valence and Li2s and Na3s orbitals were 7.2 and 10.0, respectively. Thus, there was a considerably large overlap of Sr5s orbital with In5s5p orbitals, compared to the Li2s and Na3s orbitals.55
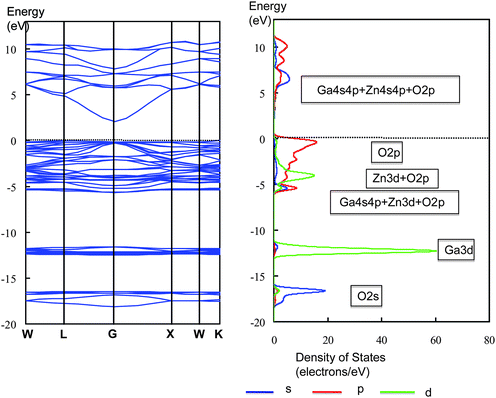 | ||
| Fig. 28 Energy band diagram and DOS for ZnGa2O4. Purple line, s-orbital; red line, p-orbital; green line, d-orbital. | ||
MgGa2O4 showed that the valence band was composed of O2p orbital, and the conduction band consisted of Ga4s4p orbitals. No contributions of atomic orbitals of Mg atom to the valence and conduction bands were observed. The band gap was calculated to be 2.56 eV. Fig. 29 shows the band structure and DOS for SrGa2O4. DOS breaks down into the angular momentum of atomic orbitals (AOs) represented by different line shapes. The Sr4s, O2s, Sr4p and Ga3d orbitals in the core level appeared with increasing energy. The valence band was mainly composed of the O2p orbital, and the conduction band was formed by the hybridized Ga4s4p orbitals mixed with O2p orbital. The upper part of the conduction band involved the contribution of the Sr4d orbital. The band gap was 2.97 eV.
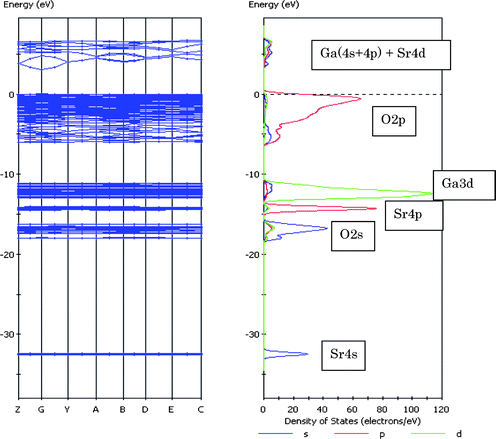 | ||
| Fig. 29 Energy band diagram and DOS for SrGa2O4. The contribution of atomic orbitals (AOs) in DOS is shown: purple line, s-orbital; red line, p-orbital; green line, d-orbital. | ||
When light absorption properties were compared between ZnGa2O4 and SrGa2O4, the former showed longer absorption wavelength by 20 nm than SrGa2O4. Sampath et al. showed that the hybridization of Zn3d with the O2p orbital caused the upward shifts of the valence band maximum.75 For the II–VI semiconductors, Wei and Zunger pointed out that the p–d repulsion repelled the valence band maximum upwards without affecting the conduction minimum.76 Thus, the narrower band gap for ZnGa2O4 than for SrGa2O4 is due to this p–d repulsion. Furthermore, since the bottom of the conduction band for ZnGa2O4 was composed of Ga4s4p + Zn4sp hybridized orbitals, there is a possibility that strong mixing of Zn and Ga orbitals in the conduction band induces not only large dispersion but also band gap narrowing.
The electron transfer upon illumination occurs from the O2p orbital to the hybridized Ga4s4p + Zn4s4p orbitals. The large dispersion of LUMO is able to yield excited electrons with large mobility in the conduction band. This is responsible for high photocatalytic performance. Note that this is due to the strong Zn–O and Zn–Ga interactions, as observed in Zn3d–O2p orbital repulsion in the valence band and in hybridization of Ga4s4p with Zn4s4p in the conduction band. For SrGa2O4, on the other hand, these interactions were missing.
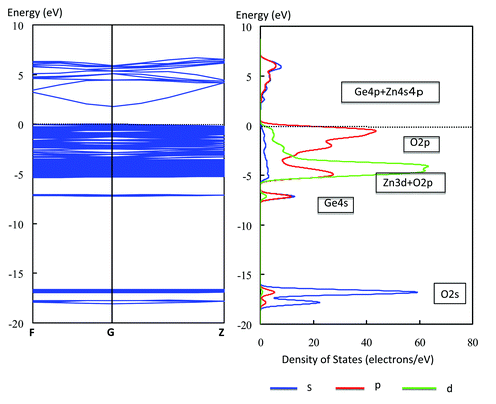 | ||
| Fig. 30 Energy band diagram and DOS for Zn2GeO4. The contribution of atomic orbitals (AOs) in DOS is shown: purple line, s-orbital; red line, p-orbital; green line, d-orbital. | ||
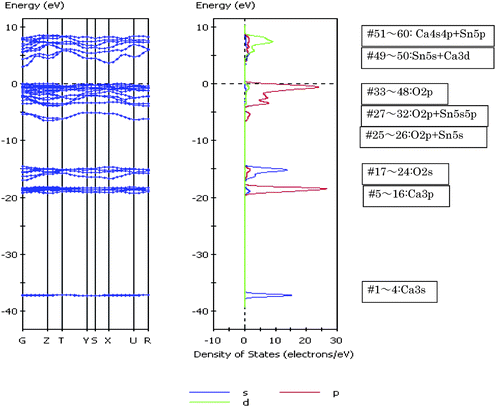 | ||
| Fig. 31 Energy band diagram and DOS for Ca2SnO4. The contribution of atomic orbitals (AOs) in DOS is shown: purple line, s-orbital; red line, p-orbital; green line, d-orbital. | ||
Sr2SnO4 showed an electronic structure similar to that of Ca2SnO4. The Sn5p orbital was hybridized with the O2p orbital in the lower part of the valence band, and the small mixing of the Sn5s orbital occurred at the upper part of valence band. The bottom of the conduction band was composed of the Sn5s orbital, and the contribution of the Sr4d orbital became larger in the upper part. The Sn5s and Sn5p orbitals overlapped much more energetically than those in Ca2SnO4. The band gap was estimated to be 2.96 eV. For Ba2SnO4, although the Sn5p was hybridized with the O2p orbital in the lower part of the valence band, the contribution was weaker, compared to that of Sr2SnO4 and Ca2SnO4. At the top of the valence band, the split-off state from the Sn5s orbital was also recognized. The bottom of conduction band was composed of the Sn5s orbital. The contribution of the Ba5d orbital was observed at a slightly higher energy region and that of the Sn5p orbital at a much higher energy region. The band gap was calculated to be 2.73 eV.
DOS for M2SnO4 (M = Ca, Sr, Ba) showed that the energy level of the p orbitals became higher in the order of Ca3p < Sr4p < Ba5p in relation to the size of p orbitals. In both the occupied and unoccupied bands, the mixing of Sn5s and Sn5p orbital was small for M = Ca, whereas it was larger for M = Sr and M = Ba. The Sn5p orbital was hybridized with the O2p orbital in the lower part of valence band, the energy of mixing range was relatively higher for M = Ca, and lower for M = Sr and M = Ba. Mixing magnitude in this range was large in the order of Ca > Sr > Ba. For the three stannates, the upper part of valence band was solely composed of the O2p orbital, but the split-off state of the Sn5s orbital contributed to the HOMO level, which evidently raised the top of valence band and reduced the band gap. In the conduction band, LUMO level was composed of Sn5s orbital for all three stannates. Hybridization with the Sn5p orbital and alkaline earth metal d orbital was different among the stannates. For M = Sr and M = Ba, the hybridization occurred over a whole energy range except for LUMO, but for M = Ca, it occurred at a higher energy range. The dispersion of conduction band was large for the three stannates, and there was a trend to became larger in the order of Ca < Sr < Ba.
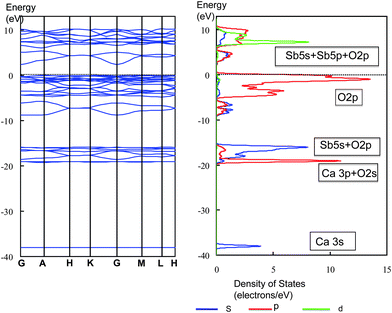 | ||
| Fig. 32 Energy band diagram and DOS for CaSb2O6. The contribution of atomic orbitals (AOs) in DOS is shown: purple line, s-orbital; red line, p-orbital; green line, d-orbital. | ||
Fig. 33 summarizes the characteristic electronic structures of d0 transition and d10 typical metal oxides. The d orbitals in the conduction band of transition metal oxides are stabilized into core level with increasing atomic number, because of increasing nucleus fields, and instead the sp band forms the conduction band in d10 typical metal oxides. Large dispersion of conduction band in d10 electronic configuration due to the broad sp orbitals is the most important advantage for photocatalysis, because it generates high mobility photoexcited electrons.
6. d10 metal nitrides
In aiming to develop visible light-driven photocatalysts, transition metal nitrides and oxynitrides have been used. Their valence bands are composed of N2p orbital with higher energy levels than O2p orbital. Thus, the band gaps are narrower when the conduction band levels remain unchanged. The d0 transition metal nitrides such as Ta3N5,77 and oxynitrides such as TaON,78 MTaO2N (M = Ca, Sr, Ba),79 and LaTiO2N,80 were employed, but little photocatalytic activity was observed for overall water splitting, although either H2 or O2 was produced in the presence of the sacrificial agents. Since d10 typical metal oxides have the advantage of forming large band dispersion at the conduction band to yield highly mobile photoexcited electrons, the employment of d10 typical metal nitrides to overall water splitting is an interesting idea. The DFT band calculation for β-Ge3N4 showed that the top of the valence bands consisted of the N2p orbital, whereas the bottom of the conduction bands was composed of Ge4s4p with large dispersion. A photocatalyst of 1 wt% RuO2 loaded β-Ge3N437 was capable of splitting H2O to H2 and O2. The activity gradually decreased in repeat runs, but became stable after prolonged reaction. The total amount of H2 produced over 24 h was approximately ten times larger than the amount of β-Ge3N4 used in the experiment. The production ratio of H2 to O2 was 2, indicative of the stoichiometric production. These results show that RuO2-dispersed β-Ge3N4 acts as a photocatalyst, representing the first successful example of a non-oxide photocatalyst for overall water splitting.GaN itself was not active, but by doping divalent ions to GaN converted it to become active. For example, Mg2+-doped GaN showed high activity for the H2 and O2 production in the presence of RuO2 as a cocatalyst.38,39 The activity was induced by the doping of divalent ions, but not by doping tetravalent ions. The undoped GaN provided emission at 373 nm, which was close to the band gap, whereas Zn2+-doped GaN showed a broad band gap and strong emission at around 450 nm, assigned to electron transfer from free electron to the acceptor levels above the valence bands. This is indicative of p-type GaN formation by doping. Since the conduction band of GaN consisting of Ga4s4p has large dispersion enough to generate high mobility electrons, the improvement of behavior of holes by p-type GaN is considered to induce the photocatalytic ability.
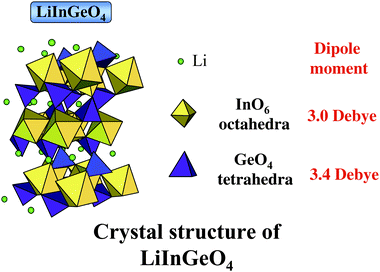 | ||
| Fig. 34 A schematic representation of the crystal structure of LiInGeO4 and dipole moment of octahedral InO6 and tetrahedral GeO4. | ||
Recently interesting results have been obtained with GaN. GaN forms a solid solution with ZnO such as (Ga1 − xZnx)(N1 − xOx). Although each GaN and ZnO had band gaps of ca. 3.0 eV, the band gap became narrower with increasing x, up to 2.4–2.8 eV. When combined with RuO2 as a cocatalyst, (Ga1 − xZnx)(N1 − xOx) exhibited remarkably high photocatalytic activity, producing H2 and O2 in stoichiometric ratio.40,41 The activity increased with increasing amount of RuO2 and was highest at 5 wt% RuO2 loading. The dependence of activity on wavelength of light showed that the photocatalyst was able to produce H2 and O2 even under visible-light, 400–500 nm.40,41
7. Configuration mixed metal oxides
7.1 d10–d10 metal oxides
The employment of composite metal oxides with two kinds of the p-block metal ions with d10–d10 electronic configuration would be interesting for the development of efficient photocatalysts, since the resultant geometric and electronic structures are heavily changed. For the local structures, the presence of two different metal ions in the unit cell leads to geometric effects that cause large distortion in the tetrahedral and octahedral coordination of the metal oxides. For electronic structures, the hybridization of the sp-orbitals of two d10 metal ions may occur so have a significant effect on the density of states and energy dispersion in the conduction bands.When the photocatalytic activity of d10–d10 metal oxide of AInGeO4 (A = Li, Na) was compared with that of its d10 metal oxide, such as AInO2 (A = Li, Na) and NaGeO3, LiInGeO4 had a remarkably larger activity than that of LiInO2.81 Similarly, the activity of NaInGeO4 was approximately 4-fold higher than that of NaInO2. These results indicate that composite metal oxides with d10–d10 configuration have significantly larger activity than the corresponding metal oxides with d10 configuration. Fig. 34 shows the crystal structure of LiInGeO4 which is formed by connection of the octahedral InO6 and tetrahedral GeO4 through corner oxygen atoms.82 InO6octahedron are so heavily distorted that the InO6 unit has a dipole moment of 3.0 D. The GeO4 tetrahedron is also distorted, and has a dipole moment of 3.4 D. The dipole moment of InO6 of LiInGeO4 is slightly larger than that of SrIn2O4 and Sr0.93Ba0.07In2O4. Thus, the correlation between activity and dipole moment is clearly observed in LiInGeO4 involving two d10 metal ions.
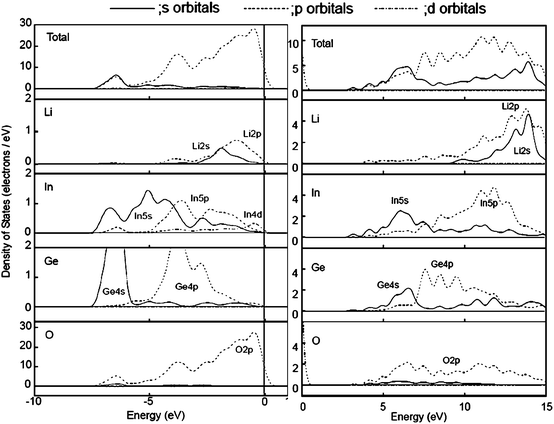 | ||
| Fig. 35 Total and atomic orbital projected DOS for Li, In, Ge and O atom in the occupied bands from 0 to −10 eV (left) and the unoccupied bands from 0 to 15 eV (right). Ref. 81. | ||
Fig. 35 shows the total density of states and atomic orbital projected density of states (AO PDOS) for Li, In, Ge, and O atoms for higher energy region (−10 to 0 eV) of the occupied bands and for the lower energy region (0–15 eV) of unoccupied bands.81 For the occupied bands, the O2p orbital existed over the region, divided into three parts with energy: the lower part was composed of the hybridized Ge4s + In5s orbitals; the middle part was the hybridized Ge4p + In5p orbitals; and, the upper part was the valence band that consisted of the O2p orbital, slightly mixed with Li2s2p orbitals. The HOMO level was formed by the O2p orbital only. For the unoccupied bands, the conduction band was mainly composed of Ge4s, In5s, and O2p orbitals and, with increasing energy the Ge4p, In5p, Li2s and Li2p orbitals contributed strongly in that order. In the contour map for the LUMO level, the polarized effects of the In5p and Ge4p indicated that LUMO was formed by Ge4s and In5s orbitals, slightly mixed with Ge4p, In5p and O2p orbitals. The conduction band showed very large band dispersion. Upon light irradiation, electron transfer occurs from the O2p orbital to the hybridized In 5s5p + Ge4s4p + O2p orbitals.
In a comparison with LiInO2 (cf. 5.2.1), there is a similarity between LiInGeO4 and LiInO2 with contribution from the In5s5p, O2p and Li2s2p orbitals to the unoccupied bands. However, a clear difference is that the Li2s2p orbitals of LiInGeO4 appears only at higher energy level of the unoccupied bands, and instead, Ge4s4p orbitals contribute to the conduction band. Thus, LUMO covers an energy range of ca 4 eV and causes large overlap leading to a large band dispersion. This is an advantage of d10–d10 configuration to the design of efficient photocatalysts.
7.2 d10s2–d0 metal oxides
Metal ions of Pb4+ and Bi5+ have d10 configuration, but no metal oxides involving these metal ions as a core ion have been found as photocatalysts for water splitting. This is partly because of the instability of Pb4+ and Bi5+ metal ions which are readily reduced to Pb2+ and Bi3+, respectively. However, since d10s2 electronic configurations of Pb2+ and Bi3+ have closed shell characteristics, it is interesting to employ d10s2 configuration metal oxides together with those of d0 (or d10) configuration.Various types of tungstates such as Na2W4O13, Bi2W2O9, and Bi2WO6 showed H2 production from H2O/CH3OH and O2 from AgNO3 aq. solution,83,84 indicating that H2 or O2 production is possible in the presence of the sacrificial agents, but no tungsten oxides were reported to be active for overall water splitting. Recently, however, PbWO4 was found to be promising.25 This compound is a good example of d10s2(Pb2+)–d0 (W6+) configuration.
In water splitting on 1.0 wt% RuO2-dispered PbWO4 under Hg–Xe lamp irradiation,26 the production of both H2 and O2 occurred starting at the onset of the reaction and proceeded photocatalytically with H2/O2 ratio of 2.1. On the other hand, for 1.0 wt% RuO2-dispered CaWO4, only a small amount of H2 was produced without O2 production. PbWO4 has a scheelite-type structure with a lattice parameter of a = 0.5456 and c = 1.2020 nm, and α = β = γ = 90°85 and is formed by a network of WO4 tetrahedron. CaWO4 has a structure similar to that of PbWO4: it has also a scheelite-type structure formed by a network of WO4 tetrahedron, and a lattice parameter of a = 0.5230 and c = 1.1384 nm, and α = β = γ = 90°.86 In spite of a close similarity in the crystal structures, PbWO4 was active, but CaWO4 was inactive, which indicates that the role of Pb2+ in electronic structures is important.
Fig. 36 shows the energy band structure and DOS for PbWO4 and CaWO4. There was a clear difference in the dispersion of valence and conduction bands.26 For PbWO4, the dispersion was large at the top of the valence band and at the bottom of the conduction band. On the other hand, the dispersion for CaWO4 was very small in both the valence and conduction bands. Fig. 37 shows AO PDOS for Pb, W and O atoms in the higher energy region (−8 to 0 eV) of occupied bands and the lower energy region (0 to 8 eV) of unoccupied bands for both PbWO4 and CaWO4. The O2p orbital mainly formed the valence band of PbWO4, and there is a considerable mixing with the W5d orbital in the lower part of the O2p orbital. The Pb6s6p orbitals contributed over the entire energy region. At the top of the valence, the Pb6s orbital was largely hybridized with the O2p orbital. The bottom of the conduction band was composed of the W5d orbital hybridized with O2p and Pb6p orbitals. The narrow band gap for PbWO4 was due to the hybridization of O2p with Pb6s orbital, causing a split-off state. These results indicate that the mixing of Pb6s with the O2p orbital contributes to the significant dispersion of the valence band of PbWO4. For CaWO4, however, the valence band was mainly composed of O2p, although the W5d orbital was mixed with the O2p orbital in the lower energy level. The bottom of the conduction band was composed of W5d and O2p orbitals. No contribution from Ca ion was observed in either the valence or conduction bands. This explains the small dispersion for both valence and conduction bands. Photoexcitation in PbWO4 takes place by electron transfer from the HOMO level consisting of O2p + Pb6s orbitals to the LUMO level of W5d + Pb6p orbitals. The high capability of PbWO4 for overall water splitting is associated with large dispersions in both the valence and conduction bands, which leads to the generation of photoexcited electrons and holes with high mobility.
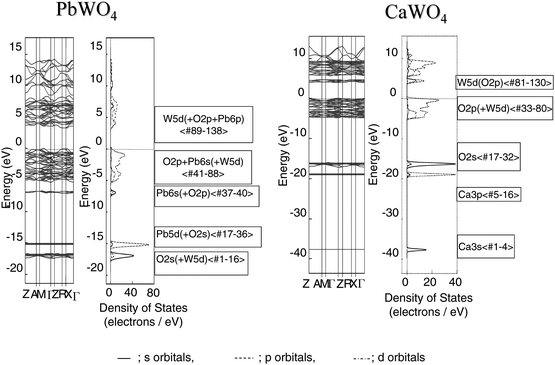 | ||
| Fig. 36 Band dispersion and DOS for PbWO4 and CaWO4. Ref. 26. | ||
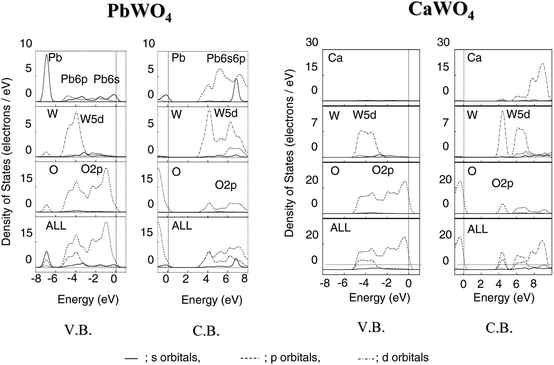 | ||
| Fig. 37 Total and atomic orbital projected DOS for Pb, W, and O atom of PbWO4 and CaWO4. Ref. 26. | ||
7.3 d10s2–d10 metal oxides
Mixing of d10s2 and d10 configuration is interesting from a viewpoint of effects on valence and conduction bands. PbSb2O6 is a typical example with that configuration. As shown in Fig. 38, photocatalysts of RuO2-dispersed NaSbO3, CaSb2O6 and PbSb2O6, the photocatalytic activity is remarkably larger for PbSb2O6 than for the rest under Xe lamp irradiation. Fig. 39 shows the energy band diagram and DOS for PbSb2O6. The top of the valence band consists of the O2p orbital hybridized with the Pb6s orbital. Because of the contribution from the Pb6s orbital, the valence band shows a large dispersion. This is different from CaSb2O6 in which the top of the valence band consists of the O2p orbital only and has extremely small dispersion. The bottom of the conduction band for PbSb2O6 is made up of Sb5s5p orbitals hybridized with Pb6p orbital and has large dispersion. Thus, large band dispersion was induced for both the valence and conduction band by the contribution of the Pb6s orbital. This was able to generate high mobility electrons and holes and is responsible for the high photocatalytic activity.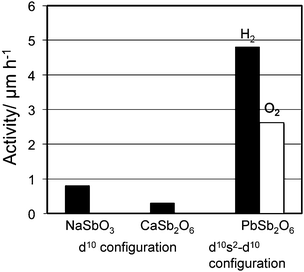 | ||
| Fig. 38 Photocatalytic activity of 1 wt% RuO2-loaded NaSbO3, CaSb2O6 and PbSb2O6. Photocatalyst: powder, photocatalyst amount, 0.25 g; Ar gas pressure, 13.3 kPa; light source, Xe lamp without filter; light intensity, 400 W. | ||
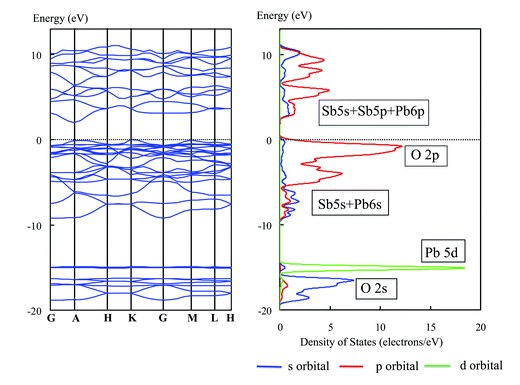 | ||
| Fig. 39 Energy band diagram and DOS for PbSb2O6. The contribution of atomic orbitals (AOs) is shown: purple line, s-orbital; red line, p-orbital; green line, d-orbital. | ||
The employment of d10s2 configuration to d0 and d10 configuration is a useful way to design efficient photocatalysts.
8. d0f0 metal oxides
In addition to transition and typical metal oxides, lanthanide metal oxide will be a suitable candidate in the periodic table as photocatalyst for water splitting. Ce(IV)O2 has a [Xe] f0d0s0 electronic structure, which is a kind of closed shell structure of d0 electronic configuration. Although it was reported that CeO2 had the ability to produce oxygen from a suspension of CeO2 containing Ce4+ ions as the electron acceptor, no photocatalytic ability for overall water splitting was observed.87 RuO2-loaded undoped CeO2 exhibited negligible photocatalytic activity under UV irradiation. Interestingly, however, the doping of Sr2+ to CeO2 was found to convert CeO2 into an active photocatalyst in the presence of RuO2 as the cocatalyst.28Sr2+-doped CeO2 is the first example of a photocatalytically active lanthanide oxide for water splitting. In the DFT calculation for S2+-doped CeO2, the occupied valence band was composed of O2p orbital. The unoccupied band consisted of Ce4f orbital band, and Ce5d orbital hybridized with Sr5s5p orbitals, appearing at an upper energy level. In UV-visible diffuse reflectance spectra, the absorption of undoped and Sr2+-doped CeO2 occurred at around 400 nm and leveled off at 350 nm. However, no photocatalytic reaction occurred in a Pyrex glass reaction cell (available for wavelength >300 nm). The threshold absorption at around 400 nm is due to electron transfer from the O2p orbital (HOMO) to the unoccupied Ce4f orbital, but excited electrons failed to participate in the water splitting reaction. This indicates that the electrons transferred to the Ce5d orbital contribute to the reaction. A band model is shown in Fig. 40.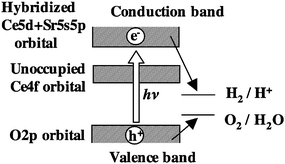 | ||
| Fig. 40 A model of band structure and photocatalysis by Sr-doped CeO2. | ||
The stability of a crystal structure of metal oxides depends on the ionic size ratio of r(Mn+)/r(O2−) where r(Mn+) and r(O2−) are the ion size of a metal ion and an oxygen anion, respectively. The ideal ionic size ratio of r(Mn+)/r(O2−) for a fluorite structure of MO8 decahedra is 0.732, whereas the ratio of CeO2 is 0.703. The difference is considerably large, and, to maintain the fluorite structure, a part of Ce4+ is converted to Ce3+ ion. The partial replacement of Ce4+ by larger and/or less positively charged cations stabilizes the fluorite structure of CeO2 without the formation of Ce3+.88 In view of its slightly larger ionic size and smaller positive charge, the doping of Sr2+ to CeO2 results in the formation of completely Ce3+-free CeO2. A reason why CeO2 itself is photocatalytically inactive is explained in terms of the presence of Ce3+ which behaves as a strongly recombination center for photoexcited charges, and it is evident that its removal activates CeO2 to a photocatalyst with d0f0 configuration.
| Type | Octahedral XO6, tetrahedral XO4 | ||
|---|---|---|---|
| Distorted | Undistorted | ||
| Electronic configuration of core metal ions | d0 | BaTi4O9, M2Ti6O13 (M = Ca, Sr), K2Ti4O9, Na2Ti3O7 | PbWO4 |
| d10 | MIn2O4 (M = Ca, Sr), NaInO2, MGa2O4 (M = Sr, Ba), M2SnO4 (M = Ca, Sr), NaSbO3, M2Sb2O7 (M = Ca, Sr), CaSb2O6, LiInGeO4 | ZnGa2O4 | |
| Interactions between core and neighbor metal ions | Ionic | Covalent | |
| Activation | Geometric and electronic structures | Electronic structures | |
Conclusions
For metal oxide and nitride photocatalysts for water splitting, the effects of distorted and unsymmetrical metal–oxygen octahedral/tetrahedral coordination are established for both d0 and d10 metal oxides involving alkaline metal and alkaline earth metals that have ionic properties. However, we have also shown that remarkable photocatalytic performance was induced even for metal oxides consisting of distortion-free octahdedral/tetrahedral coordination, if the metal ions having covalent bond characters such as Zn2+ and Pb2+ are involved in the metal oxides. This is due to the effects of electronic structures. This concept is summarized in Table 4. The advantage of typical metal oxides with d10 configuration is the formation of conduction bands consisting of largely dispersed broad s and p orbitals in contrast to the narrow flat d band of transition metal oxides. This provides photoexcited electrons with high mobility and is effective for photocatalytic reaction. When metal oxides are composed of d10 core metal ions, together with covalent metal ions as secondary ions, and are formed by the distorted metal–oxygen octahedral/tetrahedral coordination, they are predicted to make useful photocatalysts. As shown in Table 5, although there are a wide variety of metal oxides and nitrides, all the powder photocatalysts found so far for overall water splitting are confined to either completely vacant d orbital (d0, d0f0) or completely filled d orbital (d10, d10s2) electronic configurations, and no open shell structures, that is, dn (9 > n > 1) electronic configuration, are known, to the best of our knowledge. The discovery of open shell structure photocatalysts is very challenging from a viewpoint of electronic structures and solving this would be greatly beneficial to the development of efficient photocatalysts for solar hydrogen.Exactly a century ago, chemists tackled different difficult problems to find a new catalyst for the fixing of N2 as NH3. A large number and a wide variety of chemical compounds were examined as candidates, and finally, alumina-supported Fe + K2O was found to be useful and has commercially been used for ammonia synthesis since 1914. Ironically, this discovery induced today's CO2 problem, because it led to the petroleum-based society of the 20th century. One century later, an essential target to solve CO2 problems and to obtain H2 as an ideal energy source, is the establishment of solar-driven artificial photolysis, in particular, water splitting. Fundamental research in the last 10 years has developed not only d0 - but also d10-photocatalysts for water splitting. Although photocatalytic efficiency still remains at a low level to obtain solar hydrogen, progress has certainly been made in molecular-level understanding and widening of solid-state knowledge for water-splitting photocatalysts, and there is no doubt that continuing research, extending to chemical compounds having other electronic configurations or mixing of different electronic configurations, will cause a break-through in this field that will permit the establishment of a hydrogen society.
Acknowledgements
The author sincerely thanks Prof. H. Kobayashi, Department of Chemistry and Materials Technology, Kyoto Institute of Technology, for collaboration to DFT calculation. The present work was financially supported by a Grant-in-Aid for Scientific Research A (20246117) and on Priority Area (19033229) from The Ministry of Education, Culture, Science, and Technology and for Basic Research (No. 5) from The Ministry of Land, Infrastructure and Transport Government of Japan.References
- A. Fujishima and K. Honda, Nature, 1972, 238, 37 CAS.
- K. Domen, A. Kudo and T. Onishi, J. Catal., 1986, 102, 92 CrossRef CAS.
- Y. Inoue, T. Kubokawa and K. Sato, J. Phys. Chem., 1991, 95, 4059 CrossRef CAS.
- S. Ogura, M. Kohno, K. Sato and Y. Inoue, Appl. Surf. Sci., 1997, 121/123, 521 CrossRef.
- Y. Inoue, Y. Asai and K. Sato, J. Chem. Soc., Faraday Trans., 1994, 90, 797 RSC.
- M. Kohno, T. Kaneko, S. Ogura, K. Sato and Y. Inoue, J. Chem. Soc., Faraday Trans., 1998, 94, 89 RSC.
- T. Takata, Y. Furumi, K. Shinohara, A. Tanaka, M. Hara, J. N. Kondo and K. Domen, Chem. Mater., 1997, 9, 1063 CrossRef CAS.
- T. Takata, K. Shinohara, A. Tanaka, M. Hara, J. N. Kondo and K. Domen, J. Photochem. Photobiol., A, 1997, 106, 45 CrossRef CAS.
- S. Ogura, M. Kohno, K. Sato and Y. Inoue, J. Mater. Chem., 1994, 8, 2335 Search PubMed.
- S. Ogura, K. Sato and Y. Inoue, Phys. Chem. Chem. Phys., 2000, 2, 2449 RSC.
- K. Sayama and H. Arakawa, J. Phys. Chem., 1993, 97, 531 CrossRef CAS.
- A. Kudo, A. Tanaka, K. Domen, K. Maruya, K. Aika and T. Onishi, J. Catal., 1998, 111, 67.
- A. Kudo, H. Kato and S. Nakagawa, J. Phys. Chem. B, 2000, 104, 571 CrossRef CAS.
- Y. Miseki, H. Kato and A. Kudo, Chem. Lett., 2005, 34, 54 CrossRef CAS.
- Y. Miseki, H. Kato and A. Kudo, Chem. Lett., 2006, 35, 10562.
- H. Kato and A. Kudo, Catal. Lett., 1999, 58, 153 CrossRef CAS.
- T. Ishihara, H. Nishiguchi, K. Fukamachi and Y. Takita, J. Phys. Chem. B, 1999, 103, 1 CrossRef CAS.
- H. Kato and A. Kudo, Chem. Phys. Lett., 1998, 295, 487 CrossRef CAS.
- H. Kato and A. Kudo, Chem. Lett., 1999, 1207 CrossRef CAS.
- M. Machida, T. Mitsuyama, K. Ikeue, S. Matsushima and M. Arai, J. Phys. Chem. B, 2005, 109, 7801 CrossRef CAS.
- K. Shimizu, Y. Tsuji, M. Kawakami, K. Toda, T. Kodama, M. Sato and Y. Kitayama, Chem. Lett., 2002, 31, 1158 CrossRef.
- M. Machida, Int. J. Inorg. Mater., 2003, 13, 1433 CAS.
- T. Kurihara, H. Okutomi, Y. Miseki, H. Kato and A. Kudo, Chem. Lett., 2006, 35, 274 CrossRef CAS.
- H. Otsuka, K. Kim, A. Kouzu, I. Takimoto, H. Fujimori, Y. Sakata, H. Imamura and K. Toda, Chem. Lett., 2005, 34, 822 CrossRef CAS.
- N. Saito, H. Kadowaki, H. Kobayashi, K. Ikarashi, H. Nishiyama and Y. Inoue, Chem. Lett., 2004, 133, 1452 CrossRef.
- H. Kadowaki, N. Saito, H. Nishiyama, H. Koayashi, Y. Shimodaira and Y. Inoue, J. Phys. Chem. C, 2007, 111, 439 CrossRef CAS.
- H. Kadowaki, N. Saito, H. Nishiyama, Y. Shimodaira, H. Kobayashi and Y. Inoue, Chem. Lett., 2007, 36, 424 CrossRef CAS.
- H. Kadowaki, N. Saito, H. Nishiyama and Y. Inoue, Chem. Lett., 2007, 36, 440 CrossRef CAS.
- J. Sato, N. Saito, H. Nishiyama and Y. Inoue, J. Phys. Chem., 2001, 105, 6061 Search PubMed.
- J. Sato, N. Saito, H. Nishiyama and Y. Inoue, Chem. Lett., 2001, 868 Search PubMed.
- J. Sato, H. Kobayashi, N. Saito, H. Nishiyama and Y. Inoue, J. Photochem. Photobiol., A, 2003, 158, 139 CrossRef CAS.
- J. Sato, N. Saito, H. Nishiyama and Y. Inoue, J. Phys. Chem. B, 2003, 107, 7965 CrossRef CAS.
- T. Yanagida, Y. Sakata and H. Imamura, Chem. Lett., 2004, 33, 726 CrossRef CAS.
- K. Ikarashi, J. Sato, H. Kobayashi, N. Saito, H. Nishiyama and Y. Inoue, J. Phys. Chem., 2002, 106, 9048 Search PubMed.
- J. Sato, H. Kobayashi, K. Ikarashi, N. Saito, H. Nishiyama and Y. Inoue, J. Phys. Chem. B, 2004, 108, 4369 CrossRef CAS.
- J. Sato, N. Saito, H. Nishiyama and Y. Inoue, J. Photochem. Photobiol., A, 2002, 148, 85 CrossRef CAS.
- J. Sato, N. Saito, Y. Yamada, K. Maeda, T. Takata, J. N. Kondo, M. Hara, H. Kobayashi, K. Domen and Y. Inoue, J. Am. Chem. Soc., 2005, 127, 4150 CrossRef CAS.
- N. Arai, N. Saito, H. Nishiyama, Y. Inoue, K. Domen and K. Sato, Chem. Lett., 2006, 35, 796 CrossRef CAS.
- N. Arai, N. Saito, H. Nishiyama, K. Domen, H. Kobayashi, K. Sato and Y. Inoue, Catal. Today, 2007, 129, 407 CrossRef CAS.
- K. Maeda, T. Takata, M. Hara, N. Saito, Y. Inoue, H. Kobayashi and K. Domen, J. Am. Chem. Soc., 2005, 127, 8286 CrossRef CAS.
- K. Maeda, K. Teramura, D. Lu, T. Takata, N. Saito, Y. Inoue and K. Domen, Nature, 2006, 440, 295 CrossRef CAS.
- Y. Inoue, K. Sato and K. Sato, J. Chem. Soc., Faraday Trans. 1, 1989, 85, 1765 RSC.
- P. S. Brody and F. Crowne, J. Electron. Mater., 1975, 4, 955 CrossRef CAS.
- Y. Inoue, M. Okamura and K. Sato, J. Phys. Chem., 1985, 89, 5184 CrossRef CAS.
- Y. Inoue, K. Sato, K. Sato and H. Miyama, J. Phys. Chem., 1986, 90, 2809 CrossRef CAS.
- Y. Inoue, K. Sato and K. Sato, Chem. Phys. Lett., 1986, 129, 79 CrossRef CAS.
- M. Kohno, S. Ogura, K. Sato and Y. Inoue, Stud. Surf. Sci. Catal. A, 1996, 101, 143 CAS.
- M. Kohno, S. Ogura and Y. Inoue, Chem. Phys. Lett., 1997, 267, 72 CrossRef CAS.
- S. Ogura, M. Kohno, K. Sato and Y. Inoue, Appl. Surf. Sci., 1997, 121/122, 521 CrossRef.
- M. Kohno, S. Ogura, K. Sato and Y. Inoue, J. Chem. Soc., Faraday Trans., 1997, 93, 2433 RSC.
- W. Hofmeister and E. Tillmanns, Acta Crystallogr., 1984, C 40, 1510 CAS.
- D. H. Templeton and C. H. Dauben, J. Chem. Phys., 1960, 32, 1515 CrossRef CAS.
- S. Andersson and A. D. Wadsley, Acta Crystallogr., 1962, 15, 194 CrossRef CAS.
- M. C. Payne, M. P. Teter, D. C. Allan, T. A. Arias and J. D. Joannopoulos, Rev. Mod. Phys., 1992, 64, 1045 CrossRef CAS.
- J. Sato, H. Kobayashi and Y. Inoue, J. Phys. Chem. B, 2003, 107, 7970 CrossRef CAS.
- R. von Schenck and H. Mueller-Buschbaum, Z. Anorg. Allg. Chem., 1973, 398, 24 CrossRef CAS.
- F. R. Criuckshank, D. MaK. Taylor and F. P. Glasser, J. Inorg. Nucl. Chem., 1964, 26, 937 CrossRef.
- A. Lalla and H. Mueller-Buschbaum, Z. Anorg. Allg. Chem., 1990, 588, 117 CrossRef CAS.
- S. Geller, Acta Crystallogr., 1957, 10, 248 CrossRef CAS.
- E. Hubbert-Paletta, R. Hoppe and G. Kreuzburg, Z. Anorg. Allg. Chem., 1970, 379, 255 CAS.
- H. Glaum, S. Voigt and R. Hoppe, Z. Anorg. Allg. Chem., 1991, 598, 129 CrossRef.
- P. D'Arco, B. Silvi, C. Roetti and R. Orland, J. Geophys. Res. B, 1991, 96, 6107 Search PubMed.
- V. Kahlenbeerg, R. X. Fischer and C. S. J. Shaw, J. Solid State Chem., 2000, 153, 294 CrossRef.
- V. Kahlenbeerg, R. X. Fischer and J. B. Praise, J. Solid State Chem., 2000, 154, 612 CrossRef.
- V. V. Zhurov, A. A. Bush, S. A. Ivanov, S. Yu. Stefanovich and B. N. Romanov, Sov. Phys. Solid State, 1991, 33, 960.
- Y. Inoue, Photocatalytic activity for water decomposition of RuO2-dispersed p-block metal oxides with d10 electronic configuration in Metal Oxides Chemistry and Applications, ed. J. L. G. Fierro, Taylor & Francis, 2006, ch. 20, 623–659 Search PubMed.
- J. Hornstra and E. Keulen, Phillips Res. Rep., 1972, 27, 76 Search PubMed.
- C. Hang, M. A. Simonov and N. V. Belov, Sov. Phys. Crystallogr., 1970, 15, 387 Search PubMed.
- M. Troemel, Z. Anorg. Allg. Chem., 1969, 371, 237 CrossRef CAS.
- B. J. Kennedy, Aust. J. Chem., 1997, 50, 917 CrossRef CAS.
- M. A. Green, K. Prassides, P. Day and J. K. Stalick, J. Chem. Soc., Faraday Trans., 1996, 92, 2155 RSC.
- W. A. Groen and D. J. W. Ijdo, Acta Crystallogr., 1988, C44, 782 CAS.
- B. Wang, S. C. Chen and M. Greenblatt, J. Solid State Chem., 1994, 108, 184 CrossRef CAS.
- B. G. DeBoer, R. A. Young and A. Sakthivel, Acta Crystallogr., 1994, C50, 476 CAS.
- S. K. Sampath, D. G. Kanhere and R. Pandey, J. Phys.: Condens. Matter, 1999, 11, 3635 CrossRef CAS.
- S. H. Wei and A. Zunger, Phys. Rev. B, 1988, 37, 8958 CrossRef CAS.
- G. Hitoki, A. Ishikawa, T. Takata, J. N. Kondo, M. Hara and K. Domen, Chem. Lett., 2002, 31, 736 CrossRef.
- G. Hitoki, T. Takata, J. N. Kondo, M. Hara, H. Kobayashi and K. Domen, Chem. Commun., 2002, 1698 RSC.
- D. Yamashita, T. Takata, M. Hara, J. N. Kondo and K. Domen, Solid State Ionics, 2004, 172, 591 CrossRef CAS.
- A. Kasahara, K. Nukumizu, G. Hitoki, T. Takata, J. N. Kondo, M. Hara, H. Kobayashi and K. Domen, J. Phys. Chem. A, 2002, 106, 6750 CrossRef CAS.
- H. Kadowaki, J. Sato, H. Kobayshi, N. Saito, H. Nishiyama, Y. Shimodaira and Y. Inoue, J. Phys. Chem., 2005, 109, 22995 Search PubMed.
- M. Touboul and P. Toledano, Acta Crystallogr., 1987, C 43, 2004 CAS.
- A. Kudo and H. Kato, Chem. Lett., 1997, 421 CrossRef CAS.
- A. Kudo and H. Hijii, Chem. Lett., 1999, 1103 CAS.
- J. M. Moreau, Ph. Galez, J. P. Peigneux and M. V. Korzhik, J. Alloys Compd., 1996, 238, 46 CrossRef CAS.
- L. G. Sillen, A. L. Nylander and Ark. Kemi, Mineral. Geol. A, 1943, 17, 1 Search PubMed.
- G. R. Bamwenda, K. Sayama and H. Arakawa, Chem. Lett., 1999, 1047 CrossRef CAS.
- S. Yabe, M. Shigeyoshi, M. Kazuyuki, S. Yoshida, R. Li and T. Sato, Int. Inorg. Mater., 2001, 3, 1003 Search PubMed.
| This journal is © The Royal Society of Chemistry 2009 |

