Cyclic voltammetry of biofilms of wild type and mutant Geobacter sulfurreducens on fuel cell anodes indicates possible roles of OmcB, OmcZ, type IV pili, and protons in extracellular electron transfer†
Received
23rd September 2008
, Accepted 8th January 2009
First published on 4th February 2009
Abstract
Geobacteracea
are distinct for their ability to reduce insoluble oxidants including minerals and electrodes without apparent reliance on soluble extracellular electron transfer (ET) mediators. This property makes them important anode catalysts in new generation microbial fuel cells (MFCs) because it obviates the need to replenish ET mediators otherwise necessary to sustain power. Here we report cyclic voltammetry (CV) of biofilms of wild type (WT) and mutant G. sulfurreducens strains grown on graphite cloth anodes acting as electron acceptors with acetate as the electron donor. Our analysis indicates that WT biofilms contain a conductive network of bound ET mediators in which OmcZ (outer membranec-type cytochrome Z) participates in homogeneous ET (through the biofilm bulk) while OmcB mediates heterogeneous ET (across the biofilm/electrode interface); that type IV pili are important in both reactions; that OmcS plays a secondary role in homogenous ET; that OmcE, important in Fe(III) oxide reduction, is not involved in either reaction; that catalytic current is limited overall by the rate of microbial uptake of acetate; that protons generated from acetate oxidation act as charge compensating ions in homogenous ET; and that homogenous ET, when accelerated by fast voltammetric scan rates, is limited by diffusion of protons within the biofilm. These results provide the first direct electrochemical evidence substantiating utilization of bound ET mediators by Geobacter biofilms and the distinct roles of OmcB and OmcZ in the extracellular ET properties of anode-reducing G. sulfurreducens.
Broader context
Geobacteracea
are extensively studied for their significant environmental impact. They are distinct for their ability to exchange electrons with electrodes without apparent reliance on soluble extracellular electron transfer (ET) mediators, making them important anode catalysts in new generation microbial fuel cells because it obviates the need to replenish ET mediators otherwise necessary to sustain power. Here we provide the first description of the mechanism of electrode reduction by Geobacteracea, determine probable roles played in this process by various proteins, and determine the rate limiting steps.
|
Introduction
In microbial fuel cells (MFCs) microorganisms catalyze the anode half-reaction by metabolizing fuel and utilizing the anode as an electron acceptor.1 MFCs combine the wide range of biomass-derived fuels with long-term durability of microbial consortia. While the underlying concept has been known for decades,2 only recently has a MFC been demonstrated as a practical alternative to conventional power sources for specific applications.3 While many microorganisms have been utilized in MFCs2–5 our studies have focused on Geobacter sulfurreducens because it is closely related to the Geobacteraceae enriched in biofilms formed on anodes of MFCs harvesting electricity from a variety of aquatic sediments.6–8 In addition this organism is often enriched on anodes of MFCs designed to study their potential for wastewater treatment.9–12 This enrichment may result from its ability to generate high current densities at high coulombic efficiencies without apparent reliance on soluble ET mediators;13–15 a desirable property for MFCs because it eliminates the need to maintain ET mediators (either endogenous, secreted by the organisms or exogenous, added externally) in the anodic half cell enabling uninterrupted power generation with continual addition of fuel. Furthermore, availability of its genome sequence and a genetic system makes it feasible to rationally investigate contributions of its cellular components to its power generation capabilities.16,17
Significant investigation of extracellular ET by anode-bound biofilms of G. sulfurreducens has implicated various redox active outer membranec-type cytochromes.14,16–37 In thin (ca. 10 µm thick) WT biofilms, genes for OmcS and OmcE are more highly expressed than in planktonic cells grown with a soluble electron acceptor such as Fe(III) citrate.16 In thick (ca. 50 µm) biofilms32,36 where homogenous ET is presumably more challenged, whole genome analysis of gene transcript abundance revealed genes more highly expressed in cells grown on electrodes maintained at oxidizing potentials (i.e., anodes) than on identical non-potentiostated electrodes (i.e., at open circuit) with fumarate serving as the electron acceptor.36 One such gene is for OmcB, known to be partially inserted in the outer membrane.31 OmcE is also up-regulated, whereas OmcS is down-regulated.36 Simultaneous deletion of OmcB, OmcE, and OmcS temporarily inhibits electricity generation, and adaption by this strain is accompanied by increased abundance of OmcZ.37 An additional up-regulated gene in thick biofilms is for PilA, the structural protein (not redox active) of type IV pili in G. sulfurreducens, found to be essential for Fe(III) oxide reduction.17 A strain, in which PilA is deleted, produces significantly less current than WT cells, and exhibits no adaptation to WT-level current production even after extended incubation.32,36 In addition, the gene for OmcZ exhibits a much higher transcript abundance in anode-grown than fumarate-grown biofilm cells, and deletion of this gene severely inhibits current production with no long-term adaption.36
Using CV, Bond et al.38 established the precedent that anode-bound G. sulfurreducens in biofilms, and entrapped in pectin exhibit electrochemical properties consistent with anode-bound catalysts. More recently, they used CV to electrochemically characterize anode-bound biofilms of Shewanella.39 Their characterization revealed that Shewanella oneidensisMR-1 and Shewanella sp. MR-4 secrete riboflavin, which acts as a soluble extracellular ET mediator in extracellular ET from individual microbes in biofilms to the underlying anodes. CV of anode-bound Shewanella and Geobacter are markedly different38,39 reflecting possible fundamental differences in their extracellular ET properties. While previous studies indicate that Shewanella species can reduce insoluble electron acceptors, such as Fe(III) oxides or electrodes not in contact with the cells,8,14,24,40–44Geobacter species must be in contact with insoluble electron acceptors in order to reduce them and investigations of the potential utilization of endogenous soluble ET mediators by Geobacter and related species have yielded only negative results.6,14,45
CV is a time-honored electroanalytical technique, used extensively for studying charge transfer in electrochemical systems. In the context of electrode-bound catalysts, it is used to probe the mechanism of ET from substrate (e.g., acetate) to the electrode surface by changing the driving force and rate of the heterogeneous ET step (across the catalyst/electrode interface) by means of changing the electrode potential (E). Monitoring current (i) as a function of E and rate of change of E (voltammetric scan rate, v) yields i–E–v dependencies that can provide detailed mechanistic information about the entire ET mechanism. Here we expand upon the use of CV by Bond et al.38 to investigate in greater detail anode-bound biofilms of G. sulfurreducens. We compare i–E–v dependencies of WT to an OmcB-deletion mutant (ΔomcB), an OmcE-deletion mutant (ΔomcE), an OmcS deletion mutant (in which OmcT expression is inhibited (ΔomcST)), an OmcZ-deletion mutant (ΔomcZ), and a PilA-deletion mutant (ΔpilA), and determine possible roles of the above proteins in microbe-to-anode extracellular ET. We propose a multistep extracellular ET mechanism drawing on prior electrochemical investigations of electrode-bound catalysts, demonstrate that protons generated within the biofilm from microbial oxidation of acetate act as charge compensating ions, corroborate recent results that implicate the flux of these protons in limiting the rate of homogeneous ET in WT G. sulfurreducens biofilms46 and provide direct electrochemical evidence substantiating use of bound ET mediators by an anode-bound biofilm.
Methods
Microbial fuel cells
MFCs were constructed from commercially available methanol fuel cells as described previously.15 Briefly, for each MFC, the volume of each half cell was 10 mL. Both the anode and cathode were comprised of graphite cloth (type GC-14, Electrolytica, Inc., Amherst, NY), separated by a Nafion© 117 membrane (3.5 cm × 3.5 cm). The cathode and anode were connected by a 560 Ω resistor during biofilm growth. The anode and cathode electrical connections were fashioned as previously described.15 Dimensions of the cathode and anode were 2.54 cm × 2.54 cm and 1.27 cm × 0.64 cm, respectively. The anode surface area was estimated to be 2.40 cm2 by comparing maximum catalytic current of biofilms on carbon cloth with that accomplished on plane graphite rod electrodes with known dimensions. This result was supported by calculations based on the diameter and thread count of the fibers comprising the carbon cloth anode. A Ag/AgCl, 3 M KCl reference electrode (BAS, West Lafayette, IN, USA) was positioned in the anodic half cell with the tip approximately 0.5 cm from the anode face. The anode and cathode half cells were supplied with sterile media (described below) using Masterflex PharMed BPT tubing and peristaltic pumps. All MFC components were sterilized and assembled as previously described.15
Organisms, media and growth conditions
Geobacter
sulfurreducens strain PCA (ATCC 51573, DSMZ 1212747) and mutants lacking PilA,17 OmcB,26 OmcE,18 OmcST (ΔomcS since OmcT is also not expressed in the ΔomcS mutant18) and OmcZ36 were obtained from an in-house culture collection. Each strain was cultured with 10 mM acetate and 40 mM fumarate in pressure tubes under strict anaerobic conditions in NBAF medium as previously described48 and subsequently investigated in its own MFC. Cell growth in each MFC was performed as previously described15 but utilizing a freshwater medium49 containing 0.06 g L−1 NaH2PO4. Briefly, for each strain, 250 ml of sterile media containing a 10% culture inoculum, 10 mM acetate and 10 mM fumarate was re-circulated through the anodic half cell while the anode was electrically connected to the cathode by a 560 Ω resistor. Media containing only 50 mM K3Fe(CN)6. Once an optical density of 0.2 was achieved, 250 ml of sterile media lacking cells and fumerate, but containing 10 mM acetate, was re-circulated through the anodic half cell at a dilution rate of 8.6 h−1 to remove planktonic cells and fumarate from the half cell.
Analytical
During biofilm growth, the voltage across the 560 Ω resistor connecting the anode and cathode of each MFC was recorded hourly. Once a stable electrical current was achieved across the resistor (ca. 0.5 mA in the case of WT) indicating a fully grown biofilm, the resistor was removed and the anode maintained by potentiostat at 0.300 V vs. the Ag/AgCl reference electrode (0.500 V vs. the standard hydrogen electrode (SHE)) using the cathode as the auxiliary electrode and fresh sterile media lacking cells and fumerate but containing 10 mM acetate was continuously flowed through the anodic half cell at a dilution rate of 0.86 h−1. During CV the media flow rate was increased to a dilution rate of 8.6 h−1.
The potentiostat (Model 2053, AMEL Instruments, Milano, Italy) was operated by a Macintosh computer running software (Echem version 2.010, eDAQ, Colorado Springs, CO, USA) interfaced to the potentiostat with a Powerlab data acquisition system (Model 4SP, ADInstruments, Colorado Springs, CO, USA). CV was performed from +0.300 to −0.500 V vs. the Ag/AgCl reference electrode at scan rates from 0.002 to 5.000 V s.−1 All potentials are reported hereon vs.SHE by subtraction of 0.200 V for easier comparison to biological redox potentials. No real-time IR compensation was employed while recording CV. Post analysis of the CV depicted here based on the semi-integral method described by Bond et al.50 yielded a value for the uncompensated solution resistance of 0.332 ± 0.070 Ω (n = 5), indicating a negligible IR loss of 0.0018 V at 5 V s−1.
Biofilms on graphite cloth electrodes were fluorescently stained with the LIVE/DEAD BacLight Bacte3rial Viability Kit (L7012, Molecular Probes, Inc., Eugene, OR, USA) and examined by confocal laser scanning microscopy, as previously described15 for determination of biofilm thickness.
Results and discussion
Growth of wild type and mutant biofilms on graphite anodes
Fig. 1 depicts typical current vs. time records during biofilm growth for WT G. sulfurreducens and the five mutants (ΔomcB, ΔomcE, ΔomcST, ΔomcZ, and ΔpilA), on equally-sized graphite fiber-based cloth anodes, in MFCs utilizing acetate as the electron donor and the anodes as the electron acceptors. Each biofilm, grown by connecting the anode to an oversized cathode through a resistor (not under potential or galvanic control), exhibited a growth pattern similar to that reported on anodes maintained at oxidizing potentials (e.g., +0.050V to +0.300 V vs.SHE).32,36 Each biofilm grew to a self-determined thickness, indicated in Fig. 1. ΔomcB, ΔomcE, and ΔomcST each exhibited a growth rate and maximum catalytic current (id) similar to WT G. sulfurreducens. By contrast, ΔomcZ exhibited a previously described failed adaption36 achieving a much lower unsustainable current and thickness after 10 days, and total loss of catalytic activity by 26 days. ΔpilA exhibited a previously described sustained current and thickness without adaption.17,32
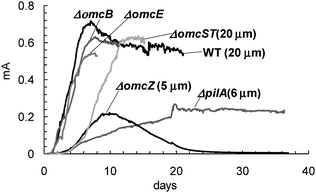 |
| | Fig. 1 Current–time records of current generation by WT G. sulfurreducens and deletion mutants during biofilm growth on graphite anodes. Self-determined thickness of each indicated where determined. | |
Cyclic voltammetry of wild type G. sulfurreducens biofilms
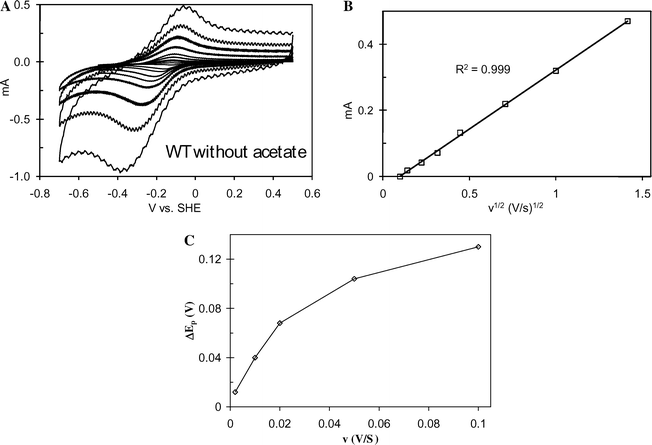
CV of the WT biofilms is anodic (positive current) and sigmoid-shaped at slow scan rate (Fig. 2 and 3A), and evolves into anodic and cathodic peaks at high scan rate (Fig. 4A). Such i–E–v dependencies are consistent with classic catalyst-dependent electrode reactions, first described in detail by Savéant and Vianello in 1965,51 and more recently by Katakis and Heller ,52 to describe systems containing electrode-bound, non-diffusing, redox enzymes that couple oxidation of non-electrode-reactive substrates with reduction of electrode-reactive ET mediators. Following Katakis and Heller, we propose the reaction scheme below (depicted schematically in Fig. 5) for describing extracellular ET from microbes comprising an anode-bound biofilm of WT G. sulfurreducens to the anode surface. In this scheme, the biofilm is treated as a three-dimensional coating comprised of bound (i.e., non-diffusing) catalysts reliant on ET mediators in the biofilm for transferring electrons through the biofilm and across the biofilm/electrode interface.
| | | i = nFA(kox([Medred)0] – kred([Medox)0]) | (1) |
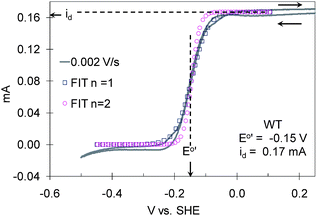 |
| | Fig. 2
Cyclic voltammetry of the G. sulfurreducensWT biofilm recorded at 0.002 V s−1 from 0.25 V to −0.50 V and back to 0.25 V vs.SHE qualitatively fitted to eqn (6) for n = 1 and n = 2, id = 0.17 ± 0.005 mA and E0′ = −0.145 ± 0.01 V vs.SHE. | |
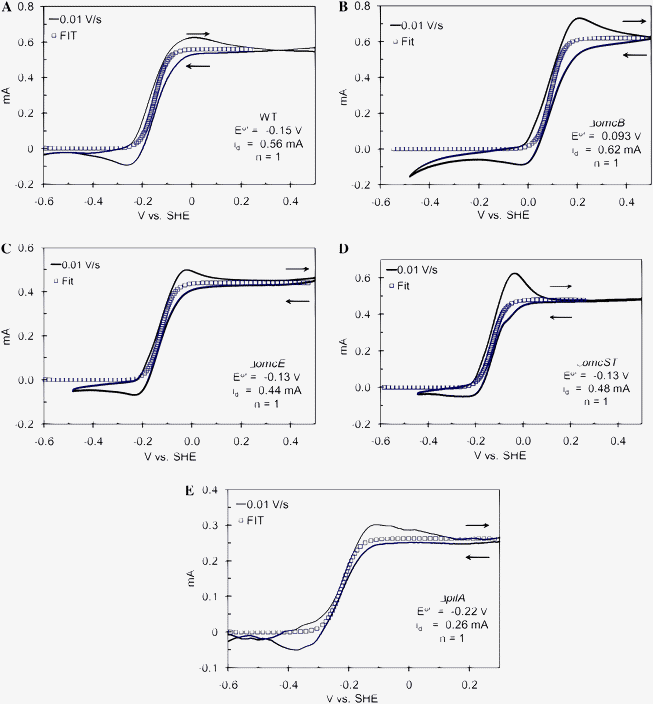 |
| | Fig. 3 CV recorded at 0.01 V s−1 from the indicated positive potential limit to the negative potential limit and back to the positive potential limit qualitatively fitted to eqn (6) of biofilms of A: WT G. sulfurreducens, B: ΔomcB; C: ΔomcE; D: ΔomcST; E: ΔpilA. | |
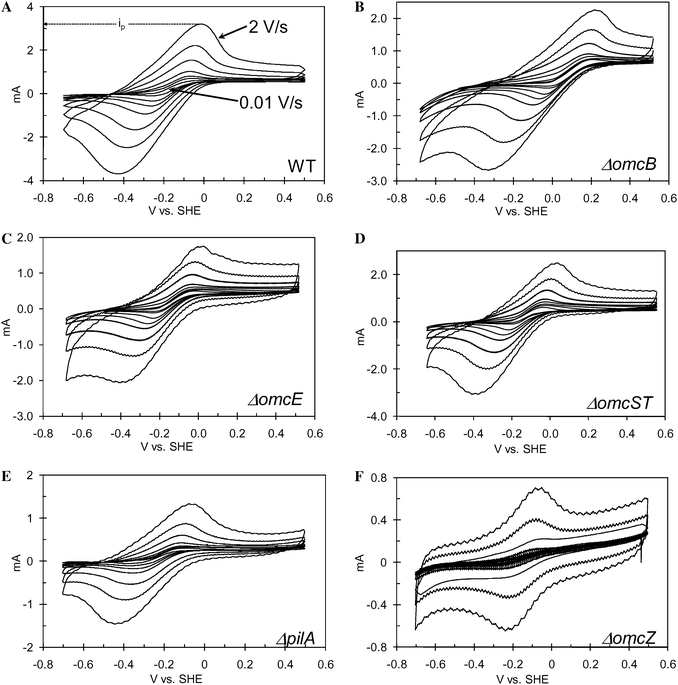 |
| | Fig. 4 Scan rate dependency of CV recorded from the indicated positive potential limit to the negative potential limit and back to the positive potential limit for biofilms of A: WT G. sulfurreducens; B: ΔomcB; C: ΔomcE; D: ΔomcST; E: ΔpilA; F: ΔomcZ recorded over a range of scan rates from 0.01 V s−1 to 2 V s−1. The anodic peak current (ip) indicated for WT in case of 2 V s−1. | |
 |
| | Fig. 5 Schematic depiction of electron transfer from acetate to the electrode surface catalyzed by a single microbe within a biofilm of WT G. sulfurreducens. Grey shaded area represents biofilm. The vertical axis indicates relative potential energy of electrons during electron transfer (as voltage increases, potential energy decreases). The horizontal axis indicates relative distance from the electrode surface. Red numbers indicate reaction step described in text. The reactant and product labels are defined in the text. Blue lines indicate relative potential energy of electrons at each step during electron transfer. The potential energy level of electrons on the anode surface is determined by the potentiostat during CV, directly affecting the kinetics and thermodynamics of step 4, which in turn affects the overall rate of electron transfer from acetate. The potential energy drop depicted to occur inside the microbe between acetate oxidation and mediator reduction is comprised, in part, by the metabolic benefit to the microbe. The potential energy drop depicted to occur through the biofilm results from a concentration gradient of reduced mediator caused by generation of reduced mediator by the microbe and consumption of reduced mediator at the anode. The relative energy levels are not drawn to scale. | |
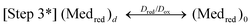
Here, Micox and Micred are oxidized and reduced microbes, Ac is acetate, and Medred and Medox are reduced and oxidized forms of the ET mediator. In step 1, microbes with affinity for Ac of Km oxidize Ac with rate constant kcat, generating carbon dioxide and protons.53 In step 2, each of the 8 electrons yielded by step 1 undergo intracellular ET (resulting in the microbial metabolic benefit depicted in Fig. 5) and reduce Medox in the biofilm, at distance d from the anode surface regenerating Micox with rate constant k. In step 3*, each (Medred)d diffuses into contact with the electrode (d = 0), with diffusion coefficient Dred. This ET mechanism is proposed for many non-corrosive biofilms investigated to date,54 and relies on microbes secreting soluble (endogenous) ET mediators and/or utilizing naturally occurring or added (exogenous) mediators from the environment, e.g., Geothrix,55Shewanella (quinines56,57 and riboflavin39,58) and Pseudomonas (Phenazines1). If step 3* is reversible, Medox diffuses back through the biofilm for reuse by the microbes. Step 3 is an alternative mechanism for homogeneous ET we propose here for G. sulfurreducens based on results described below, in which the mediators are bound (non-diffusing) in the extracellular domain of the biofilm. Here, extracellular ET from distance d to the electrode surface occurs by a series of ET reactions among adjacent ET mediators with forward and reverse rate constants k3 and k–3. We model this mechanism on that proposed by Katakis and Heller52 for enzyme-modified electrodes, utilizing known bound ET mediators covalently attached within polymer films. In step 4 (heterogeneous ET), Medred reduces the anode generating electrical current (i) across the biofilm–electrode interface (ne− where n is the change in oxidation state of the ET mediator between the oxidized and reduced form), and regenerate Medox with forward and reverse rate constants kox and kred. Eqn (1) relates current (i) resulting from step 4, where [(Medred)0] and [(Medox)0] are concentrations of Medred and Medox in immediate contact with the electrode surface, and A is the surface area of the electrode in cm2. It is important to note that bound ET mediators require ion mobility to electrostatically balance the momentary change in oxidation state experienced by each individual ET mediator during each homogeneous and heterogeneous ET event.59,60 Furthermore, distinct and multiple ET mediators may be involved in each step.13
In step 4, kox and kred depend upon E as described by the Butler–Volmer electrode reaction rate expressions61
| | | kox = k0exp((1 − α)(nF/RT)(E − E0′)) | (2) |
| | | kred = k0exp(−α(nF/RT)(E − E0′)) | (3) |
where
E0′ is the formal potential of the ET mediator,
k0 is the standard rate constant for the heterogeneous ET step,
α is the transfer coefficient,
61 which ranges between 0 and 1 depending upon the specific electrode reaction, but typically takes the value of
ca. 0.5,
T is temperature (K), and
R,
T, and
F are standard constants.
Eqn (2) and
(3) predict that when
E ≫
E0′,
kox ≫
k0 ≫
kred; when
E =
E0′,
k0 =
kox =
kred; and when
E <<
E0′,
kox <<
k0 <<
kred. If step 1 is fast (large
k0) compared to the scan rate (
v, rate of change of
E), [(Med
ox)
0] and [(Med
red)
0] will depend upon
E as described by the Nernst equation.
61| | | E = E0′ + RT / nFln([(Medox)0]/[(Medred)0]) | (4) |
If steps 3 or 3* are also fast (large k3 and k–3 or Dred and Dox) compared to the scan rate, [Medox] and [Medred] (total concentrations of oxidized and reduced forms of the mediator in the biofilm) will also depend upon E as described by the Nernst equation in an analogous fashion. If in addition, step 2 is fast (large k) compared to the scan rate, catalytic current (i, eqn (1)) will scale linearly with [Medox] up to the maximum catalytic current (id) because step 2 is first order with respect to [Medox]. This results in a sigmoid-shaped i–E dependency (e.g., Fig. 2) due to the sigmoid-shaped [Medox]–E dependency expressed as:
| | | [Medox] = [Med]/(1 + exp((E0′ − E)(nF/RT))) | (5) |
derived directly from the Nernst equation, where [Med] = [Med
ox] + [Med
red] (the total concentration of ET mediator in the biofilm).
Eqn (5) predicts that when
E ≫
E0′, [Med
ox] = [Med] (
i.e., all ET mediator in the biofilm is oxidized) and maximum catalytic current (
id) is observed. When
E =
E0′ (the inflection point of
Fig. 2), [Med
ox] = [Med]/2 (half as much current observed compared to when [Med
ox] = [Med]), and when
E <<
E0′, [Med
ox] = 0, and ideally no current is observed.
In Fig. 2, which was recorded during growth of the biofilm (id is therefore smaller compared to Fig. 1 at full growth), the experimental CV is qualitatively compared to the i–E dependency in eqn (6), derived directly from eqn (5).
| | | (id – i)/i = exp((E − E0′)(nF/RT)) | (6) |
for
n = 1 and
n = 2, with
E0′ = −0.145V
vs.SHE and
id = 0.167 mA. Here,
E0′ is the formal potential of the mediator of the heterogeneous ET reaction (step 4),
i is the catalytic current for a given
E, and
id is the maximum catalytic current at
E ≫
E0′, when [Med
ox] is at maximum value ([Med]). In turn, following classic enzyme kinetics,
id can be expressed as:
53| | | id = nFAkcat[Mic]/(1 + (kcat/k[Med]) + (Km)/[Ac]/8)) | (7) |
where [Ac] is the concentration of Ac in the biofilm (divided by 8 to account for the 8 electrons per equivalent of acetate oxidized), [Mic] is the concentration of microbes in the biofilm, and
A is the surface area of the electrode in cm
2. The correlation (not rigorous) of
Fig. 2 to
eqn (6) for
n = 1 and
E0′ = −0.145 V
vs.SHE has the following implications: (1) Electrons are transferred through the biofilm by ET mediators one at a time (
i.e.,
n = 1). (2)
i scales proportionally with [Med
ox] in response to the electrode potential (
E). (3)
id scales proportionally with [Med]. According to
eqn (7), this would occur when [Ac]/8 ≫
Km and
kcat≫
k[Med], yielding
eqn (8),
indicating
id is proportional to
k, [Mic] and [Med] but limited by
Km (step 1). This outcome is consistent with our experience that
id is independent of acetate concentration above 5 mM. (4) The biofilm is sufficiently conductive, such that its
i–
E dependency is not distorted by resistance (as exhibited by the
omcZ deletion mutant described below). This conclusion is consistent with that of Bond
et al. on the conductive nature of anode-bound biofilms of
G. sulfurreducens38 and with that of Torres
et al.46 on the conductive nature of anode-bound biofilms comprised predominantly of
G.
sulfurreducens.
28 (5) Heterogeneous ET (step 4) is sufficiently fast with respect to v (0.002 V s
−1) such that as
E is changed, [Med
ox]
0 immediately adjusts to satisfy the Nernst equation. (6) Steps 3 or 3* are also sufficiently fast with respect to the scan rate, so that, as
E changes, homogenous ET is sufficiently fast to satisfy the Nernst equation across the entire biofilm (
i.e., [Med
ox]
0 = [Med
ox]). (7) The formal potential of the extracellular ET mediator in step 4 is −0.15 ± 0.01 V
vs.SHE, since it is the ET mediator (if others are acting in prior steps) the electrode reacts directly with. This value for
E0′ is in close agreement with that observed by Bond
et al.7 and Schröder
et al.1 for
G. sulfurreducens and with that of the
G. sulfurreducens periplasmic
cytochrome PpcA thought to donate electrons to outer membrane
cytochromes in step 2 during iron
reduction. It is important to note that correlation of
Fig. 2 to
eqn (6) does not require a homogenous population of microorganisms throughout the biofilm with respect to the rates of steps 1–4, only that for an overwhelming majority of microorganisms in the biofilm, steps 1–4 are very fast relative to the scan rate to ensure the appearance of a near overall Nernstian response (
eqn (8)). It is also important to note that a small but non-negligible cathodic catalytic current is observed in
Fig. 2 for
E < −0.2
vs.SHE. The cause of this current is unknown at this time and we contend that it may result from
G. sulfurreducens catalyzed
reduction of trace components in the media.
62CVs (not shown) recorded in the same media at bare graphite electrodes do not exhibit this reduction current.
Fig.
3A depicts the CV recorded at 0.010 V s−1 for a fully-grown biofilm of WT G. sulfurreducens (hence id in Fig. 3A is greater than observed in Fig. 2 and comparable to current observed at full growth in Fig. 1). While exhibiting the same formal potential and sigmoid-shape of Fig. 2, it also exhibits hysteresis and emergence of anodic and cathodic current peaks which become more pronounced with increasing scan rate (Fig. 4A). The cathodic scan in Fig. 3A (0.5 V to −0.6 V vs.SHE) corresponds to the lower current curve, while the anodic scan (−0.6 V back to 0.5 V vs.SHE) corresponds to the upper current curve. Hysteresis is typical of CV, and attributed here in small part to double-layer capacitance charging current which scales linearly with scan rate.61 It is attributed here to step 1 limiting catalytic current. During the cathodic scan, steps 3 and 4 accelerate in the reverse direction, as described by eqn (2) and (3), in order to satisfy the Nernst equation, and the electrode generates Medred faster than the microbes can reduce remaining Medox (step 2). This results in the growing cathodic contribution (negative deviation) of the anodic current observed for E ≥ E0′, and the cathodic peak is observed for E ≤ E0′ when all remaining oxidized ET mediator is reduced by the electrode. Conversely, during the anodic scan, steps 3 and 4 accelerate in the forward direction, and the electrode generates Medox faster than the microbes can reduce it. This results in the growing anodic contribution (positive deviation) observed in the anodic current at E ≤ E0′, and the anodic peak is observed for E ≥ E0′ when all remaining Medox is oxidized by the electrode. The increasing anodic and cathodic peak currents recorded with increasing scan rate (Fig. 4A) result from systematically increasing the rate of acceleration of steps 3 and 4 beyond that encountered during generation of id (Fig. 2). The increasing peak splitting (potential of the anodic peak minus potential of the cathodic peak), observed with increasing scan rate (Fig. 4A), originates from the limitation in the rate of step 4, due to k0 in eqn (2) and (3). In this qualitative description, we can not rule out heterogeneity among mediators throughout the biofilm with respect to the rates of steps 3 and 4 which would affect the peak shapes and dependency of peak splitting on scan rate.
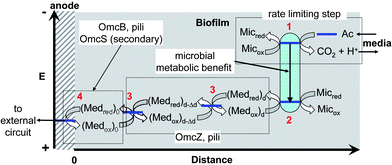
Fig. 6A and B depict dependency with v and v1/2 of the anodic peak currents (ip), determined from Fig. 4A that are normalized by id determined at 0.010 V s−1 from Fig. 3A. These plots are based on that of Nicholson and Shain,63 derived for catalyst-dependent electrode reactions, in which catalysts diffuse to the electrode surface. Their analysis indicated that ip/id is expected to increase linearly with v1/2, owing to the linear dependency of ipvs.v1/2 for non-catalyst-dependent electrode reactions in which a diffusing species is directly oxidized by an electrode.61 Here, ip/idvs.v (Fig. 6A) is linear up to a threshold scan rate of 0.5 V s−1. At faster scan rates ip/id is linear with v1/2 (Fig. 6B). This bimodal behavior, we contend, derives from confinement of ET mediators in biofilm, whether bound (insoluble) or unbound (soluble). Either condition is expected to result in linear ipvs.v, at slow scan rates (if ip is not limited by the rate of a diffusing species through the biofilm) in the case of either a soluble ET mediator (step 3*) or charge compensating ions (step 3).32 At faster scan rates there is less time for diffusion to occur; consequently, as step 3 or 3* is further accelerated, the linear ipvs.v1/2 dependency arises, when current becomes limited by diffusion through the biofilm of either soluble ET mediator or charge compensating ions.64 Fick's law of diffusion provides an estimation of the minimum diffusion coefficient (D) of the current-limiting soluble species for this transition to occur at 0.50 V s−1,61
assuming
L, the diffusion layer thickness, is the biofilm thickness (0.0002 cm). Here
t is the time required to convert all ET mediator in the biofilm from the oxidized to reduced form at 0.50 V s
−1, which can be estimated from the width of the anodic peak base divided by scan rate (0.80 V/0.50 V s
−1 = 1.3 s), yielding
D ≫ 1.5 × 10
−6 cm
2 s
−1.
 |
| | Fig. 6 For the WT G. sulfurreducens biofilm, A: Plot of anodic ip/idvs. scan rate (v); B: plot of anodic ip/idvs.v½; both recorded in the presence of acetate. | |
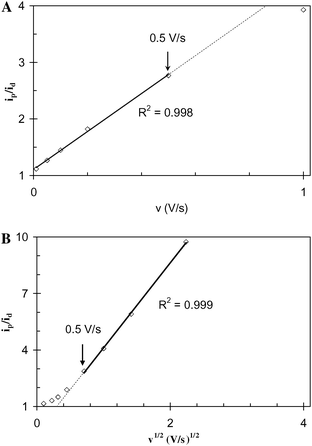
In contrast to Fig. 6A and B, Fig. 7B depicts a linear dependency of the anodic peak currents vs.v1/2 for v << 0.5 V s−1, recorded in the absence of acetate, indicating that step 3 or 3* is more hindered by diffusion without acetate. Based on the recent results of Torres et al.,46 we contend that the limitation in rate of homogenous ET, depicted in Fig. 6B at v ≥ 0.50 V s−1 where the rate of homogenous ET is significantly accelerated beyond that required to maintain id, is due to diffusion of charge compensating protons (step 3). Charge compensation is more hindered in the absence of acetate since protons are generated inside the biofilm by step 1. The minimum diffusion coefficient determined above is low compared to that of protons in water (9.3 × 10⁻⁵ cm2 s−1)64 or even in a (hypothetical) dense biofilm (9.3 × 10⁻⁶ cm2 s−1)65,66 and is consistent with proton diffusion being limited in turn by buffer diffusion at the biofilm/media interface.66
 |
| | Fig. 7 For the WT G. sulfurreducens biofilm, A: CV recorded from the indicated positive potential limit to the negative potential limit to the positive potential limit over a range of scan rates from 0.01 V s−1 to 2 V s−1 in the absence of acetate; B: Plot of ivs.v1/2. | |
It is recognized that the above treatment is qualitative and not rigorous because microorganisms are not individual enzymes, nor were the voltammograms fitted to simulations of steps 1–4 to yield values for various reaction parameters including the degree of possible heterogeneity among the microbes and mediators in the biofilm (work in progress), it does provide however, a useful model for studying the mechanism of extracellular ET in the Geobacter sulfurreducens biofilms.
Cyclic voltammetry of ΔomcB, ΔomcE, ΔomcST, and ΔpilA biofilms
As with the wild type biofilms, CVs recorded at a moderately slow scan rate (0.010 V s−1) for ΔomcB, ΔomcE, ΔomcST, and ΔpilA mutant biofilms (Fig. 3) can be qualitatively fitted to eqn (6) taking into account the above described hysteresis and emergence of peaks which are more pronounced at faster scan rates (Fig. 6). The conclusions drawn from Fig. 3 about the wild type biofilm therefore apply to these mutant biofilms, as well; they are conductive, rapidly exchange electrons with electrodes, and are limited in current generation by step 1. There are significant differences, however, among E0′ values of omcB (+0.090 V) and ΔpilA (−0.22 V) compared to WT G. sulfurreducens (−0.15 V), indicating that OmcB and pili are important in the heterogeneous ET reaction (step 4). In the case of ΔpilA, E0′ is shifted significantly negative (Fig. 3E). As depicted in Fig. 5, this increases potential energy of electrons transferred to the anode, possibly decreasing the metabolic benefit to this mutant, since E0′ of ET mediators involved in steps 2 and 3 (if different from ET mediators involved in step 4) may also need to shift negative in order to enable homogenous ET. The ΔpilA biofilm is, however, conductive (as evidenced by the sigmoid-shape of its 0.010 V s−1 CV compared to ΔomcZ described below), but thin compared to the WT G. sulfurreducens biofilm (6 vs. 20 µm). The maximum catalytic current is ca. 50% that of the WT biofilm, or ca. 1.5 fold higher when normalized by thickness. A decreased metabolic benefit may be consistent with the necessity to produce more current per individual cell for viability. These results suggest that pili may not be directly involved in the homogenous ET (step 3), owing to conductivity of the ΔpilA biofilm, but that pili may play a structural role in formation of thick biofilms and in localization of extracellularc-type cytochromes,67 contributing to step 4 (hence causing the shift in E0′).
Unlike ΔpilA, E0′ of the ΔomcB biofilm is shifted significantly positive, to +0.09 V vs.SHE (Fig. 3B). As depicted in Fig. 5, this could decrease potential energy of electrons transferred to the anode. This shift in formal potential indicates that OmcB is most likely the mediator responsible for heterogeneous ET (step 4) in WT G. sulfurreducens. This outcome is supported by the results of Nevin et al.,36 who determined that OmcB is over expressed in thick high-current producing biofilms, and by Franks et al.,68 demonstrating that this induction is specifically localized at the innermost layer (cells closest to the anode surface) of the biofilm. Since the ΔomcB biofilm achieves the same growth rate and maximum catalytic current as the WT biofilm, and does not require additional time to adapt, we contend that the ΔomcB mutant likely utilizes the same homogeneous ET mediator in step 3 as WT, and an alternative ET mediator in step 4, present a priori in WT G. sulfurreducens, with a much more positive E0′ that is not viable for Fe(III) oxide reduction.26
Unlike ΔomcB, the ΔomcE and ΔomcST (Fig. 3C and D) exhibit E0′ values (−0.13 V vs.SHE) relatively similar to E0′ of WT G. sulfurreducens. Both exhibit the same growth rate and maximum catalytic current as WTG. sulfurreducens (Fig. 1), but ΔomcST undergoes an extended lag phase before producing current (Fig. 1). These results suggest that OmcE is not directly involved in step 4, in spite of being necessary for Fe(III) oxide reduction.18 In contrast, OmcS appears to be involved in steps 2 and/or 3 as indicated by impaired Fe(III) oxide reduction by ΔomcST18 and by the extended lag-phase required for anode reduction (Fig. 1). We contend that during the lag phase an adaptation occurs resulting in expression of an alternative mediator not involved in step 4. (OmcT was not been evaluated separately since its abundance on the surface of WT cells is negligible and Fe(III) oxide reduction can be restored in ΔomcST by complementation with omcS alone, but not with omcT.5)
CVs of ΔomcZ (Fig. 8 recorded at maximum growth current = 0.25 mA) are markedly different from those of WT G. sulfurreducens and the other mutant strains. There is a pronounced resistive dependency (linear i–v feature) superimposed onto the sigmoid dependency described above. Such an i–v dependency is often observed for electrode-bound redox enzymes (non-diffusing). It occurs if the enzyme exchanges electrons directly with an electrode surface (heterogeneous ET) without relying on ET mediators, there is a distribution in the rate of heterogeneous ET due to a distribution among individual enzymes in orientation to electrode surface, and if a substantial portion of the enzyme population possesses relatively slow (i.e., resistive) heterogeneous ET rates compared to the scan rate.69 Two strategies for analyzing the ΔomcZ CVs were evaluated. In the first (Fig. 8A), it was assumed that all microbes comprising the biofilm encountered resistive extracellular ET pathways, either due to step 3 or 4 being slow. The experimental current was roughly fit to eqn (6), assuming E0′ = −0.24 V vs.SHE and id = 0.19 mA; then resistance was added in series to suppress this current and better fit the experimental data. Here id was chosen to match the inflection observed in the experimental data at ca. 0.0 V vs.SHE, once resistance was added. This approach to fitting the experimental data requires a very negative E0′, regardless of the resistance used. In the second approach (Fig. 8B) we assumed a two-component biofilm comprised of a population of microbes with relatively conductive extracellular ET pathways to the anode (presumably those in direct contact with the anode) and a population of microbes with resistive extracellular ET pathways to the anode (presumably not in direct contact with the anode). In this approach the experimental data was first fit to eqn (6), assuming E0′ = −0.15 V vs.SHE and id = 0.07 mA, and then resistance added in parallel to augment this current and better fit the experimental data. Here, id was also chosen to match the inflection observed in the experimental data at ca. 0.0 V vs.SHE, once resistance was added to yield a unique solution for E0′ (−0.150 V vs.SHE). This value for E0′ is consistent with E0′ exhibited by this biofilm at fast scan rates (Fig. 4F), which can be approximated by averaging the potentials of the anodic and cathodic peaks (−0.145 ± 0.01 V vs.SHE, at 0.10 V s−1) and better fits the current at E > 0.2 V vs.SHE. This suggests that the two-component biofilm hypothesis more accurately describes the biofilm of the OmcZ-deficient mutant, in which id (0.07 mA) is attributed to current generation by microbes with more conductive extracellular ET pathways not affected by deletion of omcZ since E0′ is the same as for WT. Deletion of omcZ, therefore, appears to significantly impair the rate of step 3 for a significant portion of the microbes in the biofilm indicating its potential role in mediating the homogenous ET reaction. The anodic and cathodic peaks observed at faster scan rates (Fig. 4F) would therefore be attributed to reduction and oxidation of mediator contributing to step 1 for the microbes with the conductive extracellular ET pathways.
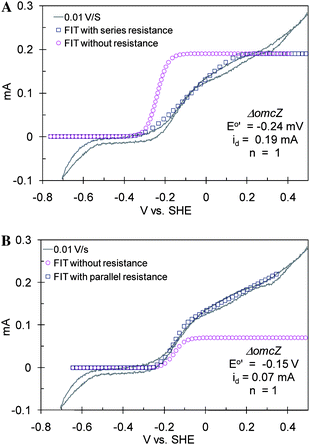 |
| | Fig. 8 CV recorded at 0.01 V s−1 from 0.45 V to −0.7 V and back to 0.45 V vs.SHE of a ΔomcZ biofilm, fitted as (A): uniform biofilm in which all microbes encounter resistive ET paths to the electrode surface and (B): 2-component biofilm in which one component encounters conductive ET paths, the other resistive ET paths. | |
Conclusion
The CV of the electrode-bound biofilm of WT Geobacter sulfurreducens depicted here is remarkably similar to that of electrode-bound non-diffusing redox enzymes developed by Heller et al.52,65. Based on this similarity, we propose a multi-step reaction scheme for extracellular ET from individual microorganisms comprising the biofilm to the underlying anode surface. We interpreted the wild type CV based on this model, and compared it to CV of anode-bound biofilms of mutant strains deficient in various c-type cytochromes or the PilA protein. Our results indicate that WT G. sulfurreducens forms a conductive network of bound ET mediators that most likely utilizes OmcZ to transfer electrons through the biofilm and OmcB to transfer electrons across the electrode/biofilm interface; that pili are important in both reactions, that OmcS and T are of secondary importance to the former, and that OmcE is not involved in extracellular ET during anode reduction in spite of being necessary for Fe(III) oxide reduction. In the case of Heller's electrode immobilized redox enzymes,52,65 co-immobilized organometallic complex's that are covalently attached within a porous polymer matrix by flexible linkers transfer electrons from the enzymes (analogous to step 2), among themselves (analogous to step 3), and with the electrode surface (analogous to step 4) through a series of thermally activated collisions. In the case of G. sulfurreducens, homogenous ET may be occurring between individual OmcZ proteins along a cell's outer membrane and by cell-to-cell contact toward the electrode surface where OmcB on the innermost microbes to the anode surface mediate the heterogeneous electron transfer reaction. By analogy to Heller's electrode immobilized enzymes, homogeneous electron transfer from individual microbes comprising the biofilm may be driven thermodynamically by a concentration gradient of reduced mediator in which reduced mediator is generated by the microbes and consumed by the anode.70,71 Our analysis also indicates that the magnitude of catalytic current is limited by rate of acetate uptake by the microbes. Furthermore, the homogeneous electron transfer process (step 3), when accelerated during fast scan CV, becomes limited by diffusion of protons in the biofilm generated by oxidation of acetate (step 1), which serve as charge compensating counter ions in the homogenous ET. This analysis provides a useful model to advance strategies to increase the power density of microbial fuel cells.
Acknowledgements
We are grateful to helpful discussions with Professor Daniel Bond. This research was supported by the Office of Naval Research Award No. N00014–07–1–0996 and N00014–07–WX20515 and by Office of Science (BER), U. S. Department of Energy, Cooperative Agreement No. DE–FC02–02ER63446.
References
- B. E. Logan, B. Hamelers, R. Rozendal, U. Schröder, J. Keller, S. Freguia, P. Alterman, W. Verstraete and K. Rabaey, Environ. Sci. Technol., 2006, 40, 5181 CrossRef CAS.
- D. R. Lovley, Nat. Rev. Microbiol., 2006, 4, 497–508 Search PubMed.
- L. M. Tender, S. A. Gray, E. Groveman, D. A. Lowy, P. Kauffman, J. Melhado, R. C. Tyce, D. Flynn, R. Petrecca and J. Dobarro, J. Power Sources, 2008, 179, 571–575 CrossRef CAS.
- A. K. Shukla, P. Suresh, S. Berchmans and A. Rahjendran, Curr. Sci., 2004, 87, 455–468 CAS.
- Z. Du, H. Li and T. Gu, Biotechnol. Adv., 2007, 25, 464–482 CrossRef CAS.
- D. R. Bond, D. E. Holmes, L. M. Tender and D. R. Lovley, Science, 2002, 295, 483–5 CrossRef CAS.
- L. M. Tender, C. E. Reimers, H. A. Stecher, D. E. Holmes, D. R. Bond, D. A. Lowy, K. Pilobello, S. J. Fertig and D. R. Lovley, Nat. Biotechnol., 2002, 20, 821–825 CAS.
- D. E. Holmes, D. R. Bond, R. A. O'Neil, C. E. Reimers, L. M. Tender and D. R. Lovley, Microb. Ecol., 2004, 48, 178–190 CrossRef CAS.
- S. Jung and J. M. Regan, Appl. Microbiol. Biotechnol., 2007, 77, 393–402 CrossRef CAS.
- H. S. Lee, P. Parameswaran, A. Kato-Marcus, C. I. Torres and B. E. Rittmann, Water Res., 2008, 42, 1501–1510 CrossRef CAS.
- S. Ishii, K. Wantanabe, S. Yabuki, B. E. Logan and Y. Sekiguchi, Appl. Environ. Microbiol., 2008 Search PubMed , in press.
- Y. Liu, F. Harnisch, K. Fricke, R. Sietmann and U. Schröder, Biosens. Bioelectron., 2008 Search PubMed , in press.
- K. Fricke, F. Harnisch and U. Schröder, Energy Environ. Sci., 2008, 1, 144–147 RSC.
- D. R. Bond and D. R. Lovley, Appl. Environ. Microbiol., 2003, 69, 1548–1555 CrossRef CAS.
- K. P. Nevin, S. F. Covalla, J. P. Johnson, T. L. Woodard, H. Jia, M. Zhang and D. R. Lovley, Environ. Microbiol., 2008 Search PubMed , in press.
- D. E. Holmes, S. K. Chaudhuri, K. P. Nevin, T. Mehta, B. A. Methe, A. Liu, J. E. Ward, T. L. Woodard, J. Webster and D. R. Lovley, Environ. Microbiol., 2006, 8, 1805–1815 CrossRef CAS.
- G. Reguera, K. D. McCarthy, T. Mehta, J. S. Nicoll, M. T. Tuominen and D. R. Lovley, Nature, 2005, 435, 1098–1101 CrossRef CAS.
- T. Mehta, M. V. Coppi, S. E. Childers and D. R. Lovley, Appl. Environ. Microbiol., 2005, 71, 8634–8641 CrossRef CAS.
- E. Afkar, G. Reguera, M. Schiffer and D. R. Lovley, BMC Microbiol., 2005, 5, 41 CrossRef.
- J. E. Butler, F. Kaufmann, M. V. Coppi, C. Nunez and D. R. Lovley, J. Bacteriol., 2004, 186, 4042–4045 CrossRef CAS.
- A. Esteve-Núñez, C. Núñez and D. R. Lovley, J. Bacteriol., 2004, 186, 2897–2899 CrossRef CAS.
- A. Esteve-Nunez, J. Sosnik, P. Visconti and D. R. Lovley, Environ. Microbiol., 2008, 10, 497–505 CrossRef CAS.
- K. B. Gregory, D. R. Bond and D. R. Lovley, Environ. Microbiol., 2004, 6, 596–604 CrossRef CAS.
- B. C. Kim, D. Leang, Y. R. Ding, R. H. Glaven, M. V. Coppi and D. R. Lovley, J. Bacteriol., 2005, 187, 4505–13 CrossRef CAS.
- B. C. Kim, X. L. Qian, C. Leang, M. V. Coppi and D. R. Lovley, J. Bacteriol., 2006, 188, 3138–3142 CrossRef CAS.
- C. Leang, M. V. Coppi and D. R. Lovley, J. Bacteriol., 2003, 185, 2096–2103 CrossRef CAS.
- C. Leang and D. R. Lovley, Microbiology, 2005, 151, 1761–1767 CrossRef CAS.
- C. Leang, L. A. Adams, K. J. Chin, K. P. Nevin, K. B. A. Methé, J. Webster, M. L. Sharma and D. R. Lovley, J. Bacteriol., 2005, 187, 5918–5926 CrossRef CAS.
- J. R. Lloyd, C. Leang, A. L. Hodeges-Myerson, M. V. Coppi, S. Cuifo, B. Methe, S. J. Sandler and D. R. Lovley, Biochem. J., 2003, 369, 153–161 CrossRef CAS.
- T. Mehta, S. E. Childers, R. Glaven, D. R. Lovley and T. Mester, Microbiology, 2006, 152, 2257–64 CrossRef CAS.
- X. Qian, G. Reguera, T. Mester and D. R. Lovley, FEMS Microbiol. Lett., 2007, 277, 21–27 CrossRef CAS.
- G. Reguera, K. P. Nevin, J. S. Nicoll, S. F. Covalla, T. L. Woodard and D. R. Lovley, Appl. Environ. Microbiol., 2006, 72, 7345–7348 CrossRef CAS.
- G. Reguera, R. B. Pollina, J. S. Nicoll and D. R. Lovley, J. Bacteriol., 2007, 189, 2125–2127 CAS.
- H. Richter, K. D. McCarthy, K. P. Nevin, J. P. Johnson, V. M. Rotello and D. R. Lovley, Langmuir, 2008, 24, 4376–4379 CrossRef CAS.
- E. S. Shelobolina, M. V. Coppi, A. A. Korenevsky, L. N. DiDonato, S. A. Sullivan, H. Konishi, H. Xu, C. Leang, J. E. Butler, B. C. Kim and D. R. Lovley, BMC Microbiol., 2007, 7, 16 CrossRef.
- K. P. Nevin, B. C. Kim, R. H. Glaven, J. P. Johnson, T. L. Woodard, B. A. Methé, R. J. DiDonato Jr, S. F. Covalla, A. E. Franks, A. Liu and D. R. Lovley, J. Bacteriol., 2008 Search PubMed , submitted.
-
B. C. Kim, K. P. Nevin and D. R. Lovley, ASM General Meeting, 2008, Poster Q-386 Search PubMed.
- S. Srikanth, E. Marsili, M. C. Flickinger and D. R. Bond, Biotechnol. Bioeng., 2007, 99, 1065–1073.
- E. Marsili, D. B. Baron, I. D. Shikhare, C. Coursolle, J. A. Gralnick and D. R. Bond, Proc. Natl. Acad. Sci. U. S. A., 2008, 105, 3968–3973 CrossRef CAS.
- M. Lanthier, K. B. Gregory and D. R. Lovley, FEMS Microbiol. Lett., 2007, 278, 29–35.
- D. P. Lies, M. E. Hernandez, A. Kappler, R. E. Mielke, J. A. Gralnick and D. K. Newman, Appl. Environ. Microbiol., 2005, 71, 4414–4426 CrossRef CAS.
- A. Price-Whelan, L. E. P. Dietrich and D. K. Newman, J. Bacteriol., 2007, 189, 6372–6381 CrossRef CAS.
- S. S. Ruebush, S. Brantley and M. Tien, Appl. Environ. Microbiol., 2006, 72, 2925–2935 CrossRef CAS.
- K. M. Rosso, J. M. Zachara, J. K. Fredrickson, Y. A. Gorby and S. C. Smith, Geochim. Cosmochim. Acta, 2003, 67, 1081–1087 CrossRef CAS.
- K. P. Nevin and D. R. Lovley, Appl. Environ. Microbiol., 2000, 66, 2248–2251 CrossRef CAS.
- C. I. Torres, A. Kato Marcus and B. E. Rittmann, Biotechnol. Bioeng., 2008, 100, 872–881 CrossRef.
- F. Caccavo, D. J. Lonergan, D. R. Lovley, M. Davis, J. F. Stolz and M. J. McInerney, Appl. Environ. Microbiol., 1994, 60, 3752–3759 CAS.
- M. V. Coppi, C. Leang, S. J. Sandler and D. R. Lovley, Appl. Environ. Microbiol., 2001, 67, 3180–3187 CrossRef CAS.
- D. R. Lovley and E. J. P. Phillips, Appl. Environ. Microbiol., 1988, 54, 1472–1480 CAS.
- A. M. Bond, K. B. Oldham and G. A. Snook, Anal. Chem., 2000, 72, 3492–3496 CrossRef CAS.
- J. M. Savéant and E. Vianello, Electrochim. Acta, 1965, 10(10), 905–920 CrossRef CAS.
- I. Katakis and A. Heller, Anal. Chem., 1992, 64, 1008–1013 CrossRef CAS.
- J. Hodak, R. Etchenique and E. J. Calvo, Langmuir, 1997, 13(10), 2708–2716 CrossRef CAS.
- M. E. Hernandez and D. K. Newman, Cell. Mol. Life Sci., 2001, 58, 1562–1571 CrossRef CAS.
- D. R. Bond and D. R. Lovley, Appl. Environ. Microbiol., 2005, 71, 2186–9 CrossRef CAS.
- D. K. Newman and R. A. Kolter, Nature, 2000, 405, 93–97.
- D. P. Lies, M. E. Hernandez, A. Kappler, R. E. Mielke, J. A. Gralnick and D. K. Newman, Appl. Environ. Microbiol., 2005, 71, 4414–4426 CrossRef CAS.
- H. V. Canstein, J. Ogawa, S. Shimizu and J. R. Lloyd, Appl. Environ. Microbiol., 2008, 74(3), 615–623.
- T. R. Brumleve and R. P. Buck, J. Electroanal. Chem., 1981, 126, 105–119.
- R. P. Buck and C. Mundt, Electrochim. Acta, 1999, 44(12), 1999–2018 CrossRef CAS.
-
A. J. Bard and L. R. Faulkner, Electrochemical Methods, John Wiley & Sons, Inc, 2nd edn, 2001 Search PubMed.
- K. B. Gregory and D. R. Lovley, Environ. Sci. Technol., 2005, 39, 8943–8947 CrossRef CAS.
- R. S. Nicholson and I. Shain, Anal. Chem., 1964, 36(4), 706–723 CrossRef CAS.
- R. J. Forster, D. A. Walsh, N. Mano, F. Mao and A. Heller, Langmuir, 2004, 20(3), 862–868 CrossRef CAS.
- S. Mudliar, S. Banerjee, A. Vaidya and S. Devotta, Bioresour. Technol., 2008, 99, 3468–3474 CrossRef CAS.
- H. Horn and E. Morgenroth, Chem. Eng. Sci., 2006, 61, 1347–1356 CrossRef CAS.
-
M. Izallalen, R. H. Glaven, T. Mester, K. P. Nevin, A. E. Franks and D. R. Lovley, ASM General Meeting, 2008, poster I-034 Search PubMed.
-
A. E. Franks, K. P. Nevin, A. L. Orloff, M. Izallalen, D. Keymeulen, D. K. Newman and D. R. Lovley, ASM General Meeting, 2008, poster Q-391 Search PubMed.
- C. Leéger and P. Bertrand, Chem. Rev., 2008, 108(7), 2379–2438 CrossRef CAS.
- F. B. Kaufman and M. B. Engler, J. Am. Chem. Soc., 1979, 101, 547 CrossRef CAS.
- F. B. Kaufman, A. M. Schroeder, E. M. Engler, S. R. Kramer and J. Q. Chambers, J. Am. Chem. Soc., 1980, 102, 483 CrossRef CAS.
Footnote |
| † Author contributions: H. J., H. R., K. P. N., D. R. L., and L. M. T. designed research; H. R. and H. J. performed research; H. R., D. A. L., and L. M. T. analyzed data; H. R., D. R. L., and L. M. T. wrote the paper. |
|
| This journal is © The Royal Society of Chemistry 2009 |
Click here to see how this site uses Cookies. View our privacy policy here.