Density functional theory simulations of complex hydride and carbon-based hydrogen storage materials†
S. A.
Shevlin
* and
Z. X.
Guo
*
Department of Chemistry, University College London, 20 Gordon St, London, United Kingdom WC1H 0AJ. E-mail: s.shevlin@ucl.ac.uk; z.x.guo@ucl.ac.uk
First published on 5th November 2008
Abstract
This critical review covers the mechanisms underlying density functional theory (DFT) simulations and their relevance in evaluating, developing and discovering new materials. It is intended to be of interest for both experimentalists and theorists in the expanding field of hydrogen storage. We focus on the most studied classes of materials, metal-hydride, -amide, and -borohydride mixtures, and bare and transition metal-doped carbon systems and the utility of DFT simulations for the pre-screening of thermally destabilised reaction paths (170 references).
 Stephen Shevlin | Dr Stephen Shevlin received an MSci from the University of Birmingham and a PhD from University College London. He has worked extensively in the field of electronic structure methods, performing research on novel dielectric materials, metal nanoclusters, and new hydrogen storage materials. He has been based at IBM Zurich Switzerland, Oak Ridge National Laboratory, and Queen Mary, University of London. Currently he is working with Xiao Guo at the Department of Chemistry, University College London. |
 Z. Xiao Guo | Z. Xiao Guo is a Professor of Materials and Chemistry at University College London (UCL). He received a PhD from the University of Manchester, and then worked as a research scientist at the Universities of Strathclyde and Oxford. He was a Lecturer and then a Professor at Queen Mary, University of London before joining UCL. He has contributed over 130 journal publications and a similar number of conference presentations. He has received the Beilby Medal from the Society of Chemical Industry, the Royal Society of Chemistry, and the Institute of Minerals, Metals and Materials. He is on the editorial boards of several international journals. |
1. Introduction
One of the major issues in the 21st century is the generation and utilization of non-polluting energy. At present, the consumption of energy is intimately linked to CO2 emission, a major and increasingly prevalent artificial contributor to climate change. Several solutions can ameliorate this: including increases in efficiency, generation by renewable sources, and increasing usage of nuclear power. However fossil fuels with a high energy density will still be dominant in the near term. If CO2 emission is to be significantly reduced there should be a switchover to a clean alternative, of which hydrogen (H2) is the preferred candidate.1,2Hydrogen however is difficult to store safely at low cost, light weight, and low volume. Thus storage in solid materials that have fast H2 release and adsorption kinetics at 85 °C (a typical operating temperature) is desired.1–4Simulations can aid in the understanding and discovery of hydrogen storage materials. In this review, we will briefly outline the fundamentals underpinning density functional theory (DFT), a commonly used technique for modelling molecular and solid systems as it is faster than wavefunction-based ab initio methods, albeit at the cost of reduced accuracy. We will then discuss how this technique may be applied to calculate the following quantities of interest: hydrogen binding energies, enthalpies and free energies of formation, diffusion and reaction pathways, activation barriers, and transition states. Finally, we will review the literature on simulations of two important classes of hydrogen storage materials, metal hydride mixtures and doped carbon systems.
2. Theoretical background
2.1 Density functional theory (DFT)
The properties of a material are determined by the behaviour of the electrons that comprise the bonds of the system in question. In DFT the ground state of an interacting electron gas is mapped onto the ground state of a non-interacting electron gas which experiences an effective potential, in contrast to other techniques such as Hartree–Fock which solve for the full set of wavefunctions in the Schrödinger equation. This mapping in principle gives the exact ground-state properties (such as cohesive energy, lattice parameters and phonon spectra). The Hamiltonian that describes the electron gas density iswhere
![[T with combining circumflex]](https://www.rsc.org/images/entities/i_char_0054_0302.gif) and
and ![[V with combining circumflex]](https://www.rsc.org/images/entities/i_char_0056_0302.gif) ee are the kinetic and electron–electron interaction operators, respectively and Vext is the external potential. The two basic theorems of DFT are
ee are the kinetic and electron–electron interaction operators, respectively and Vext is the external potential. The two basic theorems of DFT are
1. There exists a functional F[n] of the electronic density n that represents the ground state energy EGS.
2. The only density which gives an energy equal to the energy of the ground state is the electronic density of the ground state nGS, with all other densities giving higher energies
| ∫drVext(r)nGS(r) + F[nGS] ≡EGS |
We can use a separation of the Hamiltonian first devised by Kohn and Sham,5 wherein we can write the energy as a sum of functionals that depend on electron density
| E[n(r)] = T0[n(r)] + ∫dr n(r)[Vext(r) + ½Φ(r)] + EXC[n(r)] |
The exchange and correlation energies thus depend on the electronic density. As it is not known how to solve the n-body problem exactly we have no idea a priori how EXC[n] behaves. The oldest and simplest way of solving the variational equations is the local-density approximation (LDA).6 This assumes that the exchange–correlation potential for an electron is equal to the exchange–correlation potential of an electron in a uniform gas of interacting electrons, and can be inserted into the above equation as
| ELDAXC = ∫drn(r)εXC[n(r)] |
Historically the GGAs originated in the presumption that as real systems are not homogeneous then improvements to the LDA can be made by treating the electron gas as slowly varying and expanding to second order, the gradient expansion approximation (GEA)13
| UGEA[n(r)] = ∫(a(n(r)) + b(n(r))|∇n(r)|2 + ⋯) |
| EGGAX = ∫d3r neunifx(n)FX(s(r)) |
| EGGAXC[n] = ∫d3r neunifx(n)FXC(rs,s) |
The Perdew, Burke and Enzerhof (PBE) GGA12 is a modification of this nonempirical functional that only satisfies conditions that are energetically relevant. For example, the exchange enhancement factor in the PBE is
leading to a much smaller and more transparent parameterisation.
The next rung in the ladder of increasing accuracy of density functionals are the meta-GGAs. As the LDA is a functional that depends only on n, and the GGAs are functionals that depend on n and ∇n, meta-GGAs are functionals that are often of the form15
| EMGGAXC[n] = ∫d3r εMGGAXC(n,∇n,∇2n,τ) |
which appear in the Taylor expansion of the exchange correlation hole and thus are implicit functionals of the density. Several meta-GGAs have been developed, but the only nonempirical functional is the TPSS functional of Tao, Perdew, Staroverov, and Scuseria.15
Higher rungs up the ladder of functionals would introduce more nonlocality. For example, it has been posited that the next rung up would be the so-called “hyper-GGA” functionals which would include exact exchange energy density.7 Currently there do not exist any nonempirical formulations of a hyper-GGA. “Hybrid” functionals, which admix a portion of exact Hartree–Fock exchange into the exchange–correlation functional,16,17 can be regarded as analogous functionals to the hyper-GGA. These tend to be the functionals of choice for the chemistry community and often are the most accurate functionals for calculations of barrier heights. However these functionals are optimised semi-empirically on a specific set of small molecules, therefore transferability to other systems may be constrained. Indeed for large molecules B3LYP performs less well than alternative functionals.18 A summary of all of these different types of functionals is illustrated in Fig. 1.
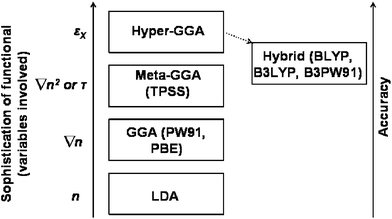 | ||
| Fig. 1 Schematic of relationship between commonly used exchange correlation functionals, increasing sophistication of treatment of exchange and correlation, and accuracy. Figure adapted from Fig. 1 of ref. 7. | ||
2.2 Relevant properties for hydrogen storage
Density functional theory can accurately determine energetics and structures, and on modern day parallel computers is able to simulate fairly large (few hundred atom) systems in a reasonable amount of time (of order days). It is thus the method of choice for most hydrogen storage simulations. Important quantities of interest for hydrogen storage are the strength of hydrogen binding (and the associated enthalpy of formation and plateau pressure for hydrogen release) and the kinetics of H2 release.The strength of H2 binding to the material is of importance for hydrogen storage applications. This is defined as
| EBind(H2) = ETot(X− H2) + ETot(H2) −ETot(X) |
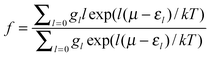
where εl is the zero-point corrected binding energy, l is the number of adsorbed H2 molecules, k is Boltzmann’s constant, gl is the multiplicity of a configuration for a given l, and μ is the chemical potential of H2 in the gas phase at temperature T.21 This allows a direct comparison of usable capacity under realistic operating conditions.
For smaller nanostructures, and for periodic solids with primitive unit cells of less than fifty atoms, it is computationally tractable to calculate phonon modes and thus the full enthalpy of formation for successive or complete dehydrogenation steps. The temperature dependent free energy of a solid can be written as22
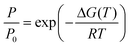
| G(T) = U(T) −TS(T) + PV≈U0 + Uvib(T) −TSvib(T) |
Plotting these pressures defines the van’t Hoff plot for decomposition.24–26 Ideally hydrogen release should occur at relatively high pressures, greater than 1 bar.
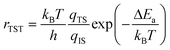
In addition to favourable thermodynamics it is desirable for hydrogen storage materials to possess quick charge and discharge kinetics, of the order of seconds. In order to determine the kinetics it is necessary to calculate the diffusion rate r through the harmonic transition state expression27
We have thus enumerated four types of quantity of interest for hydrogen storage. These can be divided into:
• Structures and electronic binding energies.
• Phonons, free energies, enthalpies of dehydrogenation and entropies.
• Transition states and activation barriers.
• Diffusion and rate constants.
Typically simulations focus on the first set of items. However, all four sets of information are of potential interest for hydrogen storage.
3. Solid hydride systems
One class of hydrogen storage systems that are of particular interest are those that bind hydrogen in chemical form, e.g.metal hydrides, amides, alanates, and borohydrides. In this section we will report on the current status of theoretical simulations on representative examples of these materials. We will also discuss the concept of thermodynamic destabilisation, an important concept for hydrides research, and computational efforts to explore new reaction paths utilizing this concept.3.1 Magnesium hydride (MgH2)
Magnesium hydride (MgH2) has long been considered as a promising material for hydrogen storage due to substantial thermal stability, low cost, reversibility of the reaction MgH2↔ Mg + H2, and significant gravimetric hydrogen storage capacity (7.6 wt%). However, due to the high desorption temperature (between 300 to 400 °C), a low plateau pressure of 10 Pa (or 10−4 bar) at ambient, and relatively slow absorption/desorption kinetics,35 substantial effort, including simulation work, has been devoted to improving this material for hydrogen storage applications.At room temperature, rutile MgH2 has a tetragonal unit cell with lattice constants a = 4.518 and c = 3.021(c) Å, see Fig. 2.36 This results in the (110) surface having the lowest surface energy and the lowest hydrogen binding energy, which DFT-PBE and DFT-PW91 finds to be of magnitude 1.2 to 1.5 eV/H2.37–39 Both experimentally40 and theoretically41 the stability of MgH2 can be affected by particle size, with decreasing particle size decreasing the stability of the hydride. However, in order to get a significant decrease in their thermodynamic stability and hence desorption temperature it is necessary to reduce the grain size to less than 1.3 nm,41 unlikely to be achievable using mechanical milling. In principle, alternative metastable MgH2 phases with lower energies of formation, for example an anatase structure with a formation energy of 58.03 kJ mol−1 (0.60 eV) compared with the rutile formation energy of 76.00 kJ mol−1 (0.79 eV) as found in DFT-PBE simulations,42 may be utilized, but such metastable phases have not yet been identified in practice. Therefore most approaches to reducing the desorption temperature of MgH2 have focused on dopants that alter the binding between the Mg and H species. Pozzo et al. have recently published a paper comparing the accuracy of DFT simulations of the formation enthalpy of MgH2 with quantum Monte Carlo simulations, a very accurate but very computationally expensive technique.43 They find that the GGA functionals give an enthalpy of formation that is in worse agreement with experiment than the LDA. Both types of exchange correlation functional however give enthalpies of formation within ∼0.3 eV f.u.−1 (formula unit) of experiment.
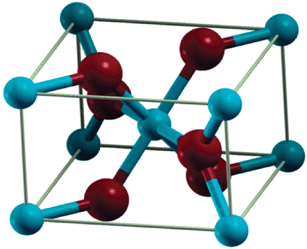 | ||
| Fig. 2 Crystal structure of MgH2, where the Mg and H atoms are represented by light blue and dark red, respectively. Figure taken with permission from ref. 43. Copyright (2008) by the American Physical Society (URL: http://link.aps.org/abstract/PRB/v77/e104103). | ||
The differing electronegativities of Mg and H atoms have significant implications for the binding of MgH2. In principle, Mg should donate charge density to the H atoms forming an ionic bond, see Fig. 3. Simulations indicate that this is partially the case,44,45 with the Mg atoms having a positive charge of +1.95e. However the H atoms do not accrue a corresponding charge of −1e, instead there is a significant amount of electronic density in the intermediate region,44 indicative of a partially covalent bond in agreement with experiment.46 Nevertheless this suggests that to weaken the Mg–H bonding one should decrease the ionic interaction. Calculations with the PW91 functional on the effects of vacancies reveals that the hydrogen removal energies are strongly reduced with respect to the bulk (0.73 eV/H2 compared to the value of 2.90 eV/H2 for bulk MgH2). However, with respect to dopant inclusion their formation energies are much larger and thus are less likely to form.47 DFT-PBE simulations show that vacancies have small activation energies for self-diffusion from the surface to the bulk (0.45 to 0.70 eV), much smaller than the energies for hydrogen release (1.78 to 2.80 eV/H2) from the surface, implying that surface desorption is more likely to be the rate limiting step than vacancy diffusion.48
 | ||
| Fig. 3 Density difference plot (Δρ = ρ(Mg48H96) −ρ(H) −ρ(Mg48H95)) for the bulk MgH2, where orange represents charge density accumulation and blue represents charge density depletion. Mg atoms are in green, H atoms in purple. Figure taken from ref. 38. | ||
Metal dopant substitution in order to modify Mg–H bonding has also being investigated by DFT, e.g.Cu,38,42Nb,47Zr,49Y,49Fe,50Mn,50Ni,38,42,51Sc,49,51 and coupled LiAl codopants.52 In all these cases the addition of substitutional dopants reduces the ionicity of the Mg–H binding via the formation of covalent bonds with the dopant. In addition, substitutional dopants can aid hydrogenation of magnesium systems by strongly reducing the activation barrier for H2 splitting, the rate-limiting step for hydrogenation.31 In particular, Ti and V are good catalysts for barrierless H2 splitting (as found by the NEB method) on Mg(0001).53–55 Unfortunately they both trap hydrogen near the active site, inhibiting diffusion into the bulk. A DFT-PBE simulation comparing Ni and Ti substitutional dopants in Mg(0001) shows that, while Ni is worse for H2 splitting due to the presence of a small barrier of height 0.1 eV, it is much better for the subsequent diffusion of hydrogen into the bulk due to the dopant only weakly binding hydrogen compared to the much stronger binding evinced by Ti.56 Even with dopant addition MgH2 does not by itself meet the targets for hydrogen storage applications.40 Therefore other solid hydride materials are also being investigated, of which lithium amide (LiNH2) is of major interest.
3.2 Lithium amide (LiNH2)
Lithium amide (LiNH2) has had a long history as a reagent in synthetic organic chemistry,57,58 however recent research has highlighted its potential for hydrogen storage.59 Pure LiNH2 decomposes to lithium imide (Li2NH) and NH3 at temperatures above 573 K, however upon intermixing with lithium hydride (LiH), the mixture produces H2 at a temperature of 423 K to 723 K.59 The reaction is| LiNH2 + 2LiH ↔ Li2NH + LiH + H2↔ Li3N + 2H2 |
While LiNH2–LiH mixtures are of interest due to their high hydrogen content they unfortunately possess several problems that affect their applicability for room temperature applications. These include: (a) high dehydrogenation temperature of 473 K required for significant H2 plateau pressures, (b) slow release kinetics on the order of several days,62 and (c) lack of cyclability.66 This final issue is believed to be related to ammonia release from LiNH2 during reaction with LiH.63
The crystal structure of LiNH2 as found by powder neutron diffraction is a body centred tetragonal with lattice constants a = 5.034 and c = 10.256 Å, see Fig. 4.67 In order to clarify the thermodynamic properties of LiNH2 and Li2NH DFT simulations have played a significant role in determining the nature of the bonding in these systems,68–70 and it was unambiguously found that GGAs are substantially better in matching the experimental enthalpy of formation than the LDA (173.1 kJ mol−1 (experiment), 176 kJ mol−1 (GGA) and 245.8 kJ mol−1 (LDA) for each formula unit).68 Electronic structure analysis indicates that the Li atoms do not contribute to the occupied states but have a strong overlap with the unoccupied states, whereas the N and H atoms do have strong contributions to the occupied states. This implies that the Li atoms are ionized to form cations while the NH2groups form anions, in agreement with experiment.67 The bonding between N and H atoms was found to be covalent,69 which explains the short experimental N–H distances of 0.94 and 0.98 Å. Confirmation of the nature of the binding between Li and NH2 ions, and the covalent nature of the N–H bond is provided by a calculation of the electron localisation function (a method of determining electron pair probability in multielectron systems, and thus types of bonds)71 using the PW91 functional, see Fig. 5.68 The unequal bonding between N and H atoms (as found by simulations using the PBE functional) lead to two almost equivalent transient steps upon dehydrogenation: (1) [LiNH]− + H+, and (2) Li+ + [NH2]−.70
 | ||
| Fig. 4 Crystal structure of LiNH2. Red (large), green (middle), and blue (small) spheres represent Li, N, and H atoms, respectively. Figure taken with permission from ref. 69. Copyright (2005) by the American Physical Society (URL: http://link.aps.org/abstract/PRB/v71/e195109). | ||
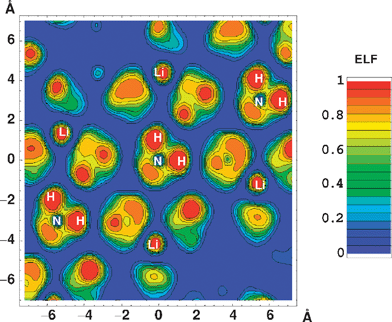 | ||
| Fig. 5 Electron localisation function calculated for LiNH2 in a plane containing an (NH2)− complex. Figure taken with permission from ref. 68. Copyright (2005) by the American Physical Society (URL: http://link.aps.org/abstract/PRB/v72/e125120). | ||
Several different crystal structures for Li2NH have been proposed, see Table 1. Balogh et al.77 showed using DFT-PW91 simulations that the disordered models experimentally found by Noritake et al.75 and Ohoyama et al.76 are equivalent to lower symmetry fully occupied orthorhombic and rhombohedral structures, respectively. Low temperature Pnma78 (found with DFT-PW91) and Pbca79 (found with DFT-PBE) structures have been predicted by simulations but have not been experimentally confirmed. Recent DFT-PBE simulations find that the lowest energy structure is the cell of symmetry Pbca, however in that work the authors themselves ascribe this to intrinsic errors in DFT and favour the cell of symmetry Ima2.72 We suggest that the reason for this conflict is due to the nature of atomic binding in the crystal. As for LiNH2, the bonding between Li and NH groups is ionic.73,77 However, there are significant quantum effects in the N–H binding.74 The hydrogens are delocalized and thus able to reside over several sites. Thus there is still considerable disagreement about the crystal structure of Li2NH.
![[3 with combining macron]](https://www.rsc.org/images/entities/char_0033_0304.gif)
![[4 with combining macron]](https://www.rsc.org/images/entities/char_0034_0304.gif) 3
3As the binding for both amide and imide systems is ionic an obvious method of decreasing the bond strength is to decrease the charge on the cations, e.g. replacing Li with Mg. The effects of Mg substitutional doping of Li for LiNH2 supercells were investigated using DFT-PW91 simulations by Jin et al.80 They found that the Mg dopant has a significant effect, reducing the Mulliken population overlap in the N–H moiety implying a weaker bond and thus lower temperature H2 release, in qualitative agreement with experiment.81 Jin et al. also investigated the electronic structures of several other doped lithium amides, finding that the system with the least population overlap in the N–H moiety is Al-doped LiNH2. DFT-PBE simulations by Zhang et al. on the effects of Mg and K substitution for Li find that the Mg dopant has a weaker ionic bond with the NH2group, but also strengthens the bonds of the surrounding Li+ ions with their associated [NH2]−groups, suggesting that the stronger Li–NH2 bonds are the key reason behind the efficacy of Mg doping.82 However the energy required to form the Mg dopant is quite substantial (∼1.8 eV) and therefore Zhang et al. suggest that P substitution of N may further reduce hydrogen binding energy. These calculations are of low concentration dopants, as of yet there have been no simulations of the higher concentration (Li,Mg)NH2 crystal structures, such as the recently determined orthorhombic Li2Mg(NH2)2 crystal.83 Despite controversy behind the reaction mechanism of the combined LiNH2 + LiH system, no theoretical research has been performed on the mobility of suggested species in the bulk to date, which we regard as an oversight.
3.3 Lithium borohydride (LiBH4)
Lithium borohydride (LiBH4) was first synthesized in 1940 and has a history in organic synthesis as a reducing agent. Recently, due to its large theoretical hydrogen storage capacity of ∼18.3 wt% it has become of interest for hydrogen storage applications. Experimentally, lithium borohydride reversibly desorbs hydrogen in two steps, following melting at 560 K| 2LiBH4→ 2LiBH + 3H2→ 2LiH + 2B + 3H2 |
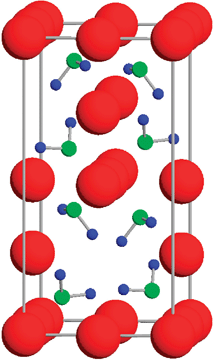
In comparison with other hydrogen storage materials such as MgH2 and LiNH2, the phase diagram of LiBH4 is more complicated, with a transition from one crystal structure to another occurring at 381 K.85 The room temperature crystal structure is uncontroversial, being an orthorhombic unit cell with the space groupPnma and lattice vectors a = 7.179 Å, b = 4.437 Å, and c = 6.803 Å, see Fig. 6.85,86 Simulations using both LDA and PW91 functionals find that at zero temperature PW91 more accurately reproduces the experimental lattice vectors.87
In contrast, there is a significant controversy over the crystal structure of the high temperature phase. Initial experimental results indicated that the high temperature phase is hexagonal with space groupP63mc and lattice vectors a = 4.276 Å, and c = 6.948 Å, see Fig. 6.85 However, simulation does not find that this is the case. Calculations of the hexagonal phase using the PBE functional find that the lowest energy structure does not match experiment, with the final theoretical crystal structure found to be unstable (e.g. possessing phonon modes with negative frequencies).88 Calculations of the Helmholtz free energy using the PW91 functional find that the preferred high temperature crystal structure is a cell analogous to LiAlH4 of symmetry P21/c and lattice vectors a = 7.267 Å, b = 7.174 Å, c = 7.683 Å and β = 148.52°, with the experimental hexagonal structure being vibrationally unstable.89 The stability of the P21/c phase over the P63mc phase using both LDA and PW91 functionals was also verified by Frankcombe et al.90 Clearly the description of the binding is significantly different for the PBE and PW91 functionals, with the latter finding that the P63mc is a local minimum on the potential energy surface while the former is not. Indeed, recent high quality X-ray diffraction results have reverified the initial hexagonal P63mc phase.91 Two principle factors have been suggested for the failure of DFT to accurately model the high temperature phase. Firstly, the problem of DFT in describing the high temperature structure of LiBH4 has been related to the anharmonicity of low frequency phonon modes corresponding to the rotation of molecular BH4 units.91,92 Secondly, the high temperature phase is found to exhibit significant disorder in the lattice positions of the hydrogens.93 This causes significant issues for simulating these materials in a periodic supercell, as in order to accurately model this orientationally disordered material would require the explicit construction of very large supercells so as to capture the full disorder of the system. This is prohibitively expensive to simulate and thus currently beyond the capability of DFT-based methods. In light of these issues the theoretically proposed Cc phase predicted to form at 520 K should be regarded as highly tentative in nature.88
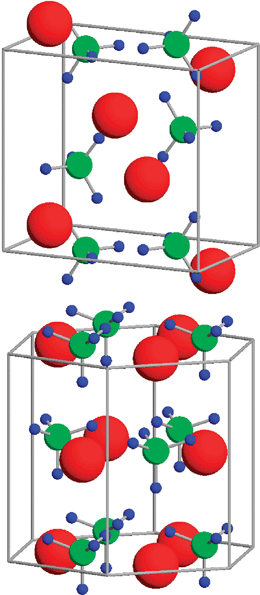 | ||
| Fig. 6 Crystal structures of LiBH4 in (a) orthorhombic room temperature phase, (b) high temperature hexagonal phase. Red represents Li, green B, and blue H, respectively. Figure taken with permission from ref. 88. Copyright (2004) by the American Physical Society (URL: http://link.aps.org/abstract/PRB/v69/e245120). | ||
The nature of the binding between Li and BH4 subunits is similar to that of LiNH2, with the binding between Li cations and BH4 anions ionic and the B–H binding covalent in nature.88,94 Charge density analysis indicates that the Li ion has a charge of +0.68e, while the B ion has a negative charge of −0.51e.95 This has significant implications for the stability of the BH4 subunit. Du et al. performed simulations using the BLYP functional on isolated BH4 ions, finding that for an ionic charge of −1 the complex is tetrahedral and stable, but with decreasing negative charge the tetrahedron distorts and loses stability, releasing H2 at a charge of −0.2e.96 Although experiment cannot readily identify H sublattice positions, simulations do indicate the presence of distorted BH4 subunits, with B–H bond variance ranging from 2%88 to 23%.90
The experimental enthalpy change in LiBH4 upon dehydrogenation to the hydride is 68.9 kJ mol−1.97 The LDA, PW91 and PBE exchange correlation functionals do not accurately reproduce this formation enthalpy, with zero point energy corrected enthalpies of 57 kJ mol−1 (LDA),90 59 kJ mol−1 (PW91),87 and 56 kJ mol−1 (PBE).88 The addition of finite temperature corrections within the quasiharmonic approximation does improve the calculated heat of formation, but not to chemical accuracy.87 A recently developed method whereby the anharmonic corrections to the free energy are estimated from fitting to DFT molecular dynamics calculations at high temperature promises to further improve the determination of thermodynamic properties.92
Simulations of different surfaces of the LiBH4 crystal indicate that the (010), (100) and (101) faces all have low surface energies of approximately 0.12 J m−2 and thus should easily be formed from ball milling.95 These faces have hydrogen atom vacancy formation energies of 180 to 200 kJ mol−1. We note that as the surface as a whole will be less polarised than the bulk then the BH4 units possess less negative charge, thus their hydrogen binding energies will also be significantly reduced with respect to the bulk. An alternative way to reduce the charge on the BH4 unit is to create a neutral Li vacancy. Du et al. performed DFT-PBE simulations on the (010) surface of LiBH4 to quantify the effects of Li vacancies on hydrogen storage properties.98 They found that the hydrogen removal energy from the ideal surface was 1.35 eV/H2, however in the presence of mono- and di-vacancies this is reduced to 0.08 eV/H2 and −0.45 eV/H2, respectively. Vacancies also strongly reduce the activation barriers for hydrogen release (from 3.64 eV for the ideal system to 0.23 eV for the di-vacancy), indicating that the creation of lithium vacancies is essential in order to increase kinetics.
In order to utilise LiBH4 as a hydrogen storage materials it is necessary to reduce the temperature for hydrogen release. Therefore it is of interest that there is an empirical correlation between increasing Pauling electronegativity of the cation and decreasing temperature of desorption for the borohydride compounds.99 Theoretical simulations on the effects of substitutional copper doping into lithium borohydride, where copper has a larger electronegativity than Li, to form (Li1−xCux)BH4, where x = 0.25, 0.5, 0.75, confirm this. It is found that the heat of formation decreases with increasing copper content meeting application requirements at x = 0.3.100 Surprisingly, partial substitution of the H atoms by F atoms in the BH4 anion has also been shown to reduce decomposition enthalpies.101 However, this “functional anion” concept has not been experimentally verified as of yet.
3.4 Thermodynamic destabilisation and design of reaction paths
As seen above, LiNH2 and LiBH4 are both materials that by themselves are not suitable hydrogen storage materials but in combination with other materials such as LiH or MgH2 become more suitable. These are examples of thermodynamic destabilization. The work of Reilly and Wiswall on alloys of magnesium and nickel, and magnesium and copper showed that it is possible to modify the thermodynamics of hydrogenation or dehydrogenation reactions by using additives to form compounds or alloys in the dehydrogenated state that are energetically favourable with respect to the products of the reaction without additives.102 This reduces the enthalpy and increases the equilibrium pressure. Chen et al. have shown that the addition of LiNH2 to LiH| LiNH2 + LiH ↔ Li2NH + H2 |
| 2LiBH4 + MgH2↔ MgB2 + 2LiH + 4H2 |
The full calculation of the enthalpy of formation and Gibbs free energy, as discussed in section 2.2, is computationally intensive and laborious. However approximations can be made to speed up calculations, allowing the possibility of rapid pre-screening of selected reactions. Instead of calculating the Gibbs free energy, the enthalpy of the reaction can be calculated instead, thus allowing an estimate of the temperature of the dehydrogenation reaction through ΔH = TΔS. The entropy change can be estimated to be of the order of the entropy of H2 gas at standard conditions; in practice this is estimated to be 95 ≤ΔS≤ 140 J K−1 mol−1.104 Therefore to achieve dehydrogenation temperatures between 323 and 423 K requires an enthalpy change of 30 ≤ΔH≤ 60 kJ mol−1. In addition, DFT typically has an error of approximately 10 kJ mol−1, therefore calculations should search for reactions with an enthalpy change of 15 ≤ΔH≤ 75 kJ mol−1.
This approach was initially used by Alapati et al. using DFT-PW91 to calculate the enthalpies of 49 compounds and the enthalpy change involved in 133 reactions based on these compounds.104 They found five promising reaction schemes. The Gibbs free energy of these desirable reactions was then calculated in order to determine the validity of the pre-screening approach.105 It was found that the enthalpy change ΔH for these reactions can be estimated using the formula
| ΔH≈ΔU(T = 0) + δE |
| Reaction | Wt% H2 | ΔU/kJ mol−1 H2 | Ref. |
|---|---|---|---|
| Mg(BH4)2→ MgB2 + 4H2 | 14.9 | 54.0 | 108 |
| Si + 4Mg(BH4)2→ Mg2Si + 2MgB4 + 16H2 | 13.2 | 52.7 | 108 |
| 7LiBH4 + MgH2→ 7LiH + MgB7 + 11.5H2 | 13.0 | 71.5–75.5 | 107 |
| 4LiBH4 + MgH2→ 4LiH + MgB4 + 7H2 | 12.5 | 69.2 | 107 |
| LiBH4 + C → LiBC + 2H2 | 12.0 | 45.1 | 107 |
| LiBH4 + 2LiNH2→ Li3BN2 + 4H2 | 11.9 | 24.3 | 107 |
| 6LiBH4 + CaH2→ 6LiH + CaB6 + 10H2 | 11.7 | 62.1 | 108 |
| 8LiBH4 + MgH2 + BN → 8LiH + MgB9N + 13H2 | 11.6 | 66.3 | 108 |
| MgH2 + 2LiBH4→ 2LiH + MgB2 + 4H2 | 11.6 | 66.8 | 107 |
| 3Si + MgSiN2 + 9Mg(BH4)2→ 4Mg2Si + 2MgB9N + 36H2 | 11.2 | 48.6 | 108 |
| BN + 4Mg(BH4)2→ 3MgH2 + MgB9N + 13H2 | 10.9 | 51.2 | 108 |
| NaH + 2Mg(BH4)2→ NaMgH3 + MgB4 + 7H2 | 10.67 | 53.2 | 108 |
| CaH2 + 1.5Si + 3Mg(BH4)2→ CaB6 + 1.5Mg2Si + 13H2 | 10.6 | 45.4 | 108 |
| 2C + Mg(BH4)2→ MgB2C2 + 4H2 | 10.3 | 43.1 | 108 |
| CaH2 + 3Mg(BH4)2→ 3MgH2 + CaB6 + 10H2 | 9.9 | 47.5 | 108 |
| 8LiBH4 + Mg2Si → 8LiH + Si + 2MgB4 + 12H2 | 9.6 | 74.0 | 108 |
| 2LiBH4 + ScH2→ 2LiH + ScB2 + 4H2 | 8.9 | 49.7 | 107 |
| 2LiBH4 + TiH2→ 2LiH + TiB2 + 4H2 | 8.6 | 22.2 | 107 |
| 2LiBH4 + NaMgH3→ 2LiH + NaH + MgB2 + 4H2 | 8.6 | 68.9 | 108 |
| MgH2 + 2LiBH4 + 2C → MgB2C2 + 2LiH + 4H2 | 8.6 | 55.3 | 107 |
| 3NaH + BN + 4Mg(BH4)2→ 3NaMgH3 + MgB9N + 13H2 | 8.4 | 48.8 | 108 |
| 2LiBH4 + VH2→ VB2 + 2LiH + 4H2 | 8.4 | 24.7 | 109 |
| LiNH2 + MgH2→ LiMgN + 2H2 | 8.2 | 31.9 | 107 |
| 2LiBH4 + Mg(NH2)2→ MgH2 + 2LiH + 2BN + 4H2 | 8.1 | 20.6 | 108 |
| ScH2 + Mg(BH4)2→ MgH2 + ScB2 + 4H2 | 8.0 | 37.5 | 108 |
| ScH2 + 2LiBH4 + C → ScB2C + 2LiH + 4H2 | 7.9 | 52.9 | 107 |
| MgH2→ Mg + H2 | 7.7 | 64.7 | 108 |
| 5B + Mg(BH4)2→ MgB7 + 4H2 | 7.5 | 41.5 | 108 |
| 2MgH2 + Mg(NH2)2→ Mg3N2 + 4H2 | 7.4 | 26.0 | 108 |
| CaH2 + 2LiBH4 + 2C → CaB2C2 + 2LiH + 4H2 | 7.4 | 59.7 | 107 |
| CaH2 + 3NaH + 3Mg(BH4)2→ 3NaMgH3 + CaB6 + 10H2 | 7.3 | 44.3 | 108 |
| 6LiBH4 + 2ScN → 6LiH + 2ScB2 + 2BN + 9H2 | 7.3 | 59.5 | 108 |
| 3Si + 8BN + 5Mg(BH4)2→ 2MgB9N + 3MgSiN2 + 20H2 | 7.3 | 47.0 | 108 |
| 4LiBH4 + K2MgH4→ 4LiH + MgB4 + 2KH + 7H2 | 7.3 | 74.8 | 108 |
| 4LiH + 3Mg(NH2)2 + 2C → 2Li2CN2 + Mg3N2 + 8H2 | 7.2 | 47.8 | 108 |
| 3LiNH2 + 2LiH + Si → Li5N3Si + 4H2 | 7.2 | 34.2/23.3a | 107 |
| 3Ca(AlH4)2 + 4LiH → 4AlLi + Al2Ca + 2CaH2 + 12H2 | 7.2 | 31.8 | 107 |
| 6LiBH4 + 2TiN → 6LiH + 2TiB2 + 2BN + 9H2 | 7.1 | 35.9 | 108 |
| 2LiNH2 + C → Li2CN2 + 2H2 | 7.0 | 31.4 | 107 |
| ScH2 + 2LiBH4 + 2C → ScB2C2 + 2LiH + 4H2 | 7.0 | 52.4 | 107 |
| Ca(BH4)2 + ScH2→ CaH2 + ScB2 + 4H2 | 6.9 | 44.8 | 109 |
| Ca(AlH4)2 + 2LiH → 2AlLi + CaH2 + 4H2 | 6.9 | 33.3 | 107 |
| Al + MgB9N + 2.5Mg(BH4)2→ AlN + 3.5MgB4 + 10H2 | 6.8 | 53.6 | 108 |
| 2LiBH4 + MgB2→ 2LiH + MgB4 + 3H2 | 6.8 | 72.5 | 108 |
| MgB7 + 1.5Mg(BH4)2→ 2.5MgB4 + 6H2 | 6.7 | 50.2 | 108 |
| 12LiH + 3Mg(NH2)2 + 4BN → 4Li3BN2 + Mg3N2 + 12H2 | 6.7 | 54.2 | 108 |
| 3Ca(AlH4)2 + 2Si → 2Al2Ca + Al2CaSi2 + 12H2 | 6.7 | 24.1 | 107 |
| 3Ca(AlH4)2 + 2Si → 4Al + Al2Ca3Si2 + 12H2 | 6.7 | 28.4 | 107 |
| 6Ca(AlH4)2 + 17MgH2→ Al12Mg17 + 6CaH2 + 35H2 | 6.7 | 35.4 | 107 |
| Ca(BH4)2 + TiH2→ CaH2 + TiB2 + 4H2 | 6.7 | 17.4 | 109 |
| K2MgH4 + 2Mg(BH4)2→ MgB4 + 2KMgH3 + 7H2 | 6.6 | 51.2 | 108 |
| Ca(BH4)2 + VH2→ CaH2 + VB2 + 4H2 | 6.6 | 20.8 | 109 |
| 28LiH + 9Mg(NH2)2 + 4VN → 4Li7N4V + 3Mg3N2 + 32H2 | 6.5 | 47.5 | 108 |
| 2ScN + 3Mg(BH4)2→ 3MgH2 + 2ScB2 + 2BN + 9H2 | 6.5 | 43.1 | 108 |
| NaH + ScH2 + Mg(BH4)2→ NaMgH3 + ScB2 + 4H2 | 6.5 | 34.8 | 108 |
General thermodynamic guidelines have been developed from density functional theory simulations to aid in the prediction of destabilisation reactions.109 In brief:
1. The enthalpy of the proposed destabilization reaction must be less than the decomposition enthalpies of the individual reactant phases.
2. If the proposed reaction involves a reactant that can adsorb hydrogen (such as an elemental metal), the formation enthalpy of the corresponding hydride cannot be greater in magnitude than the enthalpy of the destabilized reaction.
3. In general, it is not possible to tune the thermodynamics of destabilized reactions by adjusting the molar fractions of the reactants. There is only one stoichiometry corresponding to a single step reaction with the lowest possible enthalpy; all other stoichiometries will release H2 in multistep reactions, where the initial reaction is given by the lowest-enthalpy reaction.
The rapid computational pre-screening of reactions that lead to thermodynamic destabilization is of immense scientific interest. However we emphasize that this is only an initial determination of likely reaction chemistry and suitability for hydrogen storage applications. Firstly, neglecting all entropy contributions apart from that of H2 gas may strongly affect properties, e.g. vibrational entropy contributions alter the solubility of Al in Si by an order of magnitude.110 Secondly, as mentioned in the general guidelines above, reactions involving almost unstable compounds (e.g. Ca(AlH4)2) may lead to direct decomposition into different products.111 Thirdly, only thermodynamics are determined not kinetics. For example, Ca(AlH4)2 has only a ΔU of 14 kJ mol−1 but is kinetically stable for temperatures up to 473 K.107 Fourthly, thermodynamics of reactions can only be estimated for known crystal structures, if unknown crystal structures exist for possible intermediate compounds this will affect reaction enthalpies. Fifthly, errors in DFT of the order of 10 kJ mol−1 will lead to errors in the plateau pressure upon dehydrogenation of three orders of magnitude.107 Regardless, simulation of thermodynamic destabilization is an interesting concept that potentially may prove very fruitful for hydrogen storage research.
4. Carbon systems
Carbon systems (nanotubes, fullerenes, and nanoporous structures) are another group of widely-researched hydrogen storage materials.112 Initial interest was spurred by the early results of Dillon et al. who observed a hydrogen uptake between 5 and 10 wt% for single-walled nanotubes at low temperature (133 K) and very low pressures (0.04 MPa).113 This was a spectacular result, and along with other spectacular results for other carbon nanostructures114 indicated a promising future for hydrogen storage. Later experiments however revealed much more modest storage capacities of ∼1.55 wt% at 573 K and 0.01 MPa.115 This is due to the weak nature of the Van der Waals interaction between H2 and carbon. Simulation can play a significant role in understanding and providing insight into two types of carbon systems: graphite sheets which have a sheet structure with a repeating hexagonal motif, and single walled carbon nanotubes (CNTs) which can be envisaged as formed by the rolling of a single graphene sheet.4.1 Interaction of carbon systems with hydrogen
There have been many simulations to understand the hydrogen adsorption process on graphite systems so as to predict optimal structures, involving both empirical potentials,116–118 and quantum mechanical calculations.119–126Hydrogen atoms can bind to carbon nanostructures with a binding energy of magnitude 1 eV within the LDA approximation.127 However atomic adsorption is not energetically preferred to molecular adsorption, where DFT finds that molecular binding energy is of the order of 0.1 eV/H2,119,124–126 this is an overestimate with respect to experiment which finds a binding energy of 0.043 eV/H2.128 This is far too weak for applications. A recent calculation that uses highly accurate Møller–Plesset wavefunction-based techniques shows that optimised graphite plates may meet DOE targets if the interlayer distance of the graphite is increased to between 6 and 7 Å.129 No mechanism for enabling such a consistent layer separation has been developed however.Carbon nanotubes have also been investigated for hydrogen storage applications, as due to the curvature of the graphene sheets and varying metallic/semiconducting properties they are expected to present different chemical behaviour to flat graphene sheets. Indeed, the magnitude of the adsorption energy increases with decreasing tube diameter due to the mixing of sp2–sp3 rehybridisation induced by strong curvatures, so a tube of diameter 1.2 nm has a binding energy of 5.9 kJ mol−1/H2 (0.061 eV/H2) while a tube of diameter 0.8 nm has a binding energy of 8 to 9 kJ mol−1/H2 (0.0829 to 0.0933 eV/H2).130,131Hydrogen addition to the exterior of a SWNT will be in the form of physisorption with a binding energy of approximately 0.1 eV/H2, as there is a large barrier of approximately 3 eV in both DFT-LDA and DFT-PW91 simulations for H2 to dissociate into atomic hydrogen,127,132 with chirality not affecting binding energy.133 Small diameter nanotubes can sustain 100% coverage but nanotubes over 1 nm in diameter can sustain at best 80% coverage.134
DFT-B3LYP simulation shows that excessive atomic hydrogen adsorption can lead to the partial breakdown of tube structure, with a greater than 50% coverage on a (10,0) nanotube creating pores that will allow hydrogen access to the interior of the nanotube.135 We emphasize that without a source of readily available hydrogen atoms this particular set of behaviours is very unlikely to happen, as thermodynamically H2 prefers to adsorb in molecular form. However if the nanotubes are pretreated with an atomic hydrogen beam then a mixture of reversible chemisorption and physisorption interactions has been observed, with a storage capacity of 5.1 ± 1.2 wt%.136
Simulation tends to model nanotubes in isolation. However in reality carbon nanotubes tend to exist in bundles with multiple sites for hydrogen binding. These may be mechanically manipulated. DFT has been used to investigate the effects of deformation on reactivity, finding that reactivity increases with increasing bend angle.137 Simulations of the solid phase within the PW91 functional indicate that neighbouring carbon nanotubes under a compressive stress of 12.5% dissociates H2 present in a channel of the interior of the nanotube bundle, see Fig. 7.138 This process is reversible upon the release of pressure with an energy barrier of ∼2 eV. Such tuning of adsorption and storage properties are highly promising avenues for future experimental research, with such processes also changing the magnetic properties of the nanotube bundle.125
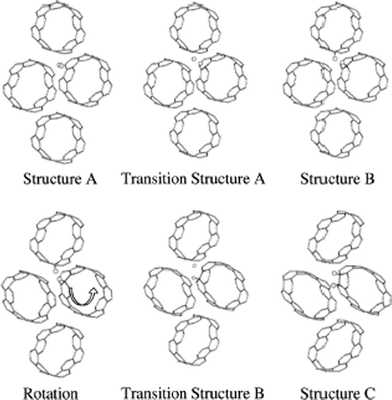 | ||
| Fig. 7 The structures and transition structures for the dissociative H2 chemisorption on an array of carbon nanotubes in a solid under high pressure. Three steps are shown: H2 adsorption and dissociation on a single CNT (A), deformation and displacement of a single H atom through transition state (TS) A so that it chemisorbs on an adjacent CNT (B), rotation of the initial CNT, and rehydrogenation of this CNT through TS B such that final product is a 1,2 addition structure. This causes a noticeable deformation of the CNT. Figure taken with permission from ref. 138. Copyright (2001) by the American Physical Society (URL: http://prola.aps.org/abstract/PRL/v87/i20/e205502). | ||
Although in general GGAs are better functionals than the LDA, an exception occurs for the interaction of H2 with carbon systems. Comparison of DFT with extremely accurate wavefunction-based methods (Møller–Plesset and diffusion Quantum Monte Carlo) finds that the LDA is more accurate.120,139 This is largely fortuitous and due to favourable error calculations. Recently a dispersion force corrected density functional theory has been introduced.140 In this treatment a dispersion energy term to represent the Van der Waals energy is added to the total energy of the system (ETot = EDFT + Edis) where
4.2 Interaction of alkali-metal doped carbon systems with hydrogen
By themselves carbon-based hydrogen storage materials will not meet DOE targets for hydrogen adsorption. This is due to the strength of the Van der Waals interaction between H2 and the carbon support. To strengthen the binding requires the addition of electrostatic interactions and/or orbital interactions.142 The positive quadrupole moment of H2 cannot be modified, therefore in order to increase adsorption energies one needs to charge the carbon system.143 In order to cause this charging, the carbon systems could be doped with highly electropositive Group I and II metal nanoparticles, facilitating charge transfer. Simulations show that the insertion of Li and Rb,144 Cs,145K,146 Ca and Sr,147 and Ni148 dopants induces a charge on the nanotubes. Alkali metal-doped systems in particular display marked increases in hydrogen storage capacities.149 Both classical Monte Carlo and DFT-LDA simulations show that Li+ ions act as acidic cores for hydrogen binding, see Fig. 8.150,151 The insertion of K or Cs has been measured to lead to an excess negative charge of −1e per 8 carbon atoms.145 Recent DFT-PW91 simulations indicate that Ca and Sr dopants can lead to a charge transfer of 2e per dopant atom to a C60fullerene.147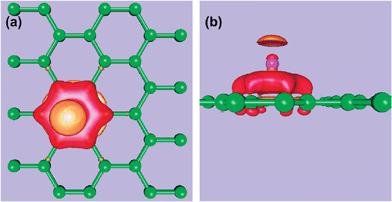 | ||
| Fig. 8 Effects of lithium intercalation into graphite, with associated electron-density redistribution for the adsorption of Li on graphene. (a) Top view of surface of constant Δρ = ρ(graphene + Li) −ρ(graphene) −ρ(Li). The red and orange surfaces correspond to +2.5 and −2.5 × 10⁻²e a.u.−3, respectively. (b) Side view of constant Δρ. Figure is based on plane wave calculations performed by the authors based on the results and Figure of ref. 133. | ||
Dopants therefore directly boost the H2 binding energy of the carbon substrate, but in addition they can act as H2 binding centres. Simulation has aided in the design of these materials,152–154 however the majority of first-principles simulations consider only the interaction with atomic hydrogen, of limited use for realistic systems where the thermodynamic reference for hydrogen should be the molecule. Froudakis performed a full DFT-B3LYP/MM simulation of molecular adsorption on atomic K dopants adsorbed on a (5,5) SWNT.154 They found that each K dopant physisorbs 3H2, with decreasing adsorption energies of 3.4 to 1.8 kcal mol−1/H2 (0.147 to 0.078 eV/H2), smaller than the 11.1 kcal mol−1 (0.481 eV/H2) found by empirical calculations. Positively charged Li ions complexed to a substrate will bind H2 with binding energies of magnitude 12 kJ mol−1/H2 (0.124 eV/H2).142 Yoon et al. found that a Ca32C60 structure will bind >8.4 wt%, with each dopant binding 5H2 molecules at a consistent binding energy of 0.4 eV/H2.147 In general however direct H2 binding to an atomic dopant will involve orbital interactions, e.g. H2σ-bond overlap with a LUMO state or σ*-bond overlap with a HOMO state.142
4.3 Interaction of transition-metal doped carbon systems with hydrogen
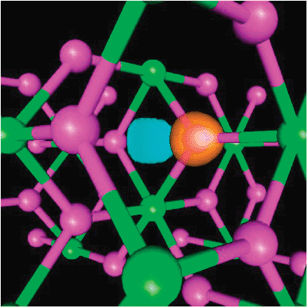
Recently a new approach has been proposed, transition metal (TM) atom doping.155,156 This method was initially developed in analogy with organometallic cyclopentadiene (C5H5) complexes, as TM atoms interact with a fivefold ring of fullerene C60 in a similar way to cyclopentadiene (Cp) rings, forming a Dewar coordination.157 This forms a strong bond between the TM atom and the fullerene. Hydrogen molecules then interact with the TM atom via a Kubas interaction, forming σ-bonds with the empty d-states of the TM atom, see Fig. 9.158 The maximum number of hydrogens that bind to a TM atom is determined by the 18-electron rule; once the s-, p-, and d-orbitals of the TM atom are filled it can no longer bind H2. The maximum number of hydrogens bound is| Nmax = 18 −nv− 5 |
![Schematic energy diagram and structure model for hybridisation of (a) Cp ring with Sc forming CpSc, (b) CpSc with 2H forming Cp[ScH2], and (c) Cp[ScH2] with H2 forming Cp[Sc(H2)H2]. In (a), only the last two π states are shown for Cp. In (c) the two upper states of Cp[ScH2] are neglected. Arrows indicate level occupation. Figure taken with permission from ref. 155. Copyright (2005) by the American Physical Society (URL: http://link.aps.org/abstract/PRL/v94/e155504).](/image/article/2009/CS/b815553b/b815553b-f9.gif) | ||
| Fig. 9 Schematic energy diagram and structure model for hybridisation of (a) Cp ring with Sc forming CpSc, (b) CpSc with 2H forming Cp[ScH2], and (c) Cp[ScH2] with H2 forming Cp[Sc(H2)H2]. In (a), only the last two π states are shown for Cp. In (c) the two upper states of Cp[ScH2] are neglected. Arrows indicate level occupation. Figure taken with permission from ref. 155. Copyright (2005) by the American Physical Society (URL: http://link.aps.org/abstract/PRL/v94/e155504). | ||
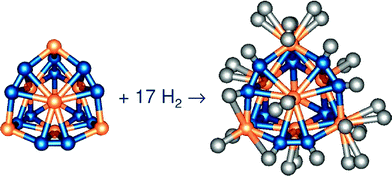
Using this rational design methodology Zhao et al. found (from DFT-PW91 simulations) that a C60fullerene with each fivefold face decorated by a Sc atom can reversibly adsorb 48 H2 molecules.155Boron-doping the fullerene allows an additional withdrawal of charge from the TM atom so that a C48B12 fullerene has optimal hydrogen storage properties, able to form a C48B12[ScH(H2)5]12 complex that has a hydrogen storage capacity of 8.77 wt%, is stable at room temperature and binds each H2 ligand with an adsorption energy of approximately 0.3 eV/H2. Concurrently another first-principles simulation (DFT-PBE) demonstrated that a single Ti atom dopant adsorbed on an (8,0) SWNT can bind 4H2 stably at room temperature.156 If half of the surface hexagons are covered with Ti atoms then the gravimetric density of H2 is 7.7 wt%, with a binding energy of 0.18 eV/H2, reduced due to the interaction between Ti atoms. DFT-PBE simulation of a Ni atom dopant on an (8,0) SWNT shows that each atom can bind 5H2, releasing hydrogen at a temperature of 328 K, allowing in principle a gravimetric storage capacity of ∼10 wt%.159 Experimentally however nickel nanoparticles on MWNTs only achieve a storage capacity of 2.8 wt%.159 We note that this general idea is applicable to other hexagonal net systems such as boron nitride (BN), where DFT-PW91 calculations on an idealised system (BN)3H6Sc finds a reversible adsorption capacity of 4H2.19
Simulations on other transition metal doped carbon-based systems have also been performed. The DFT-PW91 simulation of organic molecules such as C4H4, C5H5, and C8H8 doped with titanium show that these systems can contain up to 9 wt% hydrogen with an adsorption energy of 0.55 eV/H2.160 Again maximum hydrogen storage capacity is determined by the 18-electron rule. A DFT-PBE combinatorial search by Lee et al. on metal-decorated polymers found that Ti-decorated cis-polyacetylene is optimal, with gravimetric storage capacities of 7.6 wt% and binding energies from 0.4 to 0.6 eV/H2 found.21 Density functional theory simulations on ethylene complexes reveal that C2H4Ti2 and C2H4Zr2 can both bind 10H2, with average binding energies of 0.45 eV/H2 (Ti) and 0.57 eV/H2 (Zr), respectively and capacities of ∼14 wt% (Ti) and ∼9 wt% (Zr).161,162 Such complexes have been recently observed experimentally.163 Research on transition metal doped polymers has led to additionally research on light-metal doped polymers, for example C2H4Li2 complexes162 or Li-doped cis-polyacetylene.164 Due to the lighter mass of the dopant their gravimetric capacities are higher, however the binding energy for H2 adsorption is less strong than for the TM decorated polymers, and thus these systems would be less suitable for hydrogen storage applications.
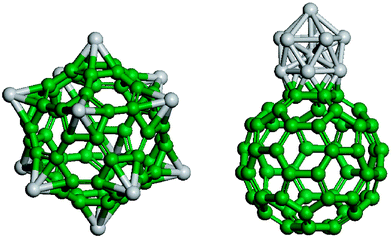
A major issue for the polymers is that they are unstable with respect to TM nanoparticle coalescence, consequently storing less hydrogen, see Fig. 10.165 Indeed, energetically C2H4Ti2 prefers to dimerise to form 2(C2H4Ti2) through the formation of a Ti–Ti bond, reducing gravimetric capacity to ∼7 wt%.161,164 This process has also been observed for Ti on a C60 surface, hindering hydrogen storage.166 Therefore in order to maximise hydrogen storage the TM dopants should be pinned strongly to the carbon substrate. One way of doing this is to add dopants to the carbon system such that the binding of the TM atoms is increased, e.g.nitrogen doping of graphenes.167 Another way would be to firmly emplace the TM atoms in a carbon matrix, either by defecting the support168 or by forming a metal carbide.169,170 Simulations on both the former and latter systems find that the maximum hydrogen capacity is less than expected from the 18 electron rule, e.g. for the latter system, the Ti metcar Ti8C12, Ti atoms on the corners adsorb 3H2 and Ti atoms in the centre of a face adsorb a single H2, see Fig. 11. These metcars can still adsorb 6 wt% H2, be stable at room temperature, and have desirable H2 binding energies. We note though that these are idealized models, as no one has experimentally realized the formation and subsequent dispersal of these metcar systems. However they (and all of the organometallic systems discussed in this section) are new systems which are of great potential utility for energy applications.
 | ||
| Fig. 10 Two configurations of Ti12C60. The configuration on the left-hand side is 24.8 eV higher in energy than the configuration on the right hand-side. Figure adapted from ref. 166. | ||
 | ||
| Fig. 11 Example of a Ti metcar Ti8C12 as a potential hydrogen storage media, binding 17H2 to the molecule. Figure taken with permission from ref. 169. Copyright (2006) by Elsevier Publishing. | ||
5. Conclusions
Hydrogen storage is a scientifically interesting but challenging problem for the worldwide research community. DFT simulations are best used to simulate chemical events that occur over a length scale of nanometres and a timescale of picoseconds. They thus are of great utility for modelling a wide range of behaviours in hydrogen storage materials. However, DFT cannot model truly collective long duration phenomena explicitly, e.g. the transformation in crystal structure upon dehydrogenation of MgH2. In addition DFT has an inherent uncertainty in the total energy of approximately 0.1 eV, although due to the systematic nature of the errors relative energies are often much more accurate. For most of the ground state properties, errors in the evaluation of energy differences can be factored into results (although this tends not to occur in the literature). However, for calculations of the activation barrier for chemical reactions (and thus reaction rate), the exponential dependence on energy results in a magnification of error, rendering calculated plateau pressures unreliable at best. Finally simulation, by its very nature, models idealized systems. Solid materials will consist of multiple grains and structural defects, dopants will not be ideally dispersed uniformly throughout the material, and nanotubes and nanoparticles will not exist in isolation. Crystals (such as LiBH4) where there is a substantial amount of orientational disorder need large supercells in order to treat these systems realistically, which is prohibitively expensive to simulate.Nevertheless DFT simulation is an extremely useful tool in the study of this field, providing insight into the chemistry and basic mechanisms behind hydrogenation and dehydrogenation mechanisms and allowing rapid design and prototyping of novel hydrogen storage materials. They provide insight into the nature of chemical bonding in MgH2, clarifying that the mechanism by which transition metals reduce the dehydrogenation enthalpy is by lessening the ionicity of the mixed covalent–ionic Mg–H bond. Simulations on LiNH2 indicate that the strength of the Li–N ionic bond affects the strength of the N–H covalent bond, with partial Mg or Al substitution of the Li ion reducing the temperature at which the N–H bond breaks. Simulations on LiBH4, another complex metal hydride, find that the binding between Li and BH4 units is ionic in nature, and that partial Cu substitution of the Li ion or F substitution of a H atom reduces the temperature at which hydrogen desorption occurs. However simulations for this system also reveal the shortfalls inherent in straightforward applications of density functional theory, where without highly sophisticated modifications to the free energy based on semiempirical data the experimentally observed high temperature phase is not observed. DFT simulations can also be used to screen for new reaction paths that may lead to very fruitful avenues for experimental research. We note in passing that the majority of high hydrogen content paths involve the (BH4) ligand. Thus further fundamental research both experimental and theoretical in nature, should be performed to understand the crystal structure, binding, and thermodynamics of the LiBH4 and Mg(BH4)2 systems. Finally DFT simulations have been used to prototype and rapidly develop new concepts for carbon based hydrogen storage materials. Of particular interest in this field is the recent advent of new transition metal doped carbon systems, which possess great promise in meeting technological targets for hydrogen storage. However experimental verification of these materials is, apart from a few cases, lacking. Simulation, as a single tool in the repertoire of chemical science, is therefore best used in conjunction with, not as a replacement for, experiment.
Acknowledgements
This work was supported by the EPSRC SUPERGEN Initiative under UK-SHEC (GR/S26965/01, EP/E040071/1) and by a Platform Grant (GR/S52636/01, EP/E046193/1). The authors wish to also thank Prof. Dario Alfè, Dr Louis Hector, Prof. Puru Jena, Dr Boutheina Kerkeni, Dr Kazutoshi Miwa, Dr Qiang Sun, Dr Scott Woodley, and Dr Yufeng Zhao for their help and assistance in preparing Figures.References
- V. M. Vishnyakov, Vacuum, 2006, 80, 1053 CrossRef CAS.
- D. K. Ross, Vacuum, 2006, 80, 1084 CrossRef CAS.
- Y. Song, Z. X. Guo and R. Yang, Phys. Rev. B, 2004, 69, 094205 CrossRef.
- L. Schlapbach and A. Zuttel, Nature, 2001, 414, 353 CrossRef.
- W. Kohn and L. J. Sham, Phys. Rev., 1965, 140, A1133 CrossRef.
- P. A. M. Dirac, Proc. Cambridge Philos. Soc., 1930, 26, 376 Search PubMed.
- J. P. Perdew, A. Ruzsinszky, J. Tao, V. N. Staroverov, G. E. Scuseria and G. I. Csonka, J. Chem. Phys., 2005, 123, 066201.
- J. P. Perdew and Y. Wang, Phys. Rev. B, 1986, 33, 8800 CrossRef.
- A. D. Becke, Phys. Rev. A, 1988, 38, 3098 CrossRef CAS.
- C. Lee, W. Yang and G. Parr, Phys. Rev. B, 1988, 37, 785 CrossRef CAS.
- J. P. Perdew, J. A. Chevary, S. H. Vosko, K. A. Jackson, M. R. Pederson, D. J. Singh and C. Fiolhais, Phys. Rev. B, 1992, 46, 6671 CrossRef CAS.
- J. P. Perdew, K. Burke and M. Enzerhof, Phys. Rev. Lett., 1966, 77, 3865.
- F. Hermann, J. P. Van Dyke and I. P. Ortenburger, Phys. Rev. Lett., 1969, 22, 807 CrossRef.
- R. M. Martin, Electronic Structure: Basic Theory and Practical Methods, Cambridge University Press, 2004 Search PubMed.
- J. Tao, J. P. Perdew, V. N. Staroverov and G. E. Scuseria, Phys. Rev. Lett., 2003, 91, 146401 CrossRef.
- A. D. Becke, J. Chem. Phys., 1993, 98, 5648 CrossRef CAS.
- A. D. Becke, J. Chem. Phys., 1997, 107, 8554 CrossRef CAS.
- V. N. Staroverov, G. E. Scuseria, J. Tao and J. P. Perdew, J. Chem. Phys., 2003, 119, 12129 CrossRef CAS.
- S. A. Shevlin and Z. X. Guo, Appl. Phys. Lett., 2006, 89, 153104 CrossRef.
- S. A. Shevlin and Z. X. Guo, Phys. Rev. B, 2007, 76, 024104 CrossRef.
- H. Lee, W. I. Choi and J. Ihm, Phys. Rev. Lett., 2006, 97, 056104 CrossRef.
- S. V. Alapati, J. K. Johnson and D. S. Sholl, Phys. Chem. Chem. Phys., 2007, 9, 1438 RSC.
- NIST Chemistry Webook, NIST Standard Reference Database Number 69, ed. P. J. Lindstrom and W. G. Mallard, National Institute of Standards and Technology, Gaithersburg, MD, 2005, 20899, http://webbook.nist.gov Search PubMed.
- J. J. Vajo, S. L. Skeith and F. Meters, J. Phys. Chem. B, 2004, 108, 13977 CrossRef CAS.
- Z. Lodziana and T. Vegge, Phys. Rev. Lett., 2004, 93, 145501 CrossRef.
- O. M. Løvvik, S. M. Opalka, H. W. Brinks and B. C. Hauback, Phys. Rev. B, 2004, 69, 134117 CrossRef.
- P. Hänggi, P. Talkner and M. Borkovec, Rev. Mod. Phys., 1990, 62, 251 CrossRef.
- T. Vegge, Phys. Chem. Chem. Phys., 2006, 8, 4853 RSC.
- T. Itoh, G. R. Bell, A. R. Avery, T. S. Jones, B. A. Joyce and D. D. Vvedensky, Phys. Rev. Lett., 1998, 81, 633 CrossRef.
- G. Boisvert, N. Mousseau and L. J. Lewis, Phys. Rev. B, 1998, 58, 12667 CrossRef CAS.
- T. Vegge, Phys. Rev. B, 2004, 70, 035412 CrossRef.
- G. Henkelman, B. P. Uberuaga and H. Jónsson, J. Chem. Phys., 2000, 113, 9901 CrossRef CAS.
- G. Henkelman and H. Jónsson, J. Chem. Phys., 2000, 113, 9978 CrossRef CAS.
- D. Sheppard, R. Terrell and G. Henkelman, J. Chem. Phys., 2008, 128, 134106 CrossRef.
- J. L. Bobet, C. Even, Y. Nakamura, E. Akiba and B. Darriet, J. Alloys Compd., 2000, 298, 279 CrossRef CAS.
- M. Bortz, B. Bertheville, G. Bottger and K. Yvon, J. Alloys Compd., 1999, 287, L4–L6 CrossRef CAS.
- A. J. Du, S. C. Smith, X. D. Yao and G. Q. Lu, Surf. Sci., 2006, 600, 1854 CrossRef CAS.
- W. Yang, S. A. Shevlin, C. X. Shang and Z. X. Guo, in preparation.
- K. Higuchi, K. Yamamoto, H. Kajioka, K. Toiyama, M. Honda, S. Orimo and H. Fujii, J. Alloys Compd., 2002, 330–332, 526–530 CrossRef CAS.
- Z. X. Guo, C. Shang and K. F. Aguey-Zinsou, J. Eur. Ceram. Soc., 2008, 28, 1467 CrossRef CAS.
- R. W. P. Wagemans, J. H. van Lenthe, P. E. de Jongh, A. J. van Dillien and K. P. de Jong, J. Am. Chem. Soc., 2005, 127, 16675 CrossRef CAS.
- Y. Song and Z. X. Guo, Appl. Phys. Lett., 2006, 89, 111911 CrossRef.
- M. Pozzo and D. Alfè, Phys. Rev. B, 2008, 77, 104103 CrossRef.
- R. Yu and P. K. Lam, Phys. Rev. B, 1988, 37, 8730 CrossRef CAS.
- M. Tsuda, W. A. Diño, H. Nakanishi and H. Kasai, J. Phys. Soc. Jpn., 2004, 73, 2628 CrossRef CAS.
- T. Noritake, M. Aoki, S. Towata, Y. Seno, Y. Hirose, E. Nishibori, M. Takata and M. Sakata, Appl. Phys. Lett., 2002, 81, 2008 CrossRef CAS.
- S. Li, P. Jena and R. Ahuja, Phys. Rev. B, 2006, 74, 132106 CrossRef.
- A. J. Du, S. C. Smith and G. Q. Lu, J. Phys. Chem. C, 2007, 111, 8360 CrossRef CAS.
- D. Chen, Y. M. Wang, L. Chen, S. Liu, C. X. Ma and L. B. Wang, Acta Mater., 2004, 52, 521 CrossRef CAS.
- M. Tsuda, W. A. Diño, H. Kasai and H. Nakanishi, Appl. Phys. Lett., 2005, 86, 213109 CrossRef.
- M. Tsuda, W. A. Diño, H. Kasai, H. Nakanishi and H. Aikawa, Thin Solid Films, 2006, 509, 157 CrossRef CAS.
- J.-J. Liang, J. Alloys Compd., 2007, 446–447, 72 CrossRef CAS.
- A. J. Du, S. C. Smith, X. D. Yao and G. Q. Lu, J. Phys. Chem. B, 2005, 109, 18037 CrossRef CAS.
- X. Yao, C. Wu, A. J. Du, G. Q. Lu, H. Cheng, S. C. Smith, J. Zou and Y. He, J. Phys. Chem. B, 2006, 110, 11697 CrossRef CAS.
- A. J. Du, S. C. Smith, X. D. Yao, C. H. Sun, L. Li and G. Q. Lu, Appl. Phys. Lett., 2008, 92, 163106 CrossRef.
- M. Pozzo, D. Alfè, A. Amierio, S. French and A. Pratt, J. Chem. Phys., 2008, 128, 094703 CrossRef CAS.
- J. H. Titherly, J. Chem. Soc., Trans., 1894, 65, 504 RSC.
- I. A. Kaye, J. Am. Chem. Soc., 1949, 71, 2322 CrossRef CAS.
- P. Chen, Z. T. Xiong, J. Z. Luo, J. Y. Lin and K. L. Tan, J. Phys. Chem. B, 2003, 107, 10967 CrossRef CAS.
- S. I. Orimo, Y. Nakamori, J. R. Eliseo, A. Züttel and C. M. Jensen, Chem. Rev., 2007, 107, 4111 CrossRef CAS.
- J. Lu, Z. Z. Fang and H. Y. Sohn, Inorg. Chem., 2006, 45, 8749 CrossRef CAS.
- K. F. Aguey-Zinsou, J. Yao and Z. X. Guo, J. Phys. Chem. B, 2007, 111, 12531 CrossRef CAS.
- T. Ichikawa, N. Hanada, S. Isobe, H. Leng and H. Fujii, J. Phys. Chem. B, 2004, 108, 7887 CrossRef CAS.
- L. L. Shaw, W. Osborn, T. Markmaitree and X. Wan, J. Power Sources, 2008, 177, 500 CrossRef CAS.
- T. Ichikawa, N. Hanada, S. Isobe, H. Y. Leng and H. Fujii, J. Alloys Compd., 2005, 404, 435 CrossRef.
- W. F. Luo and K. Stewart, J. Alloys Compd., 2007, 440, 357 CrossRef CAS.
- J. B. Yang, X. D. Zhou, Q. Cai, W. J. James and W. B. Yelon, Appl. Phys. Lett., 2006, 88, 41914 CrossRef.
- J. F. Herbst and L. G. Hector, Jr, Phys. Rev. B, 2005, 72, 125120 CrossRef.
- K. Miwa, N. Ohba, S.-I. Towata, Y. Nakamori and S.-I. Orimo, Phys. Rev. B, 2005, 71, 195109 CrossRef.
- Y. Song and Z. X. Guo, Phys. Rev. B, 2006, 74, 195120 CrossRef.
- A. D. Becke and K. E. Edgecombe, J. Chem. Phys., 1990, 92, 5397 CrossRef CAS.
- L. G. Hector and J. F. Herbst, J. Phys.: Condens. Matter, 2008, 20, 064229 CrossRef.
- J. B. Yang, X. D. Zhou, Q. Cai, W. J. James and W. B. Yelon, Appl. Phys. Lett., 2006, 88, 41914 CrossRef.
- C. Zhang, M. Dyer and A. Alavi, J. Phys. Chem. B, 2005, 109, 22089 CrossRef CAS.
- T. Noritake, H. Nozaki, M. Aoki, S. Towata, G. Kitahara, Y. Nakamori and S.-I. Orimo, J. Alloys Compd., 2005, 393, 264 CrossRef CAS.
- K. Ohoyama, Y. Nakamori, S.-I. Orimo and K. Yamada, J. Phys. Soc. Jpn., 2005, 74, 483 CrossRef.
- M. P. Balogh, C. Y. Jones, J. F. Herbst, L. G. Hector, Jr and M. Kundrat, J. Alloys Compd., 2006, 420, 326 CrossRef CAS.
- B. Magyari-Köpe, V. Ozoliņš and C. Wolverton, Phys. Rev. B, 2006, 73, 220101 CrossRef.
- T. Mueller and G. Ceder, Phys. Rev. B, 2006, 74, 134104 CrossRef.
- H. M. Jin and P. Wu, Appl. Phys. Lett., 2005, 87, 181917 CrossRef.
- S.-I. Orimo, Y. Nakamori, G. Kitahara, K. Miwa, N. Ohba, T. Noritake and S. Towata, Appl. Phys. A: Mater. Sci. Process., 2004, 79, 1765 CAS.
- C. J. Zhang and A. Alavi, J. Phys. Chem. B, 2006, 110, 7139 CrossRef CAS.
- J. Rijssenbeek, Y. Gao, J. Hanson, Q. Huang, C. Jones and B. Toby, J. Alloys Compd., 2008, 454, 233 CrossRef CAS.
- J. K. Kang, S. Y. Kim, Y. S. Han, R. P. Muller and W. A. Goddard III, Appl. Phys. Lett., 2005, 87, 111904 CrossRef.
- J. P. Soulié, G. Renaudin, R. Černy and K. Yvon, J. Alloys Compd., 2002, 346, 200 CrossRef CAS.
- A. Züttel, S. Rentsch, P. Fischer, P. Wenger, P. Sudan, P. Mauron and C. Emmenegger, J. Alloys Compd., 2003, 356–357, 515 CrossRef CAS.
- T. J. Frankcombe and G.-J. Kroes, Phys. Rev. B, 2006, 73, 174302 CrossRef.
- K. Miwa, N. Ohba, S.-I. Towata, Y. Nakamori and S.-I. Orimo, Phys. Rev. B, 2004, 69, 245120 CrossRef.
- Z. Łodziana and T. Vegge, Phys. Rev. Lett., 2004, 93, 145501 CrossRef.
- T. J. Frankcombe, G.-J. Kroes and A. Züttel, Chem. Phys. Lett., 2005, 405, 73 CrossRef CAS.
- Y. Filinchuk, D. Chernyshov and R. Cerny, J. Phys. Chem. C, 2008, 112, 10579 CrossRef CAS.
- N. A. Zarkevich and D. D. Johnson, Phys. Rev. Lett., 2008, 100, 040602 CrossRef CAS.
- Y. Dmitriev, Y. Filinchuk, D. Chernyshov, A. V. Talzyin, A. Dzwilewski, O. Andersson, B. Sundqvist and A. Kurnosov, Phys. Rev. B, 2008, 77, 174112 CrossRef.
- J. C. Galvez-Ruiz and M. Sanchez, J. Mol. Struct., 2007, 818, 23 CAS.
- Q. Ge, J. Phys. Chem. A, 2004, 108, 8682 CrossRef CAS.
- A. J. Du, S. C. Smith and G. Q. Lu, Phys. Rev. B, 2006, 74, 193405 CrossRef.
- M. B. Smith and G. E. Bass, Jr, Phys. Rev. B, 2006, 73, 174302 CrossRef.
- A. J. Du, S. C. Smith, X. D. Yao and G. Q. Lu, J. Phys. Chem. C, 2007, 111, 12124 CrossRef CAS.
- S. Orimo, Y. Nakamori and A. Züttel, Mater. Sci. Eng., B, 2004, 108, 51 CrossRef.
- K. Miwa, N. Ohba, S. Towata, Y. Nakamori and S.-I. Orimo, J. Alloys Compd., 2005, 404–406, 140 CrossRef CAS.
- L. Yin, P. Wang, Z. Fang and H. Cheng, Chem. Phys. Lett., 2008, 450, 318 CrossRef CAS.
- J. J. Reilly and R. H. Wiswall, Inorg. Chem., 1967, 6, 2220 CrossRef CAS.
- J. J. Vajo, S. L. Skeith and F. Meters, J. Phys. Chem. B, 2005, 109, 3719 CrossRef CAS.
- S. V. Alapati, J. K. Johnson and D. S. Sholl, J. Phys. Chem. B, 2006, 110, 8769 CrossRef CAS.
- S. V. Alapati, J. K. Johnson and D. S. Sholl, J. Phys. Chem. C, 2007, 111, 1584 CrossRef CAS.
- T. J. Frankcombe, J. Alloys Compd., 2007, 446–447, 455 CrossRef CAS.
- S. V. Alapati, J. K. Johnson and D. S. Sholl, Phys. Chem. Chem. Phys., 2007, 9, 1438 RSC.
- S. V. Alapati, J. K. Johnson and D. S. Sholl, J. Phys. Chem. C, 2008, 112, 5258 CrossRef CAS.
- D. J. Siegel, C. Wolverton and V. Ozoliņš, Phys. Rev. B, 2007, 76, 134102 CrossRef.
- V. Ozoliņš, B. Sadigh and M. Asta, J. Phys.: Condens. Matter, 2005, 17, 2197 CrossRef CAS.
- N. Hanada, W. Lohstroh and M. Fichtner, J. Phys. Chem. C, 2008, 112, 131 CrossRef CAS.
- R. Strobel, J. Garche, P. T. Moseley, L. Jorissen and G. Wolf, J. Power Sources, 2006, 159, 781 CrossRef.
- A. C. Dillon, K. M. Jones, T. A. Bekkedahl, C. H. Hiang, D. S. Bethune and M. J. Heben, Nature, 1997, 386, 377 CrossRef CAS.
- A. Chambers, C. Park, R. T. K. Baker and N. M. Rodriguez, J. Phys. Chem. B, 1998, 102, 4253 CrossRef CAS.
- E. Yoo, T. Habe and J. Nakamura, Sci. Technol. Adv. Mater., 2005, 6, 615 CrossRef CAS.
- F. Darkrim and D. Levesque, J. Chem. Phys., 1998, 109, 4981 CrossRef CAS.
- R. F. Cracknell, Mol. Phys., 2002, 100, 2079 CrossRef CAS.
- P. Piseri, E. Barborini, M. Marino, P. Milani, C. Lenardi, L. Zoppi and L. Colombo, J. Phys. Chem. B, 2004, 108, 5157 CrossRef CAS.
- J. S. Arellano, L. M. Molina, A. Rubio and J. A. Alonso, J. Chem. Phys., 2000, 112, 8114 CrossRef.
- Y. Okamoto and Y. Miyamoto, J. Phys. Chem. B, 2001, 105, 3470 CrossRef CAS.
- F. Tran, J. Weber, T. A. Wesolowski, F. Cheikh, Y. Ellinger and F. Pauzat, J. Phys. Chem. B, 2002, 106, 8689 CrossRef CAS.
- T. Heine, L. Zhechkov and G. Seifert, Phys. Chem. Chem. Phys., 2004, 6, 980 RSC.
- C. Gu, G. H. Gao and H. Gao, Phys. Chem. Chem. Phys., 2002, 4, 4700 RSC.
- D. Henwood and J. D. Carey, Phys. Rev. B, 2007, 75, 245413 CrossRef.
- Y. Lei, S. A. Shevlin, W. Zhu and Z. X. Guo, Phys. Rev. B, 2008, 77, 134114 CrossRef.
- S.-H. Jhi and Y.-K. Kwon, Phys. Rev. B, 2004, 69, 245407 CrossRef.
- J. S. Arellano, L. M. Molina, A. Rubio, M. J. Lopez and J. A. Alonso, J. Chem. Phys., 2002, 117, 2281 CrossRef CAS.
- G. Vidali, G. Ihm, H. Y. Kim and M. W. Cole, Surf. Sci. Rep., 1991, 12, 133 CrossRef CAS.
- S. Patchkovskii, J. S. Tse, S. N. Yurchenko, L. Zhechkov, T. Heine and G. Seifert, Proc. Natl. Acad. Sci. U. S. A., 2005, 102, 10439 CrossRef CAS.
- S. Park, D. Srivastava and K. Cho, Nano Lett., 2003, 3, 1273 CrossRef CAS.
- J. Li, T. Furuta, H. Goto, T. Ohashi, Y. Fujiwara and S. Yip, J. Chem. Phys., 2003, 119, 2376 CrossRef CAS.
- E. C. Lee, Y. S. Kim, Y. G. Jin and K. J. Chang, Phys. Rev. B, 2002, 66, 073415 CrossRef.
- I. Cabria, M. J. Lopez and J. A. Alonso, Comput. Mater. Sci., 2006, 35, 238 CrossRef CAS.
- X. B. Yang and J. Ni, Phys. Rev. B, 2006, 74, 195437 CrossRef.
- G. E. Froudakis, Nano Lett., 2001, 1, 179 CrossRef CAS.
- A. Nikitin, H. Ogasawara, D. Mann, R. Denecke, Z. Zhang, H. Dai, K. Cho and A. Nilsson, Phys. Rev. Lett., 2005, 95, 225507 CrossRef CAS.
- S. Park, D. Srivastava and K. Cho, Nano Lett., 2003, 3, 1273 CrossRef CAS.
- S. P. Chan, G. Chen, X. G. Gong and Z. F. Liu, Phys. Rev. Lett., 2001, 87, 205502 CrossRef CAS.
- Y. H. Kim, Y. F. Zhao, A. Williamson, M. J. Heben and S. B. Zhang, Phys. Rev. Lett., 2006, 96, 016102 CrossRef.
- A. J. Du and S. C. Smith, Nanotechnology, 2005, 16, 2118 CrossRef CAS.
- T. A. Halgren, J. Am. Chem. Soc., 1992, 114, 7827 CrossRef CAS.
- R. C. Lochan and M. Head-Gordon, Phys. Chem. Chem. Phys., 2006, 8, 1357 RSC.
- V. V. Simonyan, P. Diep and J. K. Johnson, J. Chem. Phys., 1999, 111, 9778 CrossRef CAS.
- G. L. Che, B. B. Lakshmi, C. R. Martin and E. R. Fisher, Langmuir, 1999, 15, 750 CrossRef CAS.
- L. Grigorian, G. U. Sumanasekera, A. L. Loper, S. Fang, J. L. Allen and P. C. Eklund, Phys. Rev. B, 1998, 58, R4195 CrossRef CAS.
- G. H. Gao, T. Cagin and W. A. Goddard, Phys. Rev. Lett., 1998, 80, 5556 CrossRef CAS.
- M. Yoon, S. Yang, C. Hicke, E. Wang, D. Geohegan and Z. Zhang, Phys. Rev. Lett., 2008, 100, 206806 CrossRef.
- M. M. Shaijumon, N. Bejoy and S. Ramaprabhu, Appl. Surf. Sci., 2005, 242, 192 CrossRef CAS.
- P. Chen, X. Wu, J. Lin and K. L. Tan, Science, 1999, 285, 91 CrossRef CAS.
- W. Q. Deng, X. Xu and W. A. Goddard, Phys. Rev. Lett., 2004, 92, 166103 CrossRef.
- M. Khantha, N. A. Cordero, L. M. Molina, J. A. Alonso and L. A. Girifalco, Phys. Rev. B, 2004, 70, 125422 CrossRef.
- S. M. Lee and Y. H. Lee, Appl. Phys. Lett., 2000, 76, 2877 CrossRef CAS.
- P. Dubot and P. Cenedese, Phys. Rev. B, 2001, 63, 241402 CrossRef.
- G. E. Froudakis, Nano Lett., 2001, 1, 531 CrossRef CAS.
- Y. F. Zhao, Y. H. Kim, A. C. Dillon, M. J. Heben and S. B. Zhang, Phys. Rev. Lett., 2005, 94, 155504 CrossRef.
- T. Yildirim and S. Ciraci, Phys. Rev. Lett., 2005, 94, 175501 CrossRef CAS.
- D. M. P. Mingos, J. Organomet. Chem., 2001, 635, 1 CrossRef CAS.
- G. J. Kubas, J. Organomet. Chem., 2001, 635, 37 CrossRef CAS.
- J. W. Lee, H. S. Kim, J. Y. Lee and J. K. Kang, Appl. Phys. Lett., 2006, 88, 143126 CrossRef.
- B. Kiran, A. K. Kandalam and P. Jena, J. Chem. Phys., 2006, 124, 224703 CrossRef.
- E. Durgun, S. Ciraci, W. Zhou and T. Yildirim, Phys. Rev. Lett., 2006, 97, 226102 CrossRef CAS.
- W. Zhou, T. Yildirim, E. Durgun and S. Ciraci, Phys. Rev. B, 2007, 76, 085434 CrossRef.
- A. B. Phillips and B. S. Shivaram, Phys. Rev. Lett., 2008, 100, 105505 CrossRef CAS.
- S. Li and P. Jena, Phys. Rev. B, 2008, 77, 193101 CrossRef.
- S. Li and P. Jena, Phys. Rev. Lett., 2006, 97, 209601 CrossRef CAS.
- Q. Sun, Q. Wang, P. Jena and Y. Kawazoe, J. Am. Chem. Soc., 2005, 127, 14582 CrossRef CAS.
- G. Kim, S.-H. Jhi and N. Park, Appl. Phys. Lett., 2008, 92, 13106 CrossRef.
- S. A. Shevlin and Z. X. Guo, J. Phys. Chem. C, 2008, 112, 17456 CrossRef CAS.
- Y. F. Zhao, A. C. Dillon, Y.-H. Kim, M. J. Heben and S. B. Zhang, Chem. Phys. Lett., 2006, 425, 273 CrossRef CAS.
- N. Akman, E. Durgun, T. Yildirim and S. Ciraci, J. Phys.: Condens. Matter, 2006, 18, 9509 CrossRef CAS.
Footnote |
| † Part of the renewable energy theme issue. |
| This journal is © The Royal Society of Chemistry 2009 |