Quantum dot-based resonance energy transfer and its growing application in biology
Igor L. Medintz and Hedi Mattoussi*
U.S. Naval Research Laboratory, Center for Bio/Molecular Science and Engineering, Code 6910, and Division of Optical Sciences, Code 5611, 4555 Overlook Ave, S.W. Washington D.C., 20375, USA. E-mail: hedi.mattoussi@nrl.navy.mil
First published on 27th November 2008
Abstract
We provide an overview of the progress made in the past few years in investigating fluorescence resonance energy transfer (FRET) using semiconductor quantum dots (QDs) and the application of QD-based FRET to probe specific biological processes. We start by providing some of the pertinent conceptual elements involved in resonance energy transfer, and then discuss why the Förster dipole–dipole mechanism applies to QD fluorophores. We then describe the unique QD photophysical properties of direct relevance to FRET and summarize the main advantages offered, along with some of the limitations encountered by QDs as exciton donors and/or acceptors. Next we describe the overall progress made and discuss a few representative examples where QD-based FRET sensing of specific biological processes has been demonstrated. We also detail some of the advances of single molecule FRET using QD-conjugates and highlight the unique information that can be extracted. We conclude by providing an assessment of where QD-based FRET investigations may be evolving in the near future.
 Igor L. Medintz Igor L. Medintz | Igor L Medintz studied chemistry and forensic science at John Jay College of Criminal Justice, City University of New York (CUNY). He received his PhD in molecular biology at Queens College (also CUNY). He carried out postdoctoral research at U.C. Berkeley on the development of FRET-based assays using microfabricated devices for genetic analysis. Since 2002 he has been at the Center for Bio/Molecular Science and Engineering at the US Naval Research Laboratory where he is working on creating biosensors with quantum dots. |
 Hedi Mattoussi Hedi Mattoussi | Hedi Mattoussi is a senior physicist at the Naval Research Laboratory. Prior to joining NRL, he had spent time at the Polymer Science Department (University of Massachusetts) and the Center for Materials Science at MIT. He presently focuses on the development of inorganic nanoparticles, their characterization and the design of strategies to interface them with biological receptors. He has intensively worked on developing quantum dots as platforms for immobilizing proteins and peptides, and their use for imaging and sensing. |
1. Introduction
Fluorescence labeling of biological molecules, as a tool for developing immunoassays, cellular labeling and tissue imaging, is one of the most commonly used approaches in modern biotechnology. Similarly, Föster or fluorescence resonance energy transfer (FRET) between distinct dyes attached on two ends of a biomolecule or to separate molecules brought in close proximity has provided researchers with a powerful tool to probe a variety of biological processes. These include protein–protein interactions, ligand–receptor binding, and changes in protein and oligonucleotide conformation in response to a biological stimulus.1–3 Most of these investigations have relied on the use of conventional fluorophores (e.g., organic dyes, fluorescent proteins, chemiluminescent substrates, and fluorescent polymers) and these tend to have inherent limitations that reduce the effectiveness of this technique.4–5 These include narrow excitation windows and broad emissions which can result in substantial overlap between the donor (D) and acceptor (A) absorption/emission spectra and a significant contribution to acceptor emission due to direct excitation.1–3 For instance, implementation of a multiplexed FRET to monitor interactions between two or more D–A pairs simultaneously, often requires complex instrumentation for excitation and signal detection, and significantly complicates the spectral deconvolution and data analysis. Additional limitations can arise with fluorophores having low quantum yields, pH sensitivity, and susceptibility to both chemical and photo-degradation.In comparison, luminescent semiconductor nanocrystals, such as those made of CdSe and PbSe cores, have several unique properties which promise significant advantages in bioanalytical and imaging applications.6–10 By varying the nanocrystal size and composition, QDs can be made to emit light over a wide range of wavelengths, from the UV-visible to the near IR regions of the optical spectrum;6–14 photoemission is typically narrow symmetric with a full-width at half max (FWHM) of ∼25–40 nm. These fluorophores also have a broad absorption window (that increases steadily towards the UV), and thus allows the simultaneous and efficient excitation of different color QDs at a single wavelength far from their respective emissions; this makes QDs naturally suited for multiplexing applications. QDs also have very high extinction coefficients and high brightness, and exhibit a pronounced resistance to both chemical and photo-degradation. These properties make them very attractive for use in single molecule fluorescence studies such as protein tracking, since extended visualization under sustained irradiation is permitted. Luminescent QDs have another characteristic that distinguishes them from organic fluorophores: intermittent photoemission or blinking of individual nanocrystals. The PL of isolated QDs displays an alternation between ‘on’ (emitting) and ‘off’ (dark) periods, the duration of which follows a “heavy-tail” power law distribution with time.15–17 This feature becomes especially important for single molecule studies, since a QD can become periodically unavailable for detection. It has however been utilized as an indicator for distinguishing single QD and QD-bioconjugates from potential aggregates that form in a particular medium.18
Due to their colloidal nature QDs are larger than organic dye molecules. The hydrodynamic radius of a QD varies from ∼5 to ∼50 nm, depending on a combination of factors that include the inorganic core (or core-shell) dimension, shape, and the type of surface-functionalization used to provide hydrophilicity.19 In comparison to monovalent dyes, a QD can offer multiple functionalization sites due to their large surface area. The ability to conjugate several biomolecules to a single QD may be particularly advantageous in certain instances, e.g., when enhanced target affinity and energy transfer efficiency are desired.7 Combined, these intrinsic features have generated a tremendous interest in semiconductor nanocrystals as stable and versatile fluorophores in biological studies.6–10,20 This interest has created both a strong desire to develop a sound understanding of their fundamental properties and a need to design versatile chemical routes to make improved materials.
In this report we provide an overview of the progress made in the past few years on the use of QD-FRET to investigate several biological processes. We start by providing some of the pertinent elements involved in resonance energy transfer, and then discuss why the Förster dipole–dipole mechanism applies to QD fluorophores. We describe the unique QD photophysical properties of direct relevance to FRET (as applied to both ensemble and single molecule configurations) and summarize the main advantages offered as well as some of the limitations encountered by QDs as exciton donors and/or acceptors. Next we survey representative examples where sensing of specific biological processes using QD-based FRET has been demonstrated, and describe the overall progress made using both ensemble and single molecule studies. We conclude by providing an assessment of where QD-based FRET may be evolving in the near future.
2. Background
FRET involves the non-radiative transfer of excitation energy from an excited state donor molecule (D) to a proximal ground state acceptor molecule (A); it is driven by dipole–dipole coupling between donor and acceptor fluorophores. Efficient FRET interactions require that two key criteria be satisfied: (1) proximity between donor and acceptor, due to the dipole–dipole (short range) nature of the interactions; and (2) there must be finite spectral overlap between the donor emission and acceptor absorption profiles.1 The process also strongly depends on the relative orientation of the donor and acceptor dipoles (see below). A perfectly parallel dipole orientation produces the highest FRET efficiency, whereas a perpendicular orientation would reduce the transfer to nil, even with a sizable spectral overlap. The rate of energy transfer k between a donor and an acceptor separated by a distance (center-to-center) r can be expressed as:1 | (1) |
 | (2) |
| R0 = (BQDI)1/6 (expressed in Å), | (3) |
 | (4) |
 | (5) |
The strong 6th power dependence of FRET efficiency on D–A separation r makes this process ideally suited for probing separation distances in the range of 10–100 Å, which has led researchers to refer to this technique as a “spectroscopic ruler”.1 FRET is ideally suited for assessing the size of macromolecules (bio or not) and probing changes in their relative conformation resulting from interactions with target molecules or changes in the surrounding conditions. FRET-based biosensing employing conventional fluorophores has been widely used to provide real-time information on specific events, such as calcium signaling, nutrient flux and the intricacies of nascent protein folding.21–24 Effective implementation of FRET necessitates that the D–A fluorophores share a sizable spectral overlap and that simple and reproducible methods be used for labeling target molecules with the desired donor and acceptor molecules.
3. Does the Förster dipole–dipole formalism apply to QD-dye pairs?
Despite the numerous reports published in the past few years focusing on the effective use of QD donors in an array of FRET-based studies and sensing demonstrations, the question of whether or not the Förster dipole–dipole interaction mechanism applies to QD-dye pairs persists. This question is pertinent and complex since these nanocrystals are much larger in size than molecular organic dyes. Addressing it requires that a few specific issues be clarified. The first pertains to the colloidal nature of the QD fluorophores: does the point dipole approximation apply to these large size (multi-atomic) nanocrystals, and if yes why? This approximation has already been used for data analysis quite frequently.25–28 Its validity resides in the fact that the electron and hole wave functions share a strong overlap, and the overall exciton wave function is confined within the physical dimension of the nanocrystal. The exciton wave function is essentially centered at the dot center and vanishes at the nanocrystal edge (boundary conditions).29 In addition, the nanocrystal size is always much smaller than the wavelength of the excitation light used to interrogate QD samples. These two properties combined imply that the point dipole approximation provides a correct description of these otherwise large size fluorophores. The second question focuses on the distance dependence of the energy transfer efficiency: would the 6th power dependence of FRET efficiency on the inverse of the separation distance (which is a direct result of the dipole–dipole interaction mechanism) provide an accurate description of the experimental data for QD-dye D–A pairs? Recently, we confirmed this property by self-assembling a set of CdSe–ZnS core-shell QDs with a series of Cy3-labeled beta-strand peptides with increasing length. The bridging polypeptides are rigid and have sequences that consist of a variable number of core β-strands, each presenting a tyrosine (Y), a glutamic acid (E), a histidine (H), and a lysine (K) residue at the turns of the strand (Fig. 1A). These polypeptides form ‘rodlike’ structures, as confirmed by spectroscopy and electron microscopy.30–32 Block repeats of 1, 3, 5, 7, 14, 21 YEHK units were used to controllably vary the separation distance. In addition, each peptide in the series expressed an N-terminal dicysteine and a C-terminal hexahistidine (His6) sequence. The two terminal cysteine groups were used to attach two maleimide-functionalized Cy3 dyes for each peptide series, while the polyhistidine at the other end promoted self-assembly on CdSe–ZnS QDs capped with dihydrolipoic acid (DHLA) ligands.33,34 The FRET efficiencies normalized to a configuration of one-to-one QD-Cy3 pair extracted from the PL loss was plotted versus center-to-center separation distance (see Fig. 1B). These distances were derived from the structural consideration of the repetitive β-sheets used. Together with the experimental data, a fit using a 6th power dependence on the center-to-center separation distance, is also shown in Fig. 1B; the experimental value for R0 was used in the fit. It is clear that a good agreement between fit and data is shown across the separation distance afforded by the QD-YEHK-Cy3 system.35 This serves as a strong proof that, overall, the Förster dipole–dipole interactions mechanism accurately describes the energy transfer process in QD-dye D–A pairs and further confirms that the point dipole approximation is correct for these nanocrystal fluorophores. A thorough discussion of the point dipole approximation applied to luminescent QDs and the subtle physical arguments that underlie this experimental fact is beyond the scope of this report. There are, however, a few recent reports that provide detailed theoretical discussions of the above concepts and the application of the Förster formalism to energy transfer with QDs.36–38 With this issue addressed, we now detail a few specific attributes and limitations of employing QDs as energy donors or acceptors with proximal dyes. | ||
| Fig. 1 (A) QD-YEHKm-dye conjugate structure (m is the repeat number). (B) Comparison between FRET efficiency and fit using the Förster dipole–dipole formalism (eqn (2)). The efficiencies were extracted from the QD PL quenching data using R0 calculated from the experimental parameters such as the spectral overlap integral, PL yield, and normalized to the configuration of one-to-one donor–acceptor pair. Inset shows the expected theoretical curve of the FRET Efficiency versus r/R0. Figure partially reproduced from ref. 35, with permission from the American Chemical Society. | ||
4. Unique attributes and limitations of QD fluorophores for resonance energy transfer
As donor fluorophores, luminescent QDs exhibit several properties that can benefit FRET configurations; many of these are unavailable to conventional fluorophores.5 These attributes apply in both ensemble and single molecule FRET measurements.4.1 Increase the transfer efficiency by arraying multiple acceptors around a single QD
Because colloidal QDs have large surfaces that present multi-reactive and binding sites, a single nanocrystal can be made to simultaneously interact with several proximal acceptors. This can, for example, be realized by arraying multiple copies of dye-labeled proteins around the same nanoparticle (Fig. 2A); an average size nanocrystal can accommodate several small to medium size dye-labeled proteins (molecular weight ∼10–60 kDa) and an even larger number of dye-labeled oligonucleotides or peptides. In this configuration the QD plays the dual role of a nanoscale scaffold for arraying multiple copies of dye-labeled (and unlabeled) receptors and as a central exciton donor to the surrounding acceptors. Such a configuration produces a proportional increase in the FRET cross-section (the overlap integral) with increasing number of acceptors, and a substantial enhancement in the overall energy transfer efficiency compared to a configuration of a one-to-one D–A pair. The overall energy transfer efficiency can be expressed as: | (6) |
 | (7) |
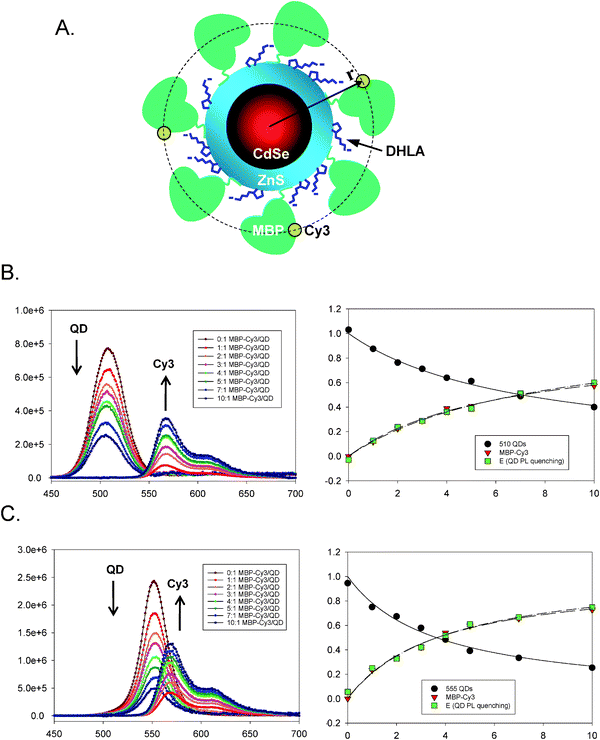 | ||
| Fig. 2 (A) Schematic representation of a CdSe–ZnS QDs conjugated to several copies of MBP-Cy3 via metal-histidine self-assembly. (B) Evolution of the PL spectra derived from titrating 510-nm emitting QDs with an increasing average ratio, n, in QD–MBP–Cy3 assemblies (left) together with the integrated intensities for both QD and Cy3 versus ratio and the FRET efficiency (E) extracted from the QD integrated intensity (right). (C) Similar data for 555-nm emitting QDs showing the effects of better overlap integral. Spectra have been deconvoluted and corrected for direct excitation contribution to acceptor emission. Partially reproduced from ref. 26, with permission from the American Chemical Society. | ||
The simplified treatment above, though effective for analyzing simple centro-symmetric configurations, is not necessarily correct when multiple FRET acceptors are arrayed at different distances from the QD. In this case a distribution function for the various dye distances from the QD center must be used in eqn (7) to provide an accurate description for the measured efficiencies. Possible distribution functions that can be applied include a Gaussian function, a square function, or even more sophisticated expressions depending on the sample configuration used. Use of such distribution functions may provide a better description of the data if a rather large number of acceptors are present.
Eqn (7) provides a correct approximation for relatively modest to low (one-to-one D–A) FRET efficiencies in centro-symmetric configurations, which was the case for the data shown in Fig. 2. However, additional complications may arise for QD-dye systems having high rates of FRET, because of the natural heterogeneity in conjugate valence (i.e., heterogeneity in the dye-to-QD ratios). The latter is an experimental reality that governs any nanocrystal-conjugate, due to the multivalent nature of their surfaces compared to molecular scale organic dyes. We have demonstrated that this heterogeneity can be described within the Poisson statistics, where for a given average nominal valence N, the subset of conjugates having valence, n, ranging from 0 to N is described by the Poisson distribution function, p(n,N). Taking into account this heterogeneity, the FRET efficiency E in eqn (7) can then be rewritten as:40
 | (8) |
Finally, we should emphasize that in all analyses of energy transfer between QD donors and dye acceptors (single or multiple acceptors) a κ2 value of 2/3, characteristic of a random distribution of D–A dipoles, applies. This assumption results from the simple nature of these large size fluorophores, and is correct for essentially any QD-dye (or QD–QD) pair. For instance, it has been shown that the transition dipole of the lowest lying states in the emission of CdSe QDs is 2D degenerate in the plane perpendicular to the c axis of the crystal orientation,41 which implies that there is a partial random orientation of the QD dipoles with respect to each other in the medium. It is further supported by the inability to control the orientation of the acceptor dipoles conjugated to the QD surface with respect to the QD transition dipole and with respect to each other in the conjugate (e.g., protein-dye, peptide-dye or DNA-dye).26
4.2. Controlling the spectral overlap by size-tuning the QD emission
Substantial spectral overlap between donor emission and acceptor absorption (eqn. (1)) is a required condition to achieve any measurable FRET in most conventional systems. Here too QDs offer a unique advantage to tune this parameter, which in turn can allow control over the FRET efficiency. The spectral overlap can be tuned by changing the QD emission (via size or composition) paired with a given dye acceptor. An illustration of this unique feature is shown in Fig. 3 where the PL emissions of 3 different size CdSe–ZnS QD-dispersions emitting at 510, 530 and 555 nm are plotted together with the absorption spectrum of Cy3 dye. Data show that the overlap function, J(λ), improves substantially for QD samples emitting close to the absorption maximum of Cy3, with R0 varying from ∼47 to 57 Å for the three pairs. The clear benefit of this property is that through a combination of nanocrystal size and material used to prepare the inorganic core one should always be able to select a QD for optimized spectral overlap with a potential dye acceptor.26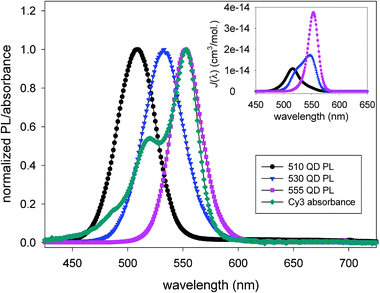 | ||
| Fig. 3 Absorbance spectrum of Cy3 dye superimposed with the PL spectra of three CdSe–ZnS core–shell QDs measured in solution, both are normalized. The inset shows plots of the resulting overlap functions J(λ). Tuning the QD emission can substantially improve the degree of spectral overlap with the dye. Figure partially reproduced from ref. 26, with permission from the American Chemical Society. | ||
4.3. Reduction of the direct excitation contribution to acceptor photoemission
Direct excitation contribution to acceptor emission is always strong for conventional D–A pairs due to a combination of small Stokes’ shifts and broad absorption spectra, and it can adversely affect FRET experiments. With conventional D–A pairs, analysis often requires careful deconvolution of composite spectra in order to separate donor and acceptor emissions and derive accurate measurements of the FRET efficiencies. The ability to efficiently excite a QD sample over a broad window anywhere below the band edge peak allows one the flexibility to select a line corresponding to the acceptor’s absorption valley for any QD-dye pair. This can drastically reduce the direct excitation contribution of the acceptor emission, allowing one to easily isolate the FRET-sensitization of the acceptor, improve the signal to noise ratio and simplify the subsequent analysis.26,39 This property is also beneficial to single molecule FRET experiments where direct excitation contribution of to the acceptor dye can complicate data collection and analysis. Because single molecule experiments tend to require rather high excitation powers, this can also reduce issues associated with dye degradation and photobleaching.4.4. Achieving ‘multiplex’ energy transfer configurations with one excitation source
The advantages offered by QDs for realizing multiplexed FRET result from their narrow emission profiles combined with their broad absorption spectra. The most “obvious” configuration for multiplex FRET would use multiple distinct dye acceptors in conjugation with the same QD donor. However, our group has shown that such configuration encounters two potential complications: (1) difficulty in performing spectral deconvolution because of the broad emission spectra of organic dyes, which makes distinguishing one FRET channel from another very challenging; (2) non-radiative energy transfer between dyes attached to the same donor can also take place given the close proximity, which will further complicate the data analysis and interpretation.We have found that multiplex FRET using QDs was much simpler to realize using a configuration where multiple QD donors emitting at distinct wavelengths are used with the same dye-acceptor.42 We used the self-assembled QD-MBP conjugates (introduced above), pre-labeled with Cy3 dye acceptor to implement a two-plex FRET (as schematically represented in Fig. 4). As can be seen, the PL of a particular QD within the mixture can be selectively quenched or modulated by energy transfer to the proximal dye. Time-resolved fluorescence measurements also confirmed that only the set of QDs engaged in FRET interactions experienced a shortening in its lifetime. Additional details using three and four channel FRET and employing both emissive and dark (non-emissive) dyes are provided in ref. 42 These demonstrations highlight the intrinsic potential of multiplexed FRET with QDs in biology, since the ability to follow two or three processes simultaneously within the same cell, for example, could provide valuable information on how cellular events are correlated.
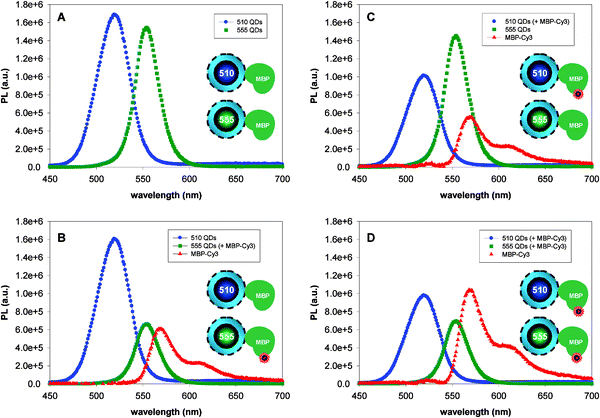 | ||
| Fig. 4 A QD-dye pair system using two QD donors and a Cy3 acceptor; all spectra are deconvoluted. (A) Spectra of 510-nm and 555-nm emitting QDs, no Cy3 present. (B) Spectra of 510-nm QDs (without dye) and 555-nm QDs (four Cy3 per QD) are shown. (C) Reverse configuration using 510-nm QD-MBP-Cy3 and 555-nm QD-MBP (no dye). (D) Spectra collected from of solutions where both 510-nm and 555-nm QDs have 4 MBP-Cy3 per QD out of the total 15 MBP/QD. Schematics representation of the labeled and unlabeled QD conjugates are shown in the insets. Figure partially adapted from ref. 42, with permission from the American Chemical Society. | ||
5. Limitations of QD-based resonance energy transfer
Use of QDs in energy transfer investigations (as either D or A) does have limitations, two of which may be serious and can hinder their effectiveness. The first limitation is due to size. Being colloidal in nature, QDs are substantially larger than molecular dyes, and do not allow very close approach of the acceptors, i.e., the minimal separation distance allowed is slightly larger than the nanocrystal radius. In addition, this radius becomes larger for redder-emitting QDs, and this further limits the range of accessible distances when coupling these nanocrystals to far red emitting dyes.7 For example, the core CdSe size of core-shell nanocrystals used in most biological studies can easily increase by a factor of two for red emitting QDs compared to their blue emitting counterparts.43 This can be further complicated by the fact that hydrophilic QDs used in biology often require that elaborate surface-functionalization strategies be employed to promote their effective transfer to buffer media while maintaining a relatively high QY, which can dramatically increase the overall conjugate size as discussed earlier. Two main strategies are presently used: (1) encapsulation within a block-copolymer or a phospholipid micelle, where one hydrophobic block anchors on the QD’s native ligand (usually a mixture of trioctyl phosphine and trioctyl phosphine oxide, TOP/TOPO) while the other is hydrophilic and promotes affinity to water. (2) Cap exchange of the native organic shell with bifunctional molecular scale ligands. These two approaches tend to increase the effective size of the nanocrystals, even though cap exchange was shown to produce smaller size nanocrystals in general.19 Other issues affecting water soluble QDs are pH stability and shelf life. If all those parameters are taken into account, the ratio a/R0 (a designates the effective hydrophilic QD radius, corresponding to the minimal approach of the acceptor) can easily exceed 1, in particular when using some of the polymer encapsulation methods. The range of a/R0 reported for the various QD-protein-dye assemblies studied thus far varied from a/R0∼ 0.8 to 1.2 (for direct polyhistidine-driven self-assembly, see Fig. 1) and exceeded 1.5 for streptavidin-coated commercial QDs. For the latter, the large separation distance has been compensated by increasing the conjugate valence using several receptor-dye complexes per QD (see examples below).The second limitation pertains to using QDs as acceptor fluorophores with organic dye donors. Even though there have been a few reports of QD acceptors in conjunction with bluer emitting nanocrystals,44 these same materials do not seem to work when used with dye donors.45 The main limitation stems from the fact that luminescent QDs tend to have very large extinction coefficients that extend from the UV to the absorption band edge. Another potential constraint may be attributed to the fact that QDs have longer excited-state lifetimes than most organic dyes. These would imply that the QDs are always very effectively excited when used as acceptor fluorophores in a FRET configuration. This issue can be somewhat “solved” if donors with long exciton lifetimes (e.g., rare earth ions) are used in combination with time-gated fluorescence measurements.46 Such configuration removes the direct excitation contribution to the QD emission and allows one to select only the contribution due to energy transfer. However, in a configuration where fluorescence emission of the potential donor is driven by a natural chemical process (e.g., bioluminescence) and direct photoexcitation of the nanocrystal is removed, QDs can be used as energy acceptor (see section 7.2 below).
6. Detection of specific biological processes using QD-based resonance energy transfer
There have been several interesting developments using FRET as a signal transduction mechanism to design QD sensing assemblies, where detection of biological target molecules or biological processes has been realized. We will describe a few representative examples, group them based on the structure of the QD-substrate used and the targeted biological process, and examine their advantages and limitations.6.1. Detecting hybridization using QD–nucleic acid conjugates
For these conjugates, the nucleic acids, such as DNA or RNA, provide the conjugated assemblies with either sequence-driven complementarity (e.g., DNA molecular beacons)47,48 or a recognition-functionality that is derived from the 3-dimensional structure of the oligonucleotide used.49 In one representative example, where binding was not driven by sequence complementarity, Ellington and co-workers exploited the 3-dimensional recognition properties of aptamers to detect the presence of a larger, non-nucleotidyl target, the enzyme protease thrombin.50 The sensing configuration utilized to detect thrombin’s presence is based on a competition displacement format. Conjugates were formed using biotinylated DNA aptamers and commercial streptavidin-QDs (Invitrogen); high average dye-to-QD ratios of ∼40 were used to achieve high quenching efficiencies, due to the rather large size of streptavidin-QDs. Partially complementary acceptor-labeled DNA sequences were allowed to hybridize onto the QD-aptamer conjugates, resulting in quenching of the QDs emission (see Fig. 5). When added to the solution, thrombin displaced the dye-DNA and produced a concentration-dependent recovery in QD PL. Testing the sensor against lysozyme (a different protease not recognized by the aptamer) did not significantly affect the QD PL, which reflects that the specificity of the aptamer was maintained in the QD-conjugate. This study focused on detecting the presence/absence of enzyme, not its activity or viability. The QD-aptamer-DNA-dye assembly was also tested for its ability to detect complementary and non-complementary oligonucleotides. The authors used two different oligonucleotides, one perfectly complementary to the aptamer on the QD and one containing a two-base-pair internal mismatch (i.e., double mutant sequence), and found that addition of the perfectly complementary sequence resulted in a steady time-dependent increase of the QD fluorescence; this was due to displacement of the DNA-dye away from the nanocrystal and loss of FRET. Importantly, these changes were recorded only at temperatures near the melting point of the aptamer-DNA complex (Fig. 5). In comparison, the presence of the second double mutant oligonucleotide had no effects. This shows that displacement of the dye-labeled sequence occurs only in the presence of a perfectly complementary sequence and near the melting temperature.50 Overall, these measurements confirm that the aptamers on the nanocrystal surface maintain their biological activity. Use of QD-aptamer conjugates combined with FRET has been more recently used for cancer cell targeting and sensing of drug delivery by Bagalkot and co-workers.51 They assembled a “Bi-FRET” system made of luminescent QDs conjugated to the A10 RNA aptamer which is known to have specific recognition for the extracellular domain of the prostate specific membrane antigen (PMSA protein). When mixed with the fluorescent antineoplastic drug doxorubicin (Dox), the latter intercalates within the double stranded stem of A10 aptamer, which bring it in close proximity dot surface and promotes dual FRET-induced quenching of the nanocrystal and Dox (the latter is due to FRET interactions directly between Dox and the aptamer). Using the specific recognition A10 RNA to PMSA, they were able to deliver these QD-aptamer-Dox assemblies inside the cells and show that slow post-uptake release of the caged Dox produced recovery of the QD and Dox PL signals. Here too the nanocrystal provided a platform and a tool for delivery and imaging of intracellular compartments.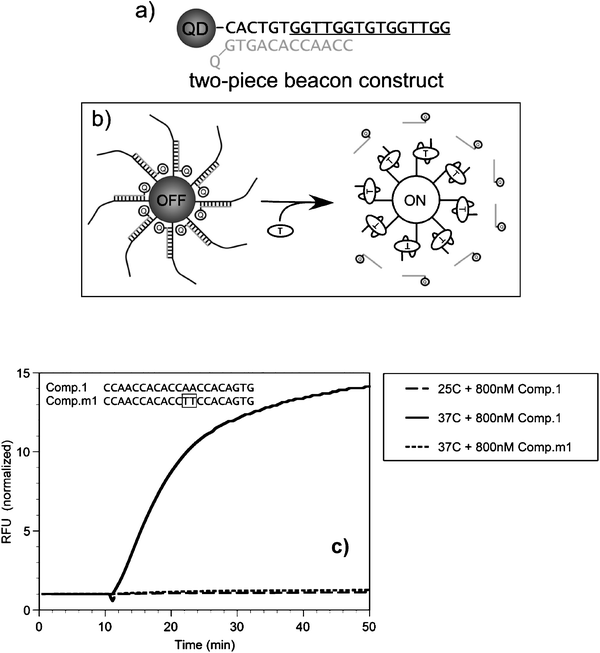 | ||
| Fig. 5 (a) Schematics of the QD-aptamer beacon assembly. The portion of the anti-thrombin aptamer known to form a quadruplex is underlined; the sequence of anti-thrombin aptamer and the quenching oligonucleotide are in gray. (b) Binding of target enzyme displaces the oligonucleotide-quencher (gray), resulting in recovery of QD PL. (c) Binding of an oligonucleotide target to the aptamer. The recovery of the QD signal was only observed in the presence of the complementary target at 37 °C. No activation was measured at 25 °C; 10 min. indicates the addition of the oligonucleotides. Figure partially reproduced from ref. 50, with permission from Wiley-VCH Verlag GmbH & Co. | ||
In another sensing example, Zhang and Johnson used FRET to investigate the specific interactions between the Rev responsive element, RRE IIB RNA, and a peptide derived from the Rev protein, Rev peptide (see Fig. 6A).52 Rev is a small regulatory protein of HIV-1 that plays an essential role in the virus replication. RRE is a region in the RNA molecule of the HIV env gene that is specifically recognized by the Rev protein. Thus probing the sequence-specific interaction between Rev and RRE (REV-RRE binding) is critical to understanding HIV-1 replication. A Cy5-labeled arginine-rich amino acid sequence derived from the basic region of Rev with reported high affinity to RRE (Cy5-labeled Rev peptide), along with biotinylated RRE IIB RNA were used. Several copies of the biotinylated RRE IIB RNA were first attached to Streptavidin-QDs and the conjugate was used to capture Cy5-labeled Rev peptide. This produced FRET interactions and quenching of the QD PL with efficiencies that depended on the peptide concentration (Fig. 6B). The authors further assessed the inhibitory effects of neomycin B on Rev-RRE binding when added (at a given concentration) together with increasing concentration of Rev-peptide to solutions of the QD-conjugate. They found that the presence of neomycin B indeed interfered with the peptide binding to the conjugate, reducing the measured rates of FRET. The dissociation constant Kd between RRE and Rev peptide increased by ∼4 in the presence of neomycin B (Fig. 6C), which suggests that the QD-RRE assembly could potentially be used in the screening of pharmaceuticals targeting HIV-1 virus replication.
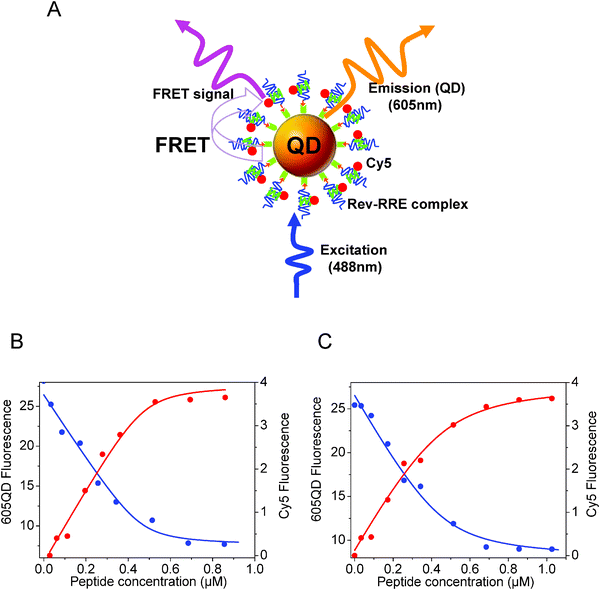 | ||
| Fig. 6 (A) Schematics of the QD-oligonucleotide conjugates used to account for the recognition of Rev peptide by RRE based on FRET between 605-nm emitting QDs and Cy5. (B) Effects of increasing Rev peptide concentration on the QD (blue circles) and Cy5 (red circles) PL signals. (C) Similar titration in the presence of neomycin B. Figure partially reproduced from ref. 52, with permission from the American Chemical Society, and kindly provided by Zhang and Johnson. | ||
Direct hybridization using QD-oligonucleotide conjugates was employed by Algar and Krull to simultaneously detect the presence of two distinct oligonucleotide sequences, in a ‘two-plex’ FRET format.53 For this, dispersions of CdSe–ZnS QDs emitting at 525 nm and 605 nm were conjugated to two distinct DNA-probes, then allowed to hybridize with two target sequences, one labeled with Cy3 (acceptor for the 525-nm emitting QDs) and the other with AlexaFluor 647 (acceptor for the 605-nm emitting QDs). Following excitation the fluorescence emission was separated in two optical channels: a “green channel” (450 < λ < 600 nm) to isolate the FRET between the 525-nm-QD-Cy3 pair, which reflects binding of target one, while a “red channel” (λ > 600 nm) was used to isolate the signal from the 605-nm-QD-Alexa647 pair specific to DNA target 2. With such a configuration, DNA target sequences at nM concentrations were detected in a sample mixture. Interestingly, they also found that the use of the common nucleic acid intercalating dye ethidium bromide (binding affinity is for double-stranded DNA) as the acceptor could increase the signal to noise ratio, a result attributed to reduction in non-specific interactions. This multiplex format is slightly different in design from what was described in section 4.4 above. Beyond this example, implementing QD-based FRET sensing in a multiplexed format has been rather limited. One of the main difficulties is reducing the effects of substrate cross-reactivity; often a single substrate can recognize multiple targets molecules albeit with different affinities.
Another example of sensing based on sequence-driven complimentarily was reported by Banin’s group.27 They attached an average of 6-thiolated DNA probes onto CdSe–ZnS QDs (emitting at 580 nm), while Texas Red was used to label the complementary target DNA sequence. They found that when QD-DNA probes and dye-labeled targets were mixed, changes in QD PL due to energy transfer between QD and proximal dye allowed real-time monitoring of hybridization. Addition of DNase I enzyme digested the duplex DNA structures and resulted in partial QD PL recovery. More recently, Klenerman’s group used the DNA intercalating dye, ethidium bromide, as a substitute acceptor and probed the kinetic of DNA-hybridization by monitoring changes in the rates of FRET with various target concentrations.54 One promising aspect of this study was the use of a tri(ethylene glycol) linker, introduced within the QD surface coating to substantially reduce the strong, non-specific adsorption of DNA on the QD surface, as discussed below. The same concept of QD-FRET sensing driven by hybridization has also been applied to the selection of highly effective small-interfering RNA (siRNA) sequences with specific affinity to the respective mRNA targets.55
Overall use of QD-FRET to detect oligonucleotide hybridization tends to encounter a few practical constraints. One of them is difficulty in controlling some of the key parameters involved, namely acceptor-to-donor ratios, separation distances, and target labeling valence. For example, Banin and co-workers observed that direct non-specific interactions (such as electrostatic binding) between the QD surfaces and target DNAs could complicate the experimental conditions and analysis.21 This issue constitutes a major hurdle to using QD-DNA as sensing assemblies, because charged groups are often used in promoting water-transfer of the nanocrystals (e.g., carboxyl and amine functionalized ligands and block copolymers).7 Quantitative evaluation of FRET interactions when multiple acceptors are attached to a DNA strand at random locations (which results in random D–A separation distances) can be very difficult.54–56 Furthermore, a combination of QD polymer encapsulation, conjugation techniques used and long DNA sequence can result in rather large D–A separation distances and substantially reduced FRET rates, despite the ability to array multiple acceptor-labeled oligonucleotides around a single nanocrystal.55
6.2. pH and ion sensing
There are several intracellular processes that generate bursts of specific ions or are controlled by changes in the local concentration of protons. For example, bursts in intracellular calcium flux provide an important indication of how live cells respond to external stimulations (e.g., recognition of viral infection by immune T cells).57,58 Thus designing molecular assemblies that can allow accurate monitoring of local changes in pH or a particular ion flux is highly desired. Coupling of fluorescent dyes exhibiting emission and/or absorption that are sensitive to the local concentration of H+ ions to a QD has allowed the design and characterization of two preliminary FRET-driven pH sensors.In the first example, Raymo and co-workers chemically assembled an organic ligand complex that incorporates a thioctic acid group and a photochromic 4-nitrophenylazophenoxy chromophore to form the basis of their pH sensor.59 When the ligands are mixed with hydrophobic (TOP/TOPO-capped) QDs, they ‘associate’ with the native capping shell and form QD-photochromic dye conjugates, which initiate FRET interactions. They found that in the presence of either acid or base the absorption properties of the chromophore complex underwent a photochromic transformation, which in turn altered the rate of energy transfer between QD and dye. Using a phase-transfer catalyst, the QD-ligand complexes were able to probe the pH of aqueous solutions in a biphasic system. Specifically, they showed that the PL of a CHCl3 phase containing Bu4NCl and QD-ligand complexes traces the pH of the overlaid aqueous phase. In particular, they found that pH changes between ∼3 and ∼11 in the aqueous phase produced ∼30% decrease in the QD PL compared to the value measured originally in the CHCl3 layer. Nonetheless, the need for a biphasic medium to realize pH sensing somewhat limits the biological ‘effectiveness’ of this assembly.
In the second example, Nocera and coworkers conjugated a pH-sensitive squaraine dye via EDC (1-ethyl-3-(3-dimethylaminopropyl)carbodiimide) condensation to QDs encapsulated within a hydrophobically modified poly(acrylic acid) capping layer. This promoted proximal FRET interactions between dot and dye. Because the dye’s absorption profile is a function of pH, the efficiency of the FRET interactions also becomes a function of the environmental pH. In particular, the authors showed that modulation of the FRET efficiency by varying the solution pH values below and above the pKa of the dye (∼8.5) produced net ratiometric dependence between the QD and dye emissions (as shown in Fig. 7).60 This also provided them with a unique tool to measure the solution pH, by simply analyzing the ratio of the QD and dye peak intensities or comparing them to the value at the isosbestic point. This provided for a good internal reference, since the isobestic point does not vary for normalized fluorescence plots. Because the ratiometric measurements are potentially not sensitive to fluctuations in the overall collected signals, such an approach can be more accurate and more reliable than ‘conventional’ chemo- or biosensors that utilize one signal response (i.e., either brightening or darkening). This design was more recently expanded by Snee and co-workers who used a blue emitting CdS-ZnS QD paired with a fluorescein dye to create a ratiometric pH sensor, similar to the one described above. They used a surface-functionalization scheme based on encapsulating the nanoparticles within a thiolated amphiphilic polyacrylic-octylamine ‘raft’ block-copolymer to promote water transfer of the QDs.61 Because the thiol on the polymer did not interact directly with the nanoparticle surface, it offered a free target site for attaching a maleimide-activated dye (such as fluorescein or BODIPY), which then provided an acceptor with pH dependent absorption properties. The resulting QD-polymer-dye construct exhibited a pH-dependent ratio between the QD and dye emissions, due to a pH-dependent rate of energy transfer between QD and dye.
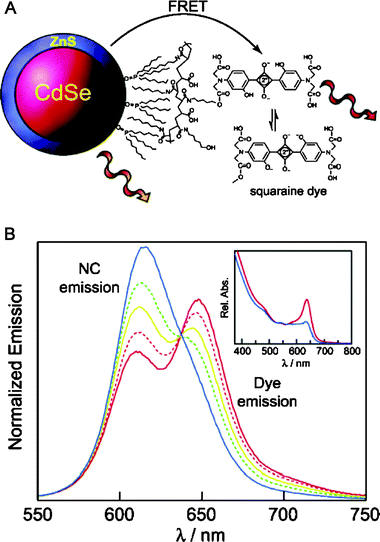 | ||
| Fig. 7 (A) Schematic of a pH sensor constructed from CdSe–ZnS QDs coupled to a pH-sensitive squaraine dye. FRET rate is modulated by the environment as the dye's absorption varies as a function of pH. (B) Changes in the emission profile of a QD-squaraine dye conjugate as a function of pH (red 6.0; orange 7.0; yellow 8.0; green 9.0; and blue 10); sample excited at 380 nm. The normalized spectra show pH dependence with an isosbestic point at 640 nm. Absorbance of the dye is suppressed at basic pHs as shown in the inset. Partially reproduced from ref. 60, with permission from the American Chemical Society. Figure kindly provided by D. Nocera. | ||
Sensing of metal ions in solution media using QDs has also been attempted. However, most of the reported studies traced changes in the QD PL upon addition of soluble ions such as Cu2+.62–65 Those were not clearly based on FRET, but rather on surface interactions or potential electron/redox transfer which altered the nanocrystal PL properties.62–65 There have been a few reported attempts aimed at building constructs using, for example, QDs and ion sensitive dye(s) in polymeric beads that are capable of detecting the presence of soluble ions in biological media.66 However, in these strategies the sensitivity remains essentially a function of ionophore equilibrium response which is not very sensitive (mM range). Furthermore, there is little control over QD-to-acceptor separation distance and the large overall size of the “particles” may limit potential intracellular applications.
6.3. Competitive sensing formats using QD-protein conjugates
In this configuration, the specificity of the QD-conjugate sensors is provided by the protein’s ability to recognize and bind to its cognate target. The competition format commonly uses a dye-labeled analog (with a known affinity to the protein receptor) which is first captured by the QD-conjugates. Formation of the QD-protein–analog-dye complex brings the dye in close proximity to the QDs and results in loss of the QD emission due to strong FRET interactions. When the target molecule is added to the solution, it will compete off the analog and bind to the receptor protein. This displaces the acceptor away from the nanocrystal surface, reduces FRET interactions, and produces a progressive recovery of the QD emission (Fig. 8A). Analysis of the QD PL recovery can provide insights into the sensing kinetics and allow an estimation of the dissociation (or binding) constant. In the above design, initial capture of the analog can be accomplished by either pre-assembling the protein and dye-labeled analog prior to conjugation onto the QD, or by adding the analog-dye to the sample containing the preformed QD-protein assemblies. Alternatively the target and analog could be simultaneously added to the QD-protein conjugates. In this case, however, one monitors the reduction in FRET efficiencies measured in the presence of the competing target molecule. Three specific examples employing this sensing strategy will be detailed below.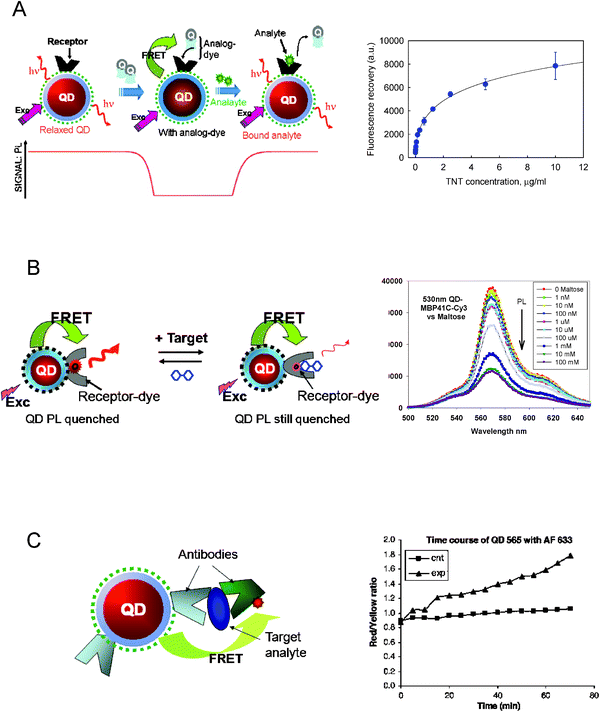 | ||
| Fig. 8 Schematic representations of the various sensing configurations described. (A) Competitive sensing (left). An analog-dye is captured by the QD-receptor conjugate, resulting in quenching of the nanocrystals emission. When the analyte is added it displaces the analog-dye away from the nanoparticle surface, which produces a recovery in QD emission. This scheme has been applied for sensing maltose and TNT.28,70 Representative data using QD-scFV conjugates to sense soluble TNT (right). (B) Reagentless sensing (left); here the FRET rate is fixed. Sensor applied to the detection of maltose using QD-MBP-41C-Cy3. Representative data shown (right) indicate that QD emission remains constant while that of MBP-Cy3 decreases with increasing maltose concentration. (C) Schematic representation of immuno-sensing based on FRET and using the QD as a platform and donor. Data for the dye-to-QD emission ratio monitored with time following reagent mixing, side-by-side with a control sample.71 Figures adapted from ref. 69–71, and reproduced with permission from the American Chemical Society, Elsevier and Wiley-VCH. | ||
The first example was demonstrated by our group and utilized MBP self-assembled on the QD surface to specifically target the nutrient sugar maltose.28 MBP was allowed to pre-bind a beta-cyclodextrin (BCD) analog of maltose, prior to QD-conjugate assembly. This analog was covalently labeled with a QSY-9 dark quencher. Multiple copies of the MBP-BCD-QSY9 complexes were self-assembled onto the QD surface via metal-affinity interactions. The proximity of the MBP-BCD-QSY9 complex to the nanocrystal resulted in efficient FRET and pronounced quenching of the QD emission. Subsequent addition of maltose competed for MBP binding, displaced the BCD-QSY9 and produced an increase in QD PL that depended on the maltose concentration.28 The maltose dissociation constant KD of ∼7 μM, extracted from the FRET recovery data, correlated well with the 1–10 μM values reported for solution-phase wild-type MBP. This sensor was further tested in the presence of a variety of sugars and results confirmed that its binding specificity for sugars containing α1-4 glucosidic linkages (only those found in maltosides) was maintained. These results also indicate that MBP retains its binding specificity and affinity after self-assembly onto the QD surface. A preliminary sensing assembly based on a similar overall design using QD-concanavalin A (con A) conjugates and TRITC-labeled CD immobilized in a polyethylene glycol (PEG) matrix was recently described by Loeb and co-workers.67 In this case, added glucose competes with TRITC-labeled CD for binding to gel immobilized QD-conA. A fiber optic, “protected” by two successive layers of polyimide coating and collagen, was used to probe and optically excite the fluorophores within the gel. Time-dependent changes in the emission ratio between the QD and TRITC signal was measured as the gel matrix was exposed to different regimes of glucose concentration.67
Variations in the above sensor construct targeting maltose have been demonstrated by our group, employing QD-MBP conjugates in a reagentless configuration with either one- or two-photon excitation modes.40,68,69 For the reagentless configuration, MBP was labeled with Cy3 at a unique site within the proteins binding pocket and self-assembled onto the QDs surface (see schematic in Fig. 8B). Addition of increasing concentrations of maltose resulted in a rearrangement of the protein structure, which altered the dye’s emission yield. It should be stressed that in the reagentless configuration the total FRET efficiency stays the same throughout the experiment, but it is the concentration-dependent change in the dye emission (relative to that of the dot) within the conjugate that allowed monitoring changes in maltose concentration.40,68,69
In the second example, a sensing assembly targeting the explosive trinitrotoluene (TNT) in aqueous environments was assembled and tested.70 In this case, a single chain antibody fragment specifically selected against TNT (αTNT-ScFV) and expressing a C-terminal polyhistidine sequence was first conjugated to the QDs and served as the recognition protein. An analog-dye complex consisting of the quencher (BHQ-10) attached to the TNT analog trinitrobenzene via a diaminopentane linker (BHQ-10-TNB) was also prepared. When the pre-assembled αTNT-ScFV-BHQ-10-TNB construct was self-assembled onto the QD, a FRET-induced quenching of the QD PL was measured; the efficiency of the quenching depended on the number of the dye-analog-αTNT-ScFV constructs attached to the nanocrystal surface and the QD-dye spectral overlap. Addition of soluble TNT to the sensor competed for binding onto the receptor and displaced the analog-quencher, resulting in a concentration-dependent recovery of the QD emission (Fig. 8A). When this assembly was tested against several different explosives, we found that only TNT elicited a significant recovery of QD PL, which again proves that the specificity of this sensor design was maintained after protein conjugation to the QD.70
6.4 Antibody-based sensing
The competitive formats discussed above were complemented by FRET-based immunosensing which used antibodies for both target capture and sandwich formation on the QD scaffold. Starting with two distinct antibodies specific for the same target-antigen (capture and reporter antibodies) but with no affinity for each other, the capture antibody can be conjugated to the QD donor and the reporter antibody to a dye-acceptor. When the target antigen is added to the solution, it binds both capture and reporter antibodies forming a sandwich structure immobilized on the nanocrystal surface (Fig. 8C). This produces a FRET-induced quenching of the QD photoemission, with a rate of quenching that depends on the target concentration. This type of FRET-based immunosensing, however, can be complicated by the large size of antibodies and the lack of unique sites on the antibodies for dye-labeling and attachment to the QD. This ultimately results in both a heterogeneous distribution of D–A separation distances and mixed antibody avidity. To evaluate this sensing format, Wei and co-workers conjugated a monoclonal antibody specific for estrogen receptor β (ER-β, the antigen in this case) to 565-nm emitting QDs, while Alexa Fluor 633 dye was used to label a polyclonal anti-ER-β reporter antibody.71 Addition of ER-β induced a loss in the QD PL, due to the antibody-ER-β-antibody sandwich formation near the QD surface and promotion of FRET interactions. A D–A separation distance of ∼80–90 Å was derived from the FRET data, which reflected the rather large size of the antibody molecules involved. Derivatives of this sensing format have also been tested using QDs embedded inside microbeads coated with capture antibodies.726.5. Sensing enzymatic activity using QD-peptide/oligonucleotide substrates
Utilizing FRET for signal transduction is one the most common approaches reported for detecting protease activity. This sensing configuration is based on cleavage of a peptide substrate, and it thus differs from the one based on competition for binding sites (described in section 6.1). Proteases constitute an important group of enzymes and they function in an array of normal and aberrant biochemical processes and, along with playing key roles in pathogenic virulence, form important clinical and pharmaceutical targets.73,74 The sensing assemblies reported to date mostly consist of QDs conjugated to peptide-substrates. The peptides, as the smaller building blocks of proteins, provide a minimal amino acid recognition/cleavage sequence that is both integral and sufficient for the sensor’s overall function. Attaching multiple copies of dye-labeled peptides on the QD surface brings the acceptors in close proximity to the nanocrystal and induces a ratio-dependent quenching of the QD PL. Once the QD-peptide-dye assemblies are formed and the solution is equilibrated, addition of appropriate enzyme specifically cleaves the peptide substrate and displaces the dye away from the nanocrystal, resulting in a progressive reduction of FRET and recovery of the QD emission. As the rate of peptide cleavage is a kinetic process, it will depend on the protease concentration and this can be tracked from the PL recovery following substrate cleavage.In the first example developed by our group, a series of tailored QD-peptide assemblies capable of monitoring the proteolytic activity of several enzymes were constructed and tested.39 For this, we used a modular design where each peptide incorporated within its linear structure: an N-terminal His6 sequence for self-assembly onto CdSe–ZnS QDs, a helix-linker spacer to provide rigidity and extension away from the QD surface, an exposed protease recognition sequence, and a C-terminal cysteine-thiol for labeling with maleimide-functionalized dyes (see schematic Fig. 9A). The advantage of the modular design resides in the fact that the specificity of the substrate towards a target enzyme could be altered by changing the central recognition sequence, while maintaining the same overall peptide structure. Four sensing assemblies targeted to the proteases caspase-1, thrombin, collagenase and chymotrypsin were constructed and tested. Fig. 9B shows a representative set of PL spectra for 538-nm emitting QDs vs. an increasing ratio of Casp1 peptide labeled with Cy3 dye acceptor. The corresponding relative QD PL decay and FRET efficiency versus number of dye-labeled peptides per QD which was used as a standard curve to extract the amount of cleaved substrates, following exposure to caspase-1 enzyme, is shown in Fig. 9C. Fig. 9D shows the velocity versus increasing concentration of Casp1 peptide substrate in the presence of a given concentration of added caspase-1 enzyme. Analysis of the data for this and other enzymes also allowed determination of the Michaelis–Mention kinetic parameters (KM—the Michaelis constant and Vmax—maximal enzymatic velocity) and also allowed identification of the mechanism of inhibition, i.e., competitive vs. non-competitive, when specific inhibitors were present.39 The ability to easily switch between targeted proteases by changing a small modular unit within the peptide sequences combined with the ability to perform quantitative experiments will be especially useful for monitoring many proteases.
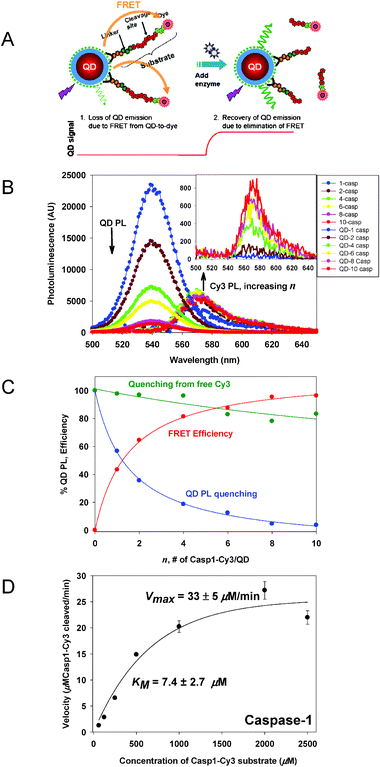 | ||
| Fig. 9 (A) Schematic diagram of the self-assembled QD–peptide conjugates targeting protease enzymes and the sensing mechanism involved. (B) Deconvoluted PL spectra for an increasing number of Casp1–Cy3 (labeled caspase-1 specific substrate) per QD (538-nm emitting QDs were used). The inset shows the PL contribution from dye alone due to direct excitation. (C) QD PL quenching (as a percentage, blue) and FRET efficiencies versus Casp1–Cy3-to-QD ratio (red). A control of QD PL loss versus the equivalent amount of free Cy3 is also shown (green). (D) Proteolytic activity for Casp-1; a constant amount of caspase-1 with an increasing concentration of Casp1–Cy3 substrate were used (excess substrate conditions). Figures adapted from 39 and 75 with permission of the American Chemical Society and NPG. | ||
In a second example, Rosenzweig and co-workers used peptides expressing a cysteine at one terminus and labeled with a rhodamine-dye at the other end as substrates.76,77 The peptide-dyes were used to surface functionalize CdSe–ZnS QDs via cap exchange. Similar to our design, the center section of the peptide sequence was designed to be recognized and cleaved by either of the peptidases, trypsin or collagenase. Incubating the pre-assembled QD-peptide-dye conjugates (which are partially quenched) with either enzyme produced recovery of the QD emission. Furthermore, the presence of an inhibitor was shown to substantially decrease the rate of fluorescence recovery and indicated a reduction in protease activity. The authors also showed that the conjugate sensor could detect the presence of extracellular secreted proteases in cancerous cell cultures. This study demonstrated that proteolytic activity could be qualitatively followed over time with QD-peptide substrates both in vitro and in clinically relevant cell culture samples.
In a third example, Rao and co-workers reported the assembly and testing of QD-substrates for sensing the activity of β-lactamase (Bla), a bacterial enzyme that hydrolyzes drugs such as penicillin and the cephalosporins and which is responsible for bacterial antibiotic resistance.78 In this case the authors did not employ a peptide, but rather synthesized and labeled a core Bla-recognized lactam chemical substrate with a Cy5 at one terminus, while a biotin at the other terminus enabled the substrate-dye to self-assemble onto 605-nm Streptavidin-QDs (Invitrogen), see Fig. 10. An additional modification of the substrate design to provide a longer lateral extension (or spacer) was necessary to overcome steric constraints and allow unhindered enzyme access to the Bla binding site on the QD-substrate. Addition of the lactamase enzyme to a solution of the QD-substrates resulted in time dependent changes in FRET efficiency and allowed monitoring of enzyme activity over time.
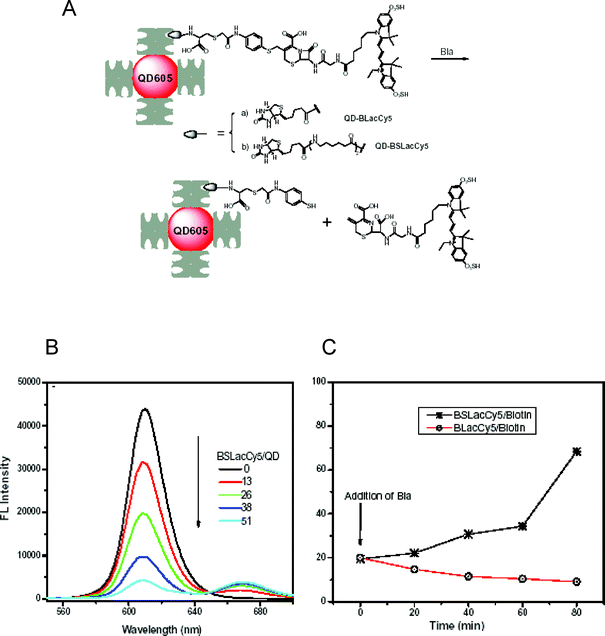 | ||
| Fig. 10 (A) Schematic representation of the QD-construct used to detect β-lactamase. Cy5-labeled biotinylated synthetic substrate is immobilized on Streptavidin-QDs. When added, Bla cleaved the lactam ring, released Cy5 and restored the QD emission. (B) Effects of binding increasing BSLac-Cy5 on the QD PL. (C) Relative QD fluorescence following activation of the QD-probes by Bla (0.03 mg mL−1) over time. Only the biotin-spacer-Lac (extended) substrate, BSLacCy5/biotin, was accessed and cleaved by the enzyme. Figures partially reproduced from ref. 78, with permission of Elsevier, and kindly provided by J. Rao. | ||
The above three examples suggest that QD-conjugates could potentially be applied as substrates to many other enzymatic screening and diagnostic assays. For instance, we tested the ability of the QD-peptide substrates to screen for potential thrombin inhibitors. Using 8 compounds, each at 3 different concentrations, we found that only compounds known to inhibit thrombin activity induced a sizable reduction (exceeding 50%) in the rates of cleaved peptides, which confirmed the specificity of the assay format.39 There has also been a recent study where surface-immobilized QD-conjugates were used to detect the activity of different proteases;79 in this case, QD-AuNP provided the D–A pair (see section 7.3). Additionally, the sensor for lactamase activity could be directly incorporated virtually ‘as is’ into pharmaceutical library screening assays for Bla inhibitors, i.e. drugs targeting enzymes with strong resistance to bacterial antibiotics.78
6.5. Quantum dots as a platform and sensitizer for photodynamic therapy
Photodynamic therapy (PDT) is a combined photophysical and chemical process that involves the transfer of excitation energy from an excited photosensitizing agent to a nearby oxygen molecule, resulting in the formation of reactive singlet oxygen (1O2). Reactive oxygen species (ROS) are known to initiate cytotoxic reactions in cells and tissues. This has made PDT a useful therapeutic tool to treat several types of cancer. The technique is also highly selective because only tissues that are simultaneously exposed to the photosensitizer agent and to photoexcitation in the presence of oxygen are affected.80 However, conventional PDT agents tend to have low extinction coefficients and poor solubility in biological media (in-vivo). With their large surface areas, QDs can individually accommodate several PDT molecules simultaneously, which will enhance the local concentration and improve the effectiveness of these agents. Furthermore, by conjugating QDs to anti-cancer antibodies one can enhance the specific homing of the QD-PDT-antibody complexes onto the target tumor cells.80 QDs also have large absorption cross-sections and very high two-photon action cross-sections compared to conventional dyes (see below section 7.4). They can thus function as ‘energy-harvesting antenna’ to enhance the effective excitation of the PDT agent (via FRET) and allow excitation using NIR irradiation; the latter in particular permits easier deep-tissue penetration. There have been several examples reported to-date using QD donors coupled to PDT acceptors. They include phthalocyanine acceptors complexed to hydrophobic QDs,81,82 iridium-complex conjugated ligands,83 and meso-tetra(4-sulfonatophenyl)porphine dihydrochloride (TSPP).84In work by the Weiss group, two photosensitizers (PSs) known to generate singlet oxygen with relatively high yield, Rose bengal and chlorin e6, were tested with QDs.85 The authors first coupled the photosensitizers to a phytochelatin-related peptide via an NHS ester linkage and then used them to cap the surface of CdSe–ZnS QDs. In these conjugates, the average number of PSs per QD-conjugate was controlled by mixing with other unlabeled-peptides (mixed surface conjugates) and changing the molar ratio of peptide-photosensitizer before assembly on the QDs (Fig. 11). The authors have in particular shown that FRET-driven excitation of the photosensitizer (within the QD-conjugate) permitted high yield of singlet oxygen compared to direct excitation of the PS at the same wavelength. Detection of singlet oxygen generated from QD-PS conjugates was accomplished by measuring the phosphorescence signal at 1270 nm, while excitation of the system (at either 532 or 355 nm) was provided by an Nd:YAG multiphoton laser. For example, they measured singlet oxygen quantum yields as high as 0.31 using 532-nm excitation. In an attempt to evaluate the potential in vivo application of FRET-enhanced PDT with QD-conjugates, Bakalova and co-workers used CdSe core only QDs with an antibody specific to leukemic cells.86 The QD conjugates were first directed against Jurkat leukemic cells and after binding the cells were then diluted in culture with additional ‘normal’ lymphocytes. UV irradiation in the presence of two PDT agents, trifluorperazine and sulfonated aluminum phthalocyanine, indicated that the QD-antibody conjugates specifically-sensitized the leukemic cells and resulted in their selective destruction within a mixed cell culture. It is not clear in this case, however, whether the process is FRET enhanced or due to direct excitation of the photosensitizers, since core only CdSe QDs exhibit rather modest to weak emission in buffer media.
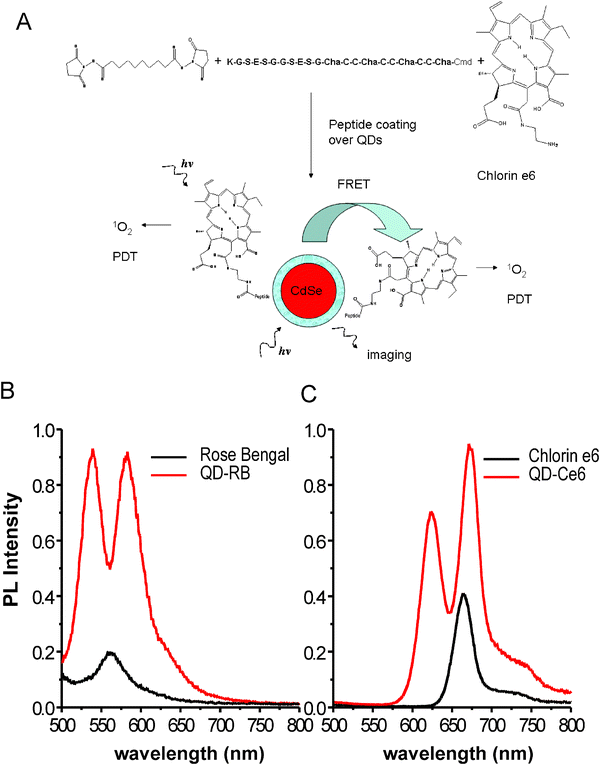 | ||
| Fig. 11 (A) Schematic representation of the QD-photosensitizer conjugates used and the proposed mechanisms for singlet oxygen generation. (B), (C) Comparison between the signals generated by the photosensitizers alone and when attached to the QD surfaces. Figure partially reproduced from ref. 85, with permission of the American Chemical Society, and kindly provided by J. Tsay. | ||
FRET-promoted sensitization of reactive chemical complexes was further exploited by Ford and co-workers as a means to enhance yield when generating nitric oxide (NO) species.87 These species are involved in cardiovascular regulation and similar to reactive oxygen species (ROS) are sensitized by photo-irradiation. CdSe–ZnS QDs donors capped with dihydrolipoic acid ligands (DHLA) were coupled with the chromium compound trans-Cr(tetraazacyclotetradecane)(ONO)2+, via electrostatic interactions between the oppositely charged QD surfaces and chromium complexes. They found that increasing the ratios of the chromium compound to QD in the sample induced a pronounced quenching of the QD PL (via energy transfer to the chromium) and generated much larger densities of NO than chromium compound alone. In particular, using 200 μM concentration of chromium compound either alone or with added QDs at 100 nM, they found that the maximum NO signal generated for the sample containing QDs was ∼one order of magnitude larger than the one generated in the absence of nanocrystals. These results indicate that NO production from the chromium compound was much faster when the QD antennas are present due to the enhanced light harvesting ability of that system; QDs alone did not generate measurable NO species.
One of the interesting aspects of using QD-based FRET to promote the generation of singlet oxygen or NO species is that QD-PS complexes can be tailored to allow treatment and imaging, since the FRET efficiency for selected QD-PS pairs can be controlled.85 For pairs with highly efficient FRET interactions, the PDT efficacy can be significantly increased, because of the large absorption cross section of the nanocrystals; the QDs would be weakly fluorescent and the system would essentially serve for enhanced PDT. For QD-photosensitizer conjugates with less efficient FRET, effective ROS generation could still be realized by increasing the number of PS acceptors. Furthermore, in this case, careful control of D–A ratio could allow efficient PDT while using the QD fluorescence signal for effective imaging of the target tissue or cells.
7. Other energy transfer configurations with QD donors
7.1 Energy transfer in QD-fluorescent protein pairs
Encouraged by the success in using organic dye acceptors with QD donors, there has been a growing interest in evaluating energy transfer to fluorescent proteins. This configuration takes advantage of the natural biocompatibility of the protein acceptors and thus offers potential for using QD-based FRET inside live cells. Two recent studies have detailed energy transfer between QD and fluorescent proteins. Dennis and Bao used polyhistidine-appended fluorescent proteins, including mOrange, tdTomato and mCherry fluorescent proteins, together with polymer encapsulated CdSe–ZnS QDs (Evident Technologies) to form their QD-protein assemblies.88 In this case, it is not clear whether the polyhistidine-binding occurs via direct interaction with the nanoparticle surface or complex formation onto the hydrophilic surface layer. Regardless, by exploring effects of varying the degree of spectral overlap and the protein-to-QD ratio, the authors showed that the steady-state fluorescence data can be analyzed with the framework of the Förster dipole–dipole interactions formalism as demonstrated for QD-dye pairs discussed in section 3 (see Fig. 12).88 In another comprehensive study Niemeyer and co-workers used QDs paired with enhanced yellow fluorescent proteins (QD-EYFP) and found that the QD PL loss can also be interpreted within the Förster mechanism.89 The authors further elaborated on this and explored the assembly of a three-chromophore FRET (3Ch-FRET) system to extend the range of interactions beyond the window allowed by the configuration using 2Ch-FRET (one D–A pair). Their construct consisted of CdSe–ZnS QDs capped with DHLA, EYFP, and Atto647-dye-modified DNA sequence. It was assembled stepwise using covalently-coupled EYFP-ssDNA onto QDs (via electrostatic interactions), followed by hybridization with complementary Atto647-labeled oligonucleotide (Fig. 13A). By assembling three different 2Ch-FRET subsystems (i.e., QD-EYFP, QD-Atto647, and EYFP-Atto647 pairs), where control of the exact location of the Atto647 dye away from the QD and EYFP is allowed and varying the number of EYFP-Atto647 per QD-conjugate, the authors selectively interrogated distinct FRET channels or the full relay (3-Ch-FRET) interactions. Fig. 13 shows some of the characteristics of this 3Ch-FRET system when interrogated under different conditions. The 2D scan of excitation and emission wavelengths (Fig. 13B) indicates that full relay FRET interactions occur only when the system is excited below the absorption edge of the QDs. More precisely, for λex > 550 nm only direct excitation of the Atto647 dye is realized. However, at lower excitation wavelengths, namely λex < 400 nm, where direct excitation of EYFP and dye are minimal, relay FRET from the central QD can be observed and quantified, as detailed in the 2D map or/and the spectra shown in Fig. 13B and C. For example, at λex = 372 nm, the transfer signature is strong and not concealed by direct excitation of the Atto647; the EYFP absorption is negligible at this wavelength. Conversely, for 450 < λex < 550 nm, combined excitation of the QD and EYFP takes place and FRET to the Atto647 can be delineated. This study, though complex, is very informative. It proves that extended range (up to 13 nm) of interactions can be achieved using the QD as large scaffold for immobilizing other potential FRET assemblies and using the nanocrystal to “power” them. These findings are consistent with an earlier relay FRET demonstrated by our group, not using fluorescent protein and hybridization, but rather a ligand–dye complex immobilized within the binding pocket of MBP immobilized on the QD.28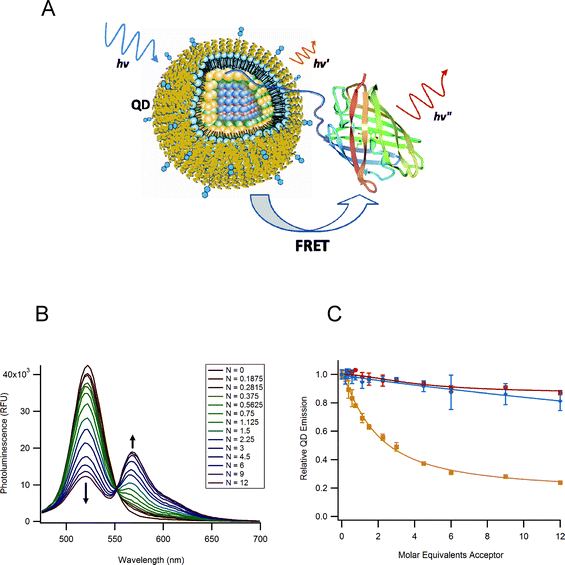 | ||
| Fig. 12 (A) Schematic diagram of the FRET interaction between a QD and a GFP-like fluorescent protein. (B) FRET results using tdTomato fluorescent protein as acceptor with 520 nm emitting QD donors; N being the average number of proteins per QD-conjugate. (C) Quenching efficiency derived from the PL integrated intensities for QDs mixed with His-appended proteins (brown squares). The data for the His-free proteins and His10-only (no fluorescent protein) controls are also shown (blue diamonds and red squares). Figure reprinted from ref. 88, with permission of the American Chemical Society, and kindly provided by G. Bao. | ||
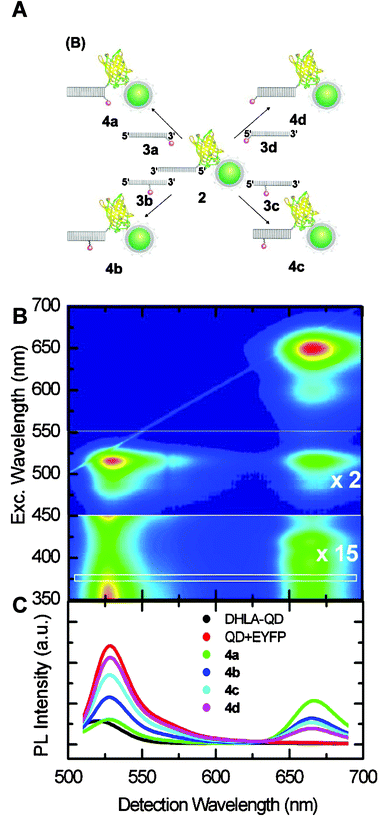 | ||
| Fig. 13 (A) Schematic representation of the 3Ch-FRET QD-EYFP-Atto647 system used. (B) Full excitation-emission characteristics of 3Ch-FRET systems, as exampled by 2D-PLE (photoluminescence excitation) analysis of system 4b. For λ > 550 nm direct excitation contribution to Atto647 emission is measured. For 450 nm < λ < 550 nm part (enhanced 2-fold) shows the transfer from the QD/EYFP subsystem to Atto647. The bottom part (enhanced 15x) simultaneously shows direct Atto647 excitation, QD-Atto647 FRET transfer, and the relay 3-Ch QD-EYFP-Atto647 transfer. (C) PL spectra using λex = 372 nm (white box in part B) for the various constructs DHLA-QD, QD/EYFP, and conjugates 4a–d shown in (A). Figure reprinted from ref. 89, with permission of the American Chemical Society, and kindly provided by C. Niemeyer. | ||
7.2 Bioluminescent energy transfer to QD acceptors
Bioluminescence is a photon generating process that can be produced by a living organisms (such as bacteria), and is the result of a chemical reaction. In this process, chemical energy is transformed to radiative (photon) energy. Bioluminescence resonance energy transfer (BRET) exploits this initial chemical process to transfer the generated excitation energy non radiatively to a proximal fluorescent acceptor.90 A common BRET configuration, for example, consists of an enzyme that chemically catalyzes the reaction of a substrate, such as the oxidation of coelenterazine mediated by a Renilla reniformis luciferase (donor), brought into close proximity with an emitting fluorophore (acceptor). This configuration is ideally suited for luminescent QDs, as it eliminates the difficulties encountered in using QDs as acceptor fluorophores, primarily associated with their high direct photo-excitation and rather long exciton lifetime.45 The most representative BRET study using QD acceptors was reported by Rao and co-workers, where an optimized 8-mutation variant of luciferase (Luc8) with improved catalytic efficiency was selected as donor.91 Using the QD as a scaffold, the authors coupled an average of 6 Luc8 to COOH-modified 655-nm emitting QDs using EDC coupling chemistry. Addition of coelenterazine substrate to the dispersion produced a strong emission centered at 655 nm (QD peak emission), in addition to the one at 480 nm characteristic of Luc8 (see Fig. 14). To extract a measure for the energy transfer efficiency of this process, the authors defined a BRET ratio between the QD (A) and the Luc8 (D) emissions, similar to FRET efficiency. They found that the BRET ratio was sensitive to both changes in D–A separation distance and the overall ‘spectral overlap’ between Lu8 emission and QD absorption; redder emitting QDs and closer proximity provided more efficient transfer rate. Furthermore, the authors showed that by coupling the same enzyme simultaneously to QDs with distinct emissions ranging between 605 nm an 800 nm, composite emissions from all QDs could be measured following addition of the substrate (i.e., multiplex BRET). They also tested BRET within these conjugates in cell lines and in vivo within mice tissues, and showed that after addition of the substrate complex to cell cultures loaded with QD-Luc8, luminescence spectra characteristic of the QD combination used could be collected and deconvoluted. High signal-to-background ratios could also be measured when performing in vivo imaging in mice even with small amounts of QD-Luc8 conjugates.91 These demonstrations potentially open up the possibility of creating self-illuminating QD sensors capable of monitoring in vivo processes.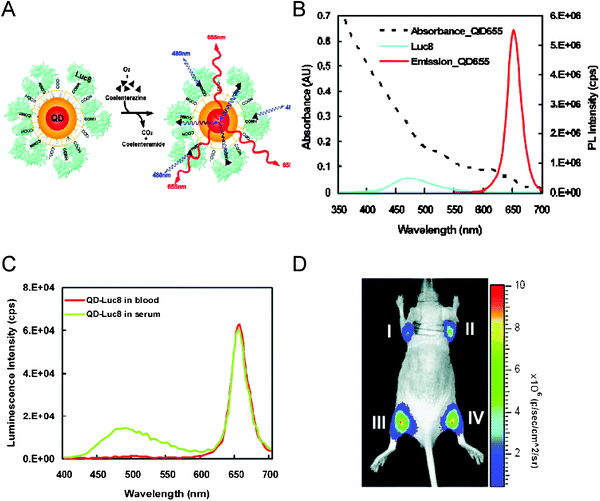 | ||
| Fig. 14 (A) Schematic representation of the BRET interactions using Luc8 donor. The Luc8-catalyzes oxidation of coelenterazine chemically generates excitation energy which is transferred to the proximal QDs. (B) Absorption and emission spectra of 655-nm emitting QDs together with the bioluminescence spectrum of coelenterazine substrate. (C) Bioluminescent emission from Luc8-QD conjugates in blood or serum. (D) Multiplexed in vivo imaging of select conjugates injected intramuscularly; I-QD800nm-Luc8, II-QD705nm-Luc8, III-QD655/QD705/QD800nm-Luc8, IV-QD655nm-Luc8. Figures partially reproduced from reference 91, with permission of NPG, and kindly provided by J. Rao. | ||
The same group tested the ability of these conjugates combined with BRET interactions to sense proteolytic activity. For this, they recombinantly modified Luc8 protein by expressing a C-terminal protease-recognized cleavage sequence along with a His6-tag; the latter was used for self-assembly on CdSe–ZnS QDs.92 They found that addition of the specific matrix metalloproteinase-2 to a pre-assembled QD-Luc8-His conjugate significantly reduced the measured BRET ratio. This was attributed to cleavage of the appended peptidyl-linkage removing the Luc8 away from the QD and reducing BRET interactions, similar to what was observed using QD-peptide-dye substrates.39 A derivative of this sensing construct used luciferase coupled to a DNA sequence (probe), which was allowed to hybridize to a complementary sequence (capture) conjugated to the QD. The authors traced changes in the BRET signature of the preassembled construct when exposed to competing amounts of exogenous DNAs.93 Additional reports expanded this design to include horseradish peroxidase enzyme coupled with the chemical substrate luminol as the light generating-donor paired with CdTe QD acceptors.94 As discussed in section 4.1, the possibility of arraying multiple copies of the substrate around the same nanocrystal combined with the QDs high extinction coefficients (∼2![[thin space (1/6-em)]](https://www.rsc.org/images/entities/char_2009.gif) 000000 M−1 cm−1) make these nanocrystals very effective for ‘harvesting’ the bioluminescent emission. In addition, this process can be realized with a broad range of QDs with emissions extending from the visible to the near-IR region of the optical spectrum. BRET with QDs could also be very useful for in vivo and deep-tissue imaging by combining it with far red to near-IR emitting QDs, as this region of the optical spectrum coincides with the optimal tissue transparency window, where tissue auto-fluorescence and absorption are reduced. As a potential sensing tool BRET can also benefit from the wide range of mutated Luc enzymes available where control over the substrate emission can also be achieved.95
000000 M−1 cm−1) make these nanocrystals very effective for ‘harvesting’ the bioluminescent emission. In addition, this process can be realized with a broad range of QDs with emissions extending from the visible to the near-IR region of the optical spectrum. BRET with QDs could also be very useful for in vivo and deep-tissue imaging by combining it with far red to near-IR emitting QDs, as this region of the optical spectrum coincides with the optimal tissue transparency window, where tissue auto-fluorescence and absorption are reduced. As a potential sensing tool BRET can also benefit from the wide range of mutated Luc enzymes available where control over the substrate emission can also be achieved.95
7.3 Quantum dot donors paired with gold nanoparticle acceptors
The mechanism involved in the PL quenching of dyes and QDs alike by proximal gold nanoparticles (Au-NPs) has been the subject of much recent debate. Regardless of the exact mechanism involved, quenching by Au-NPs was shown to apply to a wide range of emitting dyes and to extend over separation distances that exceed those permitted by the conventional Förster dipole–dipole interactions.25,35,96–98 Furthermore, since Au-NPs can be synthesized with sizes ranging from several Au atoms (clusters) to large 100-nm colloids with concomitant increases in the plasmonic absorption, further control over the rate of donor quenching can be realized.96 There have been a few examples reported in the literature where long-range quenching of QD PL in QD-protein/peptide-Au-NP conjugates was used to assemble specific sensors.In one study Kim and co-workers combined Au-NP-induced QD PL quenching with an inhibition assay to detect the presence of avidin and protein glycosylation.99,100 In a preliminary demonstration they showed that mixing biotinylated Au-NPs with Streptavidin-QDs resulted in efficient quenching of QD PL due to formation of QD-Au-NP conjugate pairs, and that this quenching was more effective than that measured with dye acceptors in the same construct.99 However, if increasing concentration of soluble avidin was added (together with biotin-Au-NPs) it competed for binding to the QDs, and resulted in reduced rates of QD PL quenching. In a follow up well formulated study, they developed an inhibition assay to detect protein glycosylation based on changes in the rate of energy transfer between carbohydrate-conjugated QDs and lectin-conjugated Au-NPs (Fig. 15).100 For this, Au-NPs were conjugated to concanavalin A (conA), a lectin with high-affinity binding to manno- and gluco-oligosaccharides, while polymer encapsulated and amine-functionalized QDs (Invitrogen) were conjugated to dextran (polymerized glucose). The target saccharides were detected by assessing their ability to compete with QD-dextran conjugate for interactions with conA and prevent QD-dextran-conA-Au-NP complex formation. By monitoring changes in the measured rates of quenching when adding an increasing concentration of conA-Au-NPs to a solution of QD-dextran conjugates, the authors extracted a measure for the apparent binding constant (for dextran-to-conA) Ka∼ 6.7 × 10⁷ M−1. This construct was then applied to probe differences between avidin and its non-glycosylated derivative Neutravidin, and between bovine serum albumin (BSA) and its chemically neoglycosylated form, 22-MB (BSA–a-d-mannopyranosylphenyl isothiocyanate with 22 mannose units per BSA). In both cases, inhibition of the QD-dextran-ConA-Au-NP binding reflected in a large reduction in the rate of QD PL quenching and its dependence on the target concentration was observed only for the glycosylated proteins (avidin and 22-MB), indicating that specificity of the conA protein was maintained. Furthermore, with 22 mannose units per BSA, the inhibition efficiency of 22-MB was significantly higher than that of avidin (Fig. 15). They further expanded the utility of this detection format to test the ability of the QD-dextran and conA-Au-NP pair to differentiate between glycoproteins having different glycan density profiles per molecule. They used recombinant glucose oxidases produced from several different yeast strains and expressing different lengths of mannose glycans and found that indeed changes in the QD PL quenching signature closely traced the number of glycan groups present on each glucose oxidase.100
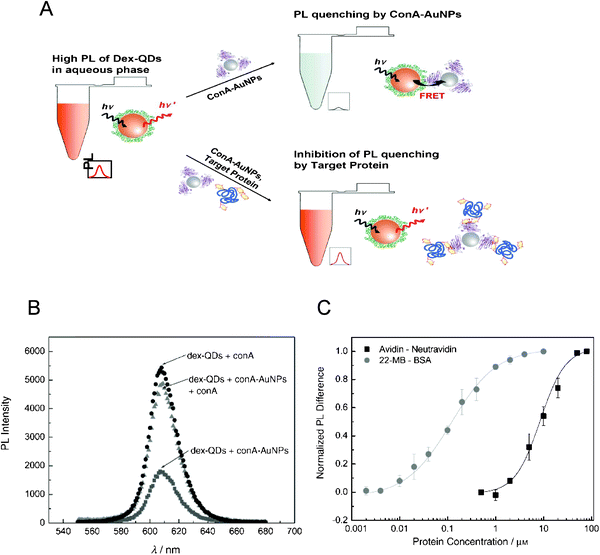 | ||
| Fig. 15 (A) Schematic of the sensor used for the detection of protein glycosylation. When unperturbed QD-dex and conA-Au-NP assemble, resulting in QD PL loss due to energy transfer. Addition of a glycoprotein inhibits the association between dex-QD and conA-Au-NP and reduces the degree of PL quenching. (B) PL spectra of free dex-QDs, dex-QDs mixed with conA-Au-NPs, and dex-QDs mixed with conA-Au-NPs in the presence of free conA (5 μM). (C) Normalized PL differences between quenched and unquenched control samples for avidin-NeutrAvidin and 22-MB-BSA systems. Figures partially reproduced from ref. 100, with permission from Wiley-VCH Verlag GmbH & Co. KGaA, and kindly provided by E. Oh. | ||
In another study, Liu and co-workers exploited the recognition between two-color QD-aptamer conjugates and Au-NP-conjugated DNA sequences complementary to two non-recognition regions within the aptamers to devise a two-plex assay capable of discriminating between two disparate analytes in the same sample.101 For this, the authors assembled 525-nm and 585-nm emitting Streptavidin-QD with two biotinylated aptamer sequences one specific for the nucleotide adenosine and the other for the narcotic cocaine. In parallel two thiolated-DNA sequences complementary to two different non-recognition regions within the aptamers were assembled on 13-nm Au-NPs. These DNA sequences bridged the Au-NPs with the QD-aptamers. Analysis was then performed using a mixture of the two QD-aptamer conjugates in the same sample to test for the ability to detect single analyte or a mixture of the two. They found that sample exposure to adenosine or cocaine elicited specific response from the corresponding QD-aptamers, while adding both targets produced PL recovery of both QD colors. Furthermore, they showed that exposure of the mixed sensors to adenosine analogs such as cytidine and uridine did not elicit any response, demonstrating sensor specificity. This study again confirms that the most effective current format for implementing multiplexed FRET is to use multiple QD donors in conjunction with the same acceptor (as discussed in section 4.5). The sensing scheme described in this study, however, does not utilize simple hybridization schemes and further relies on two indirect (or secondary) hybridizations, which could make it somewhat tedious to implement.
There have been a few additional studies using changes in the rate of QD PL quenching by proximal AuNP, coupled via a peptide, an aptamer, an DNA sequence to sense protease digestion or DNA hydridization.102,103 Attempts aimed at using these sensing constructs while tethered to a surface using Streptavidin-functionalized and a biotin-linker, were reported. This indicates that these assemblies could potentially be developed for screening assays of DNA sequence pools and under flow conditions.
7.4 Energy transfer driven by two-photon excitation of QD-dye pairs
QDs have very high two-photon (2P) action cross sections (e.g., 8-20000 Goppert-Mayer-GM units at 800 nm excitation for CdSe–ZnS nanocrystals), ∼2–3 orders of magnitude larger than the best available dyes, which make them excellent candidates for in vivo 2P fluorescence imaging.68,104 Indeed, it has been shown that two-photon fluorescence using QDs allow visualization of vasculature hundreds of micrometers deep through the skin of living mice.104 The strong difference between the 2P action cross-section measured for dots and dyes could be extremely beneficial to FRET driven by 2P excitation and applied to QD-dye pairs. In particular, it could provide data with dye emission that result purely from energy transfer (i.e., negligible direct excitation contribution). Using the same self-assembled QD-MBP-dye conjugates discussed above (section 4), we demonstrated that there is a full equivalence between FRET processes driven by either 1- or 2P excitation (see Fig. 16 and ref. 68). This was confirmed by 2P-driven excited-state lifetime measurements, where a shortening of the donor lifetime was measured for QD-MBP-dye conjugates.68 This equivalence between the FRET signatures under either excitation modes is in agreement with Kasha’s rule, which states that fluorescence occurs from the lowest energy electronic excited state.105 That is also the state involved in the non-radiative transfer of excitation energy. The relaxation rates of the higher excited to the lowest excited state are much faster than those due to energy transfer. These experiments also confirmed that the direct excitation contribution to the acceptor emission is essentially negligible (under 2P excitation), with all the collected dye emission resulting solely from energy transfer. This finding is especially beneficial for intracellular FRET-based sensing and imaging as it can exploit the vast disparity between the 2P fluorescence efficiencies of QDs and dyes to provide FRET signatures with negligible background contribution (compared to the configuration using 1P excitation).68 This sensing format could also benefit from the use of far red and IR excitation, which can allow deep tissue penetration, because it coincides with the tissue transparency window.104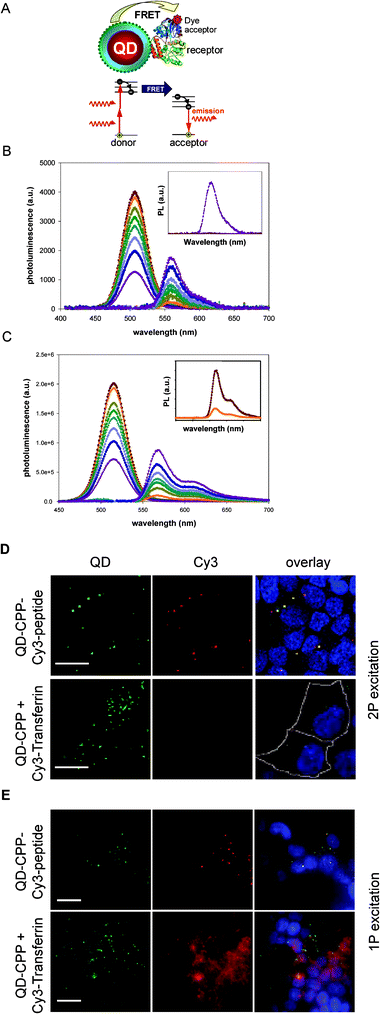 | ||
| Fig. 16 (A) Schematic of a QD-conjugate and FRET driven by a two-photon excitation. (B) Deconvoluted PL spectra of QDs and Cy3 versus number of MBP-Cy3 per QD using 2P excitation; inset shows comparison between FRET-induced Cy3 PL (purple) and direct 2P excitation collected for a control MBP-Cy3 sample (crimson). (C) Deconvoluted PL spectra of QDs and Cy3 using 1P excitation, along with comparison between FRET-emission and direct excitation contribution, similar to what was shown in B. (D) Two-photon fluorescence microscopy images of HEK 293T/17 cells incubated with QD-CPP/peptide-Cy3 (top panel) and QD-CPP mixed with free Cy3-transferrin (bottom panel). QD staining is located outside of the cell nuclei and within endosomal compartments as demonstrated by the overlaid image. Representative cell membranes are outlined in white. (λ2Pex = 840 nm, scale bar = 20 μm). (E) One-photon fluorescent images of HEK 293T/17 cells corresponding to the conditions above in D (λex = 488 nm, scale bar = 20 μm). Figures reprinted from ref. 68, with permission of Wiley-VCH. | ||
To demonstrate this premise, we investigated the intracellular stability of self-assembled QD-peptide conjugates using 2P fluorescent microscopy.68 Green-emitting QDs were simultaneously self-assembled with cell-penetrating peptides (CPP) and Cy3-labeled peptides with average ratios of 60 CPPs and 2 Cy3-labeled peptides per QD; CPP facilitated cellular uptake via endocytosis.106 HEK 293T/17 cell cultures were incubated with variations of these conjugates (QD-CPP, QD-CPP/peptide-dye) mixed with Cy3-labeled transferrin as an endosome marker before image collection. The epifluorescent images in Fig. 16 show a few important findings: under 2P-excitation, there is perfect colocalization of QDs and Cy3 signal due to efficient FRET from QDs to Cy3 for cells incubated with QDs coupled to CPP and peptide-Cy3. In comparison, cells separately stained with a mixture of Cy3-labeled transferrin (Tf-Cy3) and QD-CPP do not show any Cy3 fluorescence; no FRET interactions present. Under 1P excitation, however, the cells showed bright Cy3 fluorescence when incubated with either separate mixtures of CPP-QD and Tf-Cy3 as above or with QD-CPP/Cy3 conjugates. This clearly indicates that significant Cy3 emission due to direct excitation occurred in the 1P excitation mode, which can make it difficult to discern FRET-induced Cy3 emission from that due to direct excitation. However, absence of direct excitation of the acceptor in a 2P excitation mode (even at molar excess of the dye) confirms the unique advantage of 2P excited FRET using QD donors. 2P excitation can unambiguously probe co-localized fluorophores and confirm efficient energy transfer from QDs to dyes.
8. Single molecule fluorescence energy transfer
Performing energy transfer experiments at the single molecule level can allow one to access subtle details that are often averaged and screened out when analyzing macroscopic samples. When applied to biological systems it permits one to collect and resolve real-time changes in individual protein conformation in response to a biological stimulus, or during ligand–receptor interactions. There are two commonly used single particle FRET configurations. The first and most obvious uses immobilized QD-bioconjugates. However, carrying out single particle FRET experiments on immobilized specimens remains particularly difficult to implement due to issues associated with photo-bleaching and photo-degradation of the fluorophores when exposed to sustained irradiation. Moreover, the intermittent nature of single QD emission remains a serious obstacle to quantitatively monitor the evolution of FRET efficiency with time. The second configuration probes freely diffusing donor–acceptor assemblies in solution (solution-phase single particle FRET, spFRET) and utilizes confocal microscopy. By probing freely diffusing QD-bioconjugates some of the limitations encountered by immobilized conjugates are circumvented. For example, it reduces issues associated with the single QD intermittent emission and photo-bleaching of the dye, because it limits the specimen excitation to the residence time within the illuminated volume. It is, however, more suited for solution samples and cannot allow extended probing of the same specimen (e.g., a molecule or a conjugate).The first configuration was recently utilized to probe single molecule dynamics of DNA Holliday junctions in immobilized QD-oligonucleotide conjugates.107 This four DNA strand assembly is structurally polymorphic, and its conformation fluctuates between two different forms depending on the environment conditions, e.g., the nature and concentration of counterion excess (salts). In the absence of multivalent ions and at low salt concentration, the junction has an open form, which minimizes the repulsion between charged phosphates at the junction. When the salt concentration increased or/and in the presence of multivalent cations, effects of electrostatic repulsions are reduced and the junction folds into one of two stacked conformers. The authors labeled one of the DNA strand with a dye acceptor and the other with a QD. They carried out time-trace fluorescence experiments at pH 7.5 and in Tris:HCl buffer where conformational transition between states are slow enough to allow resolution of the fluorescence signals on a CCD camera (∼100 ms). Overall, their findings confirmed that conformational changes of these junctions with time were reflected in the time-dependent changes in the single molecule FRET efficiency measured between the QD and dye.
Solution-phase spFRET is most commonly implemented experimentally by using a confocal microscope and a highly focused laser beam for specimen excitation. The sample excitation is limited to the focal volume of a high numerical aperture objective. When excited the sample emits bursts of PL intensities from the donor, ID, collected on the donor channel, and the acceptor, IA, collected on the acceptor channel, (see experimental step up in Fig. 17). The spFRET signature can be defined by the ratio:
 | (9) |
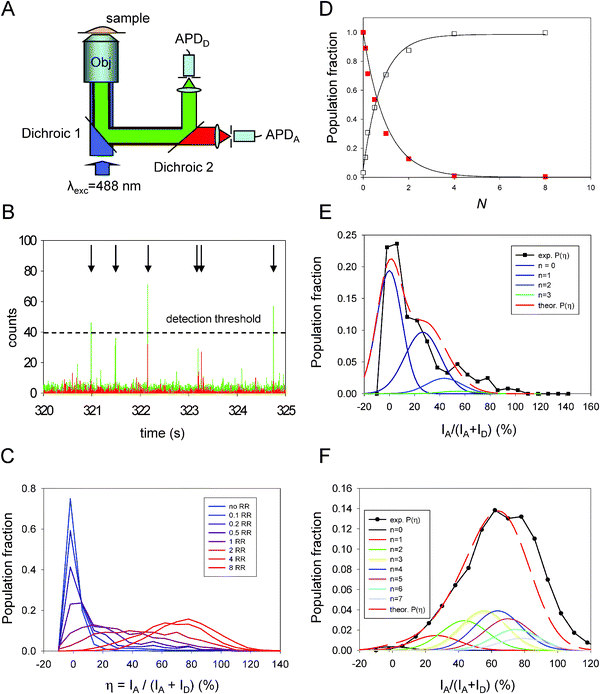 | ||
| Fig. 17 (A) Schematics of the confocal microcopy set up used for implementing solution-phase spFRET. (B) Example of superimposed donor (green) and acceptor (red) time traces. Only bursts with the sum of both signals exceeding the threshold level (indicated by arrows) can be used for analysis. (C) Emission ratio distributions as a function of the acceptor-to-QD ratio for QD-MBP-RR conjugates. (D) Fraction of QDs without any acceptors or “zero valence” (η<10%, no FRET; squares) together with that engaged in FRET (η > 15%; empty squares) as a function of N, the average number of RR acceptors per QD. The fits correspond to the Poisson distribution p(N,0) ∼ exp(−N) and 1 −p(N,0). (E) Comparison between experiment and theory for the distribution fractions versus η for N = 0.5 and N = 4 (F). Figure partially reproduced from reference 40, with permission from the American Chemical Society. | ||
In one example, our group used spFRET to characterize the heterogeneity of QD-bioconjugates and to gain information about the distribution in conjugate valence.40 The conjugates were formed by self-assembling average numbers of MBP labeled with rhodamine red (RR) onto CdSe–ZnS QDs capped with dihydrolipoic acid (DHLA) ligands. As stated previously, heterogeneity in conjugate valence arises from the large surface area of these nanoparticles regardless of the conjugation strategy used (see section 4.1). In particular, we examined the influence of varying the acceptor-to-donor ratio on the spFRET signature. While keeping the average total number of proteins self-assembled to a QD fixed, we discretely varied the average fraction of dye-labeled-to-unlabeled proteins. Our results showed that indeed within a macroscopically homogeneous sample, heterogeneity in valence is intrinsic to individual self-assembled QD-protein conjugates. More importantly it was shown that the number of acceptors per QD (overall valence) followed a Poisson distribution, where the probability of finding a conjugate having exactly n acceptors for a sample with a nominal number of protein-dye per QD, N, obeys the relation (see section 4.1):40
| p(N,n) = Nn exp(−N)/n! | (10) |
In the other example, solution-phase spFRET was utilized by Wang and co-workers to achieve sensitive detection of a target DNA sequence (Fig. 18).108 The authors started with two probes (reporter and capture) which were designed to have complementary sequences to two different sections of a target sequence. The ‘reporter probe’ labeled with an organic dye acceptor and the ‘capture probe’ labeled with biotin were mixed with the DNA sample to be analyzed. This produced a simultaneous hybridization with the target DNA (as shown in Fig. 18A and B). When these pre-assembled reporter, probe and target complexes were mixed with streptavidin-QDs the sandwich structures bound to the QD surface, which brought several Cy5 dyes in close proximity to the QD and promoted FRET interactions. The solution was then introduced into a glass microcapillary and flowed through a small observation volume where fluorescence signals from individual bioconjugates could be detected. Detection of simultaneous bursts from QD emission (ID) and Cy5 fluorescence (IA), and analysis of the population fraction vs. η provided proof of QD-DNA complex formation and offered a means of detecting the target sequence. The authors showed that this assay format with QD donors provided much higher sensitivity than a conventional dye-based molecular beacon.108 In a similar assay format, Zhang and Johnson found that an increase in the flow velocity in the microcapillary could slightly increase the measured FRET efficiency.109 This effect was attributed to the DNA deformation in the capillary stream which brought the dye acceptor in closer proximity to the QD donor.
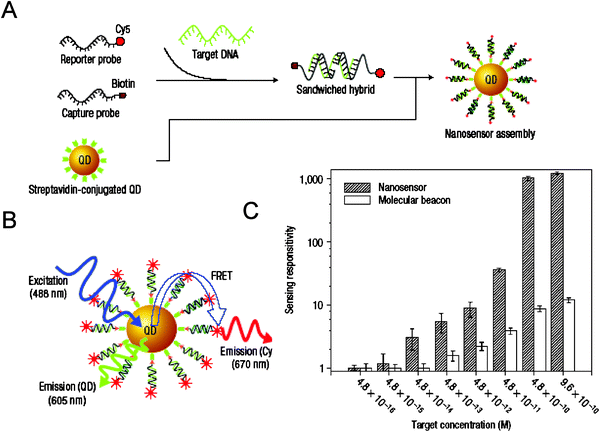 | ||
| Fig. 18 (A) Conceptual scheme showing the formation of a sensing assembly in the presence of targets. (B) Fluorescence emission from Cy5 on illumination of QD caused by FRET between QD and Cy5 acceptors in the assembly. (C) Side-by-side comparison between sensing responses vs. target concentration measured using spFRET and a molecular beacon. Figure adapted from ref. 108 and reprinted with permission of NPG. | ||
In a subsequent study, Zhang and Johnson applied spFRET as a means to quantify the interactions between a specific peptide on the Rev protein (Rev-peptide) and the Rev responsive element within the RNA gene (RRE-RNA) and to identify/characterize potential inhibitors. This extends the ensemble study already discussed in section 6.1 to a single molecule configuration.110 In particular, the authors demonstrated that the stoichiometry of Rev-peptide binding to RRE-RNA sequence can be accurately determined using spFRET applied to the QD assemblies (Fig. 19). They further used this single particle configuration to quantify the inhibitory effects of proflavin on the Rev-peptide-RRE binding, even in the presence of substantial levels of interfering fluorescence from high-concentration proflavin; the latter is a blue fluorescent compound that often prevents the discrimination of FRET signals in ensemble measurements.
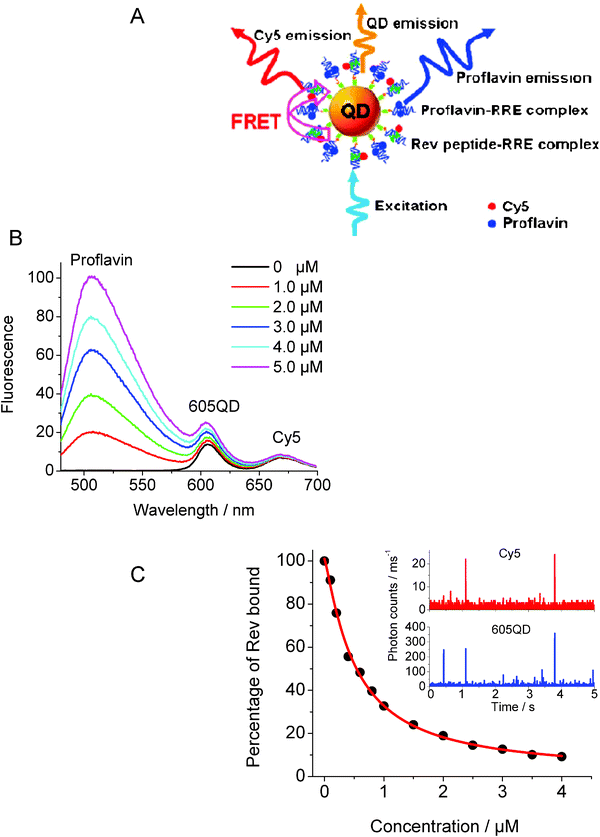 | ||
| Fig. 19 (A) Schematic representation of the single QD-conjugate assembly used to evaluate the Rev peptide-RRE interaction and the inhibition by proflavin. (B) Evolution of the fluorescence (ensemble) spectra of QD and Cy5 with increasing proflavin concentration. Reagent concentrations were 3.8 × 10⁻⁸ M for QDs, 7.6 × 10⁻⁷ M for Cy5-Rev peptide, and 7.6 × 10⁻⁷ M for RRE. (C) Progression of the percentage of bound Rev peptide with the addition of proflavin at increasing concentration, extracted from single molecule FRET data. The inset shows the representative traces of fluorescence bursts from QD and Cy5 after addition of 4.0 μM proflavin. Figure adapted from ref. 110, and reprinted with permission of the American Chemical Society. | ||
Conclusions and outlook
Clearly, the use of QD fluorophores combined with energy transfer has come a long way, since the initial reports were published. In addition, a relatively sound understanding of the most important parameters that govern energy transfer in disparate D–A pairs which include QD–QD, QD-dye, dye-QD, QD-Au-NP, and bioluminescent substrate-QD has been reached. The majority of studies published in the field have focused on the use of QDs as exciton donor with dye acceptors, where these inorganic fluorophores have provided the biggest advantages. The most effective and most ’practical’ of these advantages include the ability to enhance measured FRET efficiencies by arraying multiple dye acceptors, a drastic reduction in the direct excitation contribution of the acceptor dye to the overall measured fluorescence, and the option of selecting a QD emission that coincides with the absorption peak of a target dye. The first two features are also crucial for implementing single molecule FRET, where reduced acceptor contribution substantially improves signal-to-noise ratios while concomitantly simplifying data deconvolution and subsequent analysis.The number of studies and sensors that have applied QD-based FRET in a biological context has grown tremendously in the past five years (although not all referenced in this review). Systems explored to-date include detection of oligonucleotides via hybridization, target recognition by aptamers, pH sensing, detection of small and large molecular targets (nutrients, explosives, proteins), and detection of active proteolysis. Clearly the field is far from saturation. Further developments will benefit from addressing some of the technical constraints commonly encountered when working with inorganic fluorophores. Choice of surface ligands used to promote their transfer to aqueous media, the potential effects of donor–acceptor separation distance on the rates of FRET and their implications for sensor development will continue to be actively explored. The key guiding features will be high quantum yield, long term stability over a broad range of pH and salt conditions, and overall compactness of the hydrophilic QDs and their conjugates.
One of the most promising uses of QD-conjugates and FRET is the potential they offer for intracellular sensing. Indeed, there are several biological processes that occur inside live cells (protein-interactions, enzymatic activity, ion fluxes in response to external stimuli) where use of QDs combined with energy transfer as a transduction mechanism, using both ensemble and single molecule configurations, has the potential to provide clear advantages. For example, 2P-driven FRET with QDs can provide significant improvements because the long wavelength excitation utilized coincides with the tissue transparency window. In addition, the potential to uniquely enable multiplex sensing scenarios inside cells can allow insights into how complex cellular processes are correlated. The primary hurdle thus far has been the lack of simple methods that can consistently deliver QD-assemblies to specific intracellular compartments. There are several approaches currently being tested and refined, including the use of cell penetrating peptides, utilization of lipid transfection reagents, direct microinjection, and electroporation.106,111,112 Once reproducible and easy to implement solutions to this problem are developed one should expect that the significant progress made for in vitro demonstrations will be implemented inside cells. This will certainly improve intracellular sensing based on FRET interactions.
Acknowledgements
The authors acknowledge NRL, and the CB Directorate/Physical S&T Division, DTRA for support.References
- J. R. Lakowicz, Principles of Fluorescence Spectroscopy, Springer, New York, 2006 Search PubMed.
- A. Miyawaki, Dev. Cell, 2003, 4, 295 CrossRef CAS.
- E. Jares-Erijman and T. Jovin, Nat. Biotechnol., 2003, 21, 1387 CrossRef CAS.
- K. E. Sapsford, L. Berti and I. L. Medintz, Angew. Chem., Int. Ed., 2006, 45, 4562 CrossRef CAS.
- A. R. Clapp, I. L. Medintz and H. Mattoussi, ChemPhysChem, 2005, 7, 47.
- X. Michalet, F. Pinaud, T. D. Lacoste, M. Dahan, M. P. Bruchez, A. P. Alivisatos and S. Weiss, Single Mol., 2001, 2, 261 CAS.
- I. Medintz, H. Uyeda, E. Goldman and H. Mattoussi, Nat. Mater., 2005, 4, 435 CrossRef CAS.
- A. P. Alivisatos, W. Gu and C. A. Larabell, Ann. Rev. Biomed. Eng., 2005, 7, 55 CrossRef CAS.
- P. Alivisatos, Nat. Biotechnol., 2004, 22, 47 CrossRef.
- J. M. Klostranec and W. C. W. Chan, Adv. Mater., 2006, 18, 1953 CrossRef CAS.
- C. B. Murray, D. J. Norris and M. G. Bawendi, J. Am. Chem. Soc., 1993, 115, 8706 CrossRef CAS.
- B. O. Dabbousi, J. Rodriguez-Viejo, F. V. Mikulec, J. R. Heine, H. Mattoussi, R. Ober, K. F. Jensen and M. G. Bawendi, J. Phys. Chem. B, 1997, 101, 9463 CrossRef CAS.
- C. B. Murray, C. R. Kagan and M. G. Bawendi, Ann. Rev. Mater. Sci., 2000, 30, 545 CrossRef CAS.
- Z. A. Peng and X. Peng, J. Am. Chem. Soc., 2001, 123, 183 CrossRef CAS.
- M. Nirmal, B. O. Dabbousi, M. G. Bawendi, J. J. Macklin, J. K. Trautman, T. D. Harris and L. E. Brus, Nature, 1996, 383, 802 CrossRef CAS.
- M. Kuno, D. P. Fromm, H. F. Hamann, A. Gallagher and D. J. Nesbitt, J. Chem. Phys., 2001, 115, 1028 CrossRef CAS.
- M. K. Kuno, D. P. Fromm, S. T. Johnson, A. Gallagher and D. J. Nesbitt, Phys. Rev. B, 2003, 67, 125304 CrossRef.
- M. Dahan, S. Levi, C. Luccardini, P. Rostaing, B. Riveau and A. Triller, Science, 2003, 302, 442–445 CrossRef CAS.
- T. Pons, H. T. Uyeda, I. L. Medintz and H. Mattoussi, J. Phys. Chem. B, 2006, 110, 20308 CrossRef CAS.
- W. J. Parak, T. Pellegrino and C. Plank, Nanotechnology, 2005, 16, R9 CrossRef CAS.
- C. A. Woolhead, P. J. McCormick and A. E. Johnson, Cell, 2004, 116, 725 CrossRef CAS.
- A. Miyawaki, O. Griesbeck, R. Heim and R. Y. Tsien, Proc. Natl. Acad. Sci. U. S. A., 1999, 96, 2135 CrossRef CAS.
- M. Fehr, W. B. Frommer and S. Lalonde, Proc. Natl. Acad. Sci. U. S. A., 2002, 99, 9846 CrossRef CAS.
- S. Lalonde, D. W. Ehrhardt and W. B. Frommer, Curr. Opin. Plant Biol., 2005, 8, 574 CrossRef CAS.
- Z. Gueroui and A. Libchaber, Phys. Rev. Lett., 2004, 93, 166108 CrossRef.
- A. R. Clapp, I. L. Medintz, J. M. Mauro, B. R. Fisher, M. G. Bawendi and H. Mattoussi, J. Am. Chem. Soc., 2004, 126, 301 CrossRef CAS.
- R. Gill, I. Willner, I. Shweky and U. Banin, J. Phys. Chem. B, 2005, 109, 23715 CrossRef CAS.
- I. L. Medintz, A. R. Clapp, H. Mattoussi, E. R. Goldman, B. Fisher and J. M. Mauro, Nat. Mater., 2003, 2, 6300.
- A. L. Efros and M. Rosen, Annu. Rev. Mater. Sci., 2000, 30, 475 CrossRef CAS.
- S. Higashiya, N. I. Topilina, S. C. Ngo, D. Zagorevskii and J. T. Welch, Biomacromolecules, 2007, 8, 1487 CrossRef CAS.
- N. I. Topilina, S. Higashiya, N. Rana, V. V. Ermolenkov, C. Kossow, A. Carlsen, S. C. Ngo, C. C. Wells, K. S. Bousman, E. T. Eisenbraun, I. K. Lednev, R. E. Geer, A. E. Kaloyeros and J. T. Welch, Biomacromolecules, 2006, 7, 1104 CrossRef CAS.
- I. K. Lednev, V. V. Ermolenkov, S. Higashiya, L. A. Popova, N. I. Topilina and J. T. Welch, Biophys J., 2006, 91, 3805 CrossRef CAS.
- I. L. Medintz, K. E. Sapsford, A. R. Clapp, T. Pons, S. Higashiya, J. T. Welch and H. Mattoussi, J. Phys. Chem. B, 2006, 110, 10683 CrossRef CAS.
- K. E. Sapsford, T. Pons, I. L. Medintz, S. Higashiya, F. M. Brunel, P. E. Dawson and H. Mattoussi, J. Phys. Chem. C, 2007, 111, 11528 CrossRef CAS.
- T. Pons, I. L. Medintz, K. E. Sapsford, S. Higashiya, A. F. Grimes, D. S. English and H. Mattoussi, Nano Lett., 2007, 7, 3157 CrossRef CAS.
- G. D. Scholes, Annu. Rev. Phys. Chem., 2003, 54, 57 CrossRef CAS.
- C. Curutchet, A. Franceschetti, A. Zunger and G. D. Scholes, J. Phys. Chem. C, 2008, 112, 13337.
- G. Allan and C. Delerue, Phys. Rev. B, 2007, 75, 19531–1.
- I. L. Medintz, A. R. Clapp, F. M. Brunel, T. Tiefenbrunn, H. T. Uyeda, E. L. Chang, J. R. Deschamps, P. E. Dawson and H. Mattoussi, Nat. Mater., 2006, 5, 581 CrossRef.
- T. Pons, I. L. Medintz, X. Wang, D. S. English and H. Mattoussi, J. Am. Chem. Soc., 2006, 128, 15324 CrossRef CAS.
- I. Chung, K. T. Shimizu and M. G. Bawendi, Proc. Natl. Acad. Sci. U. S. A., 2004, 100, 405.
- A. R. Clapp, I. L. Medintz, H. T. Uyeda, B. R. Fisher, E. R. Goldman, M. G. Bawendi and H. Mattoussi, J. Am. Chem. Soc., 2005, 127, 18212 CrossRef CAS.
- H. Mattoussi, A. W. Cumming, C. B. Murray, M. G. Bawendi and R. Ober, Phys. Rev. B, 1998, 58, 7850 CrossRef CAS.
- C. R. Kagan, C. B. Murray, M. Nirmal and M. G. Bawendi, Phys. Rev. Lett., 1996, 76, 1517 CrossRef CAS.
- A. R. Clapp, I. L. Medintz, B. R. Fisher, G. P. Anderson and H. Mattoussi, J. Am. Chem. Soc., 2005, 127, 1242 CrossRef CAS.
- N. Hildebrandt, L. J. Charbonniere, M. Beck, R. F. Ziessel and H. G. Lohmannsroben, Angew. Chem., Int. Ed., 2005, 44, 7612 CrossRef CAS.
- S. Tyagi and F. R. Kramer, Nat. Biotechnol., 1996, 14, 303 CrossRef CAS.
- V. V. Didenko, Biotechniques, 2001, 31, 1106 CAS.
- A. D. Ellington and J. W. Szostak, Nature, 1992, 355, 850–852 CAS.
- M. Levy, S. F. Cater and A. D. Ellington, ChemBioChem, 2005, 6, 1 CrossRef.
- V. Bagalkot, L. Zhang, E. Levy-Nissenbaum, S. Jon, P. W. Kantoff, R. Langer and O. C. Farokhzad, Nano Lett., 2007, 7, 3065 CrossRef CAS.
- C. Y. Zhang and L. W. Johnson, J. Am. Chem. Soc., 2006, 128, 5324 CrossRef CAS.
- W. R. Algar and U. J. Krull, Anal. Chim. Acta, 2007, 581, 193 CrossRef CAS.
- D. J. Zhou, L. M. Ying, X. Hong, E. A. Hall, C. Abell and D. Klenerman, Langmuir, 2008, 24, 1659 CrossRef CAS.
- R. Bakalova, Z. Zhelev, H. Ohba and Y. Baba, J. Am. Chem. Soc., 2005, 127, 11328 CrossRef CAS.
- F. Patolsky, R. Gill, Y. Weizmann, T. Mokari, U. Banin and I. Willner, J. Am. Chem. Soc., 2003, 125, 13918 CrossRef CAS.
- S. Feske, Nat. Rev. Immunol., 2007, 7, 690 CrossRef CAS.
- C. Randriamampita and A. Trautmann, Biol. Cell, 2004, 96, 69 CrossRef CAS.
- M. Tomasulo, I. Yildiz, S. L. Kaanumalle and F. M. Raymo, Langmuir, 2006, 22, 10284 CrossRef CAS.
- P. T. Snee, R. C. Somers, G. Nair, J. P. Zimmer, M. G. Bawendi and D. G. Nocera, J. Am. Chem. Soc., 2006, 128, 13320 CrossRef CAS.
- Y. Chen, R. Thakar and P. T. Snee, J. Am. Chem. Soc., 2008, 130, 3744 CrossRef CAS.
- Y. Chen and Z. Rosenzweig, Anal. Chem., 2002, 74, 5132 CrossRef CAS.
- K. A. Gattas-Asfura and R. M. Leblanc, Chem. Commun., 2003, 21, 2684 Search PubMed.
- C. Bo and Z. Ping, Anal. Bioanal. Chem., 2005, 381, 986 CrossRef CAS.
- K. E. Sapsford, T. Pons, I. L. Medintz and H. Mattoussi, Sensors, 2006, 6, 925 CrossRef CAS.
- M. J. Ruedas-Rama, X. Wang and E. A. H. Hall, Chem. Commun., 2007, 15, 1544 Search PubMed.
- K. C. Liao, T. Hogen-Esch, F. J. Richmond, L. Marcu, W. Clifton and G. E. Loeb, Biosensors & Bioelectronics, 2008, 23, 1458 CrossRef CAS.
- A. R. Clapp, T. Pons, I. L. Medintz, J. B. Delehanty, J. S. Melinger, T. Tiefenbrunn, P. E. Dawson, B. R. Fisher, B. O’Rourke and H. Mattoussi, Adv. Mater., 2007, 19, 1921 CrossRef CAS.
- I. L. Medintz, A. R. Clapp, J. S. Melinger, J. R. Deschamps and H. Mattoussi, Adv. Mater., 2005, 17, 2450 CrossRef CAS.
- E. Goldman, I. Medintz, J. Whitley, A. Hayhurst, A. Clapp, H. Uyeda, J. Deschamps, M. Lassman and H. Mattoussi, J. Am. Chem. Soc., 2005, 127, 6744 CrossRef CAS.
- Q. Wei, M. Lee, X. Yu, E. K. Lee, G. H. Seong, J. Choo and Y. W. Cho, Anal. Biochem., 2006, 358, 31 CrossRef CAS.
- A. Sukhanova, A. S. Susha, A. Bek, S. Mayilo, A. L. Rogach, J. Feldmann, V. Oleinikov, B. Reveil, B. Donvito, J. H. M. Cohen and I. Nabiev, Nano Lett., 2007, 7, 2322 CrossRef CAS.
- X. S. Puente and C. Lopez-Otin, Genome Res., 2004, 14, 609 CrossRef CAS.
- X. S. Puente, L. M. Sanchez, C. M. Overall and C. Lopez-Otin, Nat. Rev. Genet., 2003, 4, 544 CrossRef CAS.
- V. M. Rotello, Acs Nano, 2008, 2, 4 CrossRef CAS.
- L. Shi, N. Rosenzweig and Z. Rosenzweig, Anal. Chem., 2007, 79, 208 CrossRef CAS.
- L. F. Shi, V. De Paoli, N. Rosenzweig and Z. Rosenzweig, J. Am. Chem. Soc., 2006, 128, 10378 CrossRef CAS.
- C. J. Xu, B. G. Xing and H. H. Rao, Biochem. Biophys. Res. Commun., 2006, 344, 931 CrossRef CAS.
- Y.-P. Kim, Y.-H. Oh, E. Oh, S. Ko, M.-K. Han and H.-S. Kim, Anal. Chem., 2008, 80, 4634 CrossRef CAS.
- R. Bakalova, H. Ohba, Z. Zhelev, M. Ishikawa and Y. Baba, Nat. Biotechnol., 2004, 22, 1360 CrossRef CAS.
- A. C. S. Samia, X. Chen and C. Burda, J. Am. Chem. Soc., 2003, 125, 15736 CrossRef CAS.
- A. C. S. Samia, S. Dayal and C. Burda, Photochem. Photobiol., 2006, 82, 617–625 CrossRef CAS.
- J. M. Hsieh, M. L. Ho, P. W. Wu, P. T. Chou, T. T. Tsaih and Y. Chi, Chem. Commun., 2006, 615 RSC.
- L. X. Shi, B. Hernandez and M. Selke, J. Am. Chem. Soc., 2006, 128, 6278 CrossRef CAS.
- J. M. Tsay, M. Trzoss, L. X. Shi, X. X. Kong, M. Selke, M. E. Jung and S. Weiss, J. Am. Chem. Soc., 2007, 129, 6865 CrossRef CAS.
- R. Bakalova, H. Ohba, Z. Zhelev, T. Nagase, R. Jose, M. Ishikawa and Y. Baba, Nano Lett., 2004, 4, 1567 CrossRef CAS.
- D. Neuman, A. D. Ostrowski, R. O. Absalonson, G. F. Strouse and P. C. Ford, J. Am. Chem. Soc., 2007, 129, 4146 CrossRef CAS.
- A. M. Dennis and G. Bao, Nano Lett., 2008, 8, 1439–1445 CrossRef CAS.
- H. Lu, O. Schops, U. Woggon and C. M. Niemeyer, J. Am. Chem. Soc., 2008, 130, 4815 CrossRef CAS.
- E. A. Meighen, Microbiological Rev., 1991, 55, 123 CAS.
- M. K. So, C. J. Xu, A. M. Loening, S. S. Gambhir and J. H. Rao, Nat. Biotechnol., 2006, 24, 339 CrossRef CAS.
- H. Yao, Y. Zhang, F. Xiao, Z. Xia and J. Rao, Angew. Chem., Int. Ed., 2007, 46, 4346 CrossRef CAS.
- K. A. Cissell, S. Campbell and S. K. Deo, Anal. Bioanal. Chem., 2008, 391, 2577–2581 CrossRef CAS.
- X. Y. Huang, L. Li, H. F. Qian, C. Q. Dong and J. C. Ren, Angew. Chem., Int. Ed., 2006, 45, 5140 CrossRef CAS.
- A. M. Loening, A. M. Wu and S. S. Gambhir, Nat. Meth., 2007, 4, 641 CrossRef CAS.
- M. C. Daniel and D. Astruc, Chem. Rev., 2004, 104, 293 CrossRef CAS.
- C. S. Yun, A. Javier, T. Jennings, M. Fisher, S. Hira, S. Peterson, B. Hopkins, N. O. Reich and G. F. Strouse, J. Am. Chem. Soc., 2005, 127, 3115 CrossRef CAS.
- T. L. Jennings, J. C. Schlatterer, M. P. Singh, N. L. Greenbaum and G. F. Strouse, Nano Lett., 2006, 6, 1318 CrossRef CAS.
- E. Oh, M. Y. Hong, D. Lee, S. H. Nam, H. C. Yoon and H. S. Kim, J. Am. Chem. Soc., 2005, 127, 3270 CrossRef CAS.
- E. Oh, D. Lee, Y. P. Kim, S. Y. Cha, D. B. Oh, H. A. Kang, J. Kim and H. S. Kim, Angew. Chem., Int. Ed., 2006, 45, 7959 CrossRef CAS.
- J. Liu, J. H. Lee and Y. Lu, Anal. Chem., 2007, 79, 4120 CrossRef CAS.
- E. Chang, J. Miller, J. Sun, W. Yu, V. Colvin, R. Drezek and J. West, Biochem. Biophys. Res. Commun., 2005, 334, 1317 CrossRef CAS.
- L. Dyadyusha, H. Yin, S. Jaiswal, T. Brown, J. J. Baumberg, F. P. Booy and T. Melvin, Chem. Commun., 2005, 3201 Search PubMed.
- D. R. Larson, W. R. Zipfel, R. M. Williams, S. W. Clark, M. P. Bruchez, F. W. Wise and W. W. Webb, Science, 2003, 300, 1434 CrossRef CAS.
- M. Kasha, Discuss. Faraday Soc., 1950, 9, 14 RSC.
- J. B. Delehanty, I. L. Medintz, T. Pons, F. M. Brunel, P. E. Dawson and H. Mattoussi, Bioconjugate Chem., 2006, 17, 920 CrossRef CAS.
- S. Hohng and T. Ha, Chemphyschem, 2005, 6, 956 CrossRef CAS.
- C. Y. Zhang, H. C. Yeh, M. T. Kuroki and T. H. Wang, Nat. Mater., 2005, 4, 826 CAS.
- C.-Y. Zhang and L. W. Johnson, Angew. Chem., Int. Ed., 2007, 46, 3482 CrossRef CAS.
- C. Y. Zhang and L. W. Johnson, Anal. Chem., 2007, 79, 7775–7781 CrossRef CAS.
- A. M. Derfus, W. C. W. Chan and S. N. Bhatia, Adv. Mater., 2004, 16, 961 CrossRef CAS.
- I. L. Medintz, T. Pons, J. B. Delehanty, K. Susumu, F. Brunel, P. Dawson and H. Mattoussi, Bioconjugate Chem., 2008, 19, 1785–1795 CrossRef CAS.
| This journal is © the Owner Societies 2009 |