Phase transition pathways for the production of 100 nm oil-in-water emulsions
O.
Sonneville-Aubrun
a,
D.
Babayan
a,
D.
Bordeaux
a,
P.
Lindner
b,
Gabriel
Rata
c and
B.
Cabane
d
aL’OREAL, Skin Care Dept., B.P. 553, F 94152, Chevilly Larue cedex, France
bILL, B.P. 156, 38042, Grenoble Cedex, France
cPhysical Chemistry, Lund University, P.O.B. 124, Lund, S 22100, Sweden
dPMMH, CNRS UMR 7636, ESPCI, 10 rue Vauquelin, F 75231, Paris cedex 05, France
First published on 11th November 2008
Abstract
Oil/water emulsions can be produced through phase inversion, by adding water to a reverse water/oil microemulsion. According to small angle neutron scattering experiments and visual observations performed during phase inversion, the stages of this process are as follows: (i) upon water addition, the microemulsion gives way to a highly swollen lamellar phase; (ii) the transient lamellar phase breaks up to yield an array of droplets; (iii) the droplets loses the correlations of the lamellar phase. This emulsion is already present less than one minute after the initial addition of water, and it reaches the final size distribution in one hour. The final population of oil droplets is homogenous with a mean diameter below 100 nm.
Introduction
Water droplets may be dispersed in oil, or oil droplets dispersed in water, with the help of surfactant molecules that adsorb on the interfaces.1 In some cases the droplet sizes match the spontaneous curvature of the surfactant, which is on the order of the inverse of a molecular length: this is the case for the so-called microemulsions. These microemulsions are equilibrium states of the surfactant/oil/water system; consequently they form spontaneously upon mixing surfactant, oil and water. In most cases, however, the droplet sizes are much larger (typically beyond 1 μm) and do not match the equilibrium curvature of the surfactant: this is the case for the usual macroemulsions. These emulsions are metastable states that are created by applying mechanical energy to the mixture, and may be destroyed by spontaneous processes such as coalescence or Ostwald ripening.It is also possible to produce emulsions (out-of-equilibrium systems) with much smaller droplet sizes, in the range 30–300 nm.2–13 Such emulsions are made through high energy mechanical agitation of the system, or through the use of phase transitions that push the system far from its equilibrium state, as described below. Since they are not equilibrium states, their compositions are not constrained by conditions related to the spontaneous curvature of the amphiphile; hence, they can exist in a much wider composition space than microemulsions. In fact, the only thermodynamic constraint on the use of emulsions with droplet sizes in the 100 nm range is that their composition should ensure metastability against the main degradation processes such as coalescence or ripening. Hence, they have a broad spectrum of applications. First, emulsions with droplet sizes below 100 nm do not scatter much light, and are therefore translucent. This provides a visual effect that is perceived as “watery”, which may be attractive for cosmetic purposes. Second, these very small droplets do not cream or sediment under the effect of gravity. This makes it possible to design a formula which is highly fluid and yet does not separate upon standing. Third, and most important regarding skin care, these very small droplets can lodge themselves in between layers of corneocytes (skin cells) that are partly separated near the outer surface of the stratum corneum, and deliver active ingredients to the skin with higher efficiency.
The production of 100 nm emulsions on an industrial scale is not as easy as that of the usual macroemulsions. It requires the creation of a large amount of interface, which requires that the system must be taken far from its equilibrium state. The usual methods start from a macroemulsion (low interfacial area) and rely on strong extensional flows to create the required interfacial area and break large emulsion droplets into very fine ones. High pressure homogenizers make it possible to obtain droplet sizes in the range 50–500 nm, with a very good control on the droplet size distribution. However, their operating costs are significant.
There is another set of methods, which start from a microemulsion (at equilibrium, very high interfacial area) and rely on a sudden change of physical parameters or composition in order to trap the system into a metastable emulsion state (far from equilibrium, high interfacial area). In these methods, the change of parameters causes the system to invert its topology, i.e. a water/oil microemulsion is turned into an oil/water emulsion. Hence, these methods are called phase inversion methods.14
Temperature changes have been extensively used to produce such phase inversions; the method is called the phase inversion temperature method (PIT).10,15–21 It takes advantage of the fact that the hydration of polyoxyethylene surfactants changes with temperature. The starting point is a reverse microemulsion (water in oil) which forms spontaneously at high temperature. From this point, the temperature is lowered rapidly, causing the spontaneous curvature of the surfactant (initially turned toward water) to go through zero (at the PIT) and then reverse its sign (toward oil). In response to these variations, the system changes its structure: at the PIT, it forms a bicontinuous structure (zero mean curvature) and then, below the PIT, this bicontinuous structure is fragmented to yield oil droplets in water , with diameters below 100 nm.10 This method works quite well, but it sets severe constraints on the composition of the system. Indeed, it requires the use of polyoxyethylene surfactants that form a single-phase microemulsion at a temperature and composition that can be conveniently reached in the process. Many surfactants are not adequate for this purpose, because at the PIT they form a rigid lamellar phase which cannot be fragmented to yield an emulsion.
Alternatively, the system can be driven by changes in composition rather than temperature.11–15 This may be called the phase inversion composition method (PIC). The starting point is again a reverse microemulsion (water in oil) which forms spontaneously at very low water content because the polyoxyethylene part of the surfactant has a low hydration, and therefore the spontaneous curvature of the surfactant is turned toward water. From this point, water is added rapidly, up to a composition where the polyoxyethylene chains are fully hydrated and the spontaneous curvature is turned toward oil. In response, the system also changes its structure and eventually yields an oil-in-water emulsion. This method is advantageous from an industrial point of view, since an abrupt composition change is more easily achieved than an abrupt temperature change, and because it does not require heating the whole composition to elevated temperatures. However, the mechanism by which the system inverts its structure is not known at present. Indeed, a surfactant system that has been prepared with the “wrong” curvature for the surfactant layers may evolve in many ways.
(a) It may evolve through nucleation of the equilibrium phases. A number of authors have examined the structures of the phases that are formed by systems used in PIC emulsification, when they are allowed to reach equilibrium.11,12,20 The general conclusion is that such systems will, at equilibrium, decompose into 2 or 3 phases. This will prevent the formation of an emulsion, which is a non-equilibrium state of the system.
(b) It may evolve through formation of a multiple emulsion, in which both types of curvature are present. Lin et al.14 published optical microscopy images that show multiple emulsions (w/o/w) formed during phase inversion of some polyoxyethylene surfactant systems. However, the w/o globules in these emulsions evolve to yield oil droplets with sizes in the range 1–10 μm. The production of emulsions with homogeneous droplet populations in the 100 nm range does not seem to be explained by this process.
(c) It may evolve through the formation of a mesophase with zero mean curvature, as in the PIT process. If the evolution was similar to that in the PIT process, the oil+surfactant structures of this phase would then break up spontaneously to yield the droplets of the “final” emulsion.
In this paper we present the results of small angle neutron scattering (SANS) and nuclear magnetic resonance (NMR) experiments that were performed during the phase inversion in order to figure out the mechanism through which a water-in-oil microemulsion is transformed into an oil-in-water emulsion with droplet sizes in the 100 nm range.
Materials and methods
Materials
The system chosen for this study consisted of surfactant, oil and water. The surfactant was polyethylene glycol 400 monoisostearate, supplied by Uniqema (Prisorine 3644). This surfactant is actually a mixture of polyoxyethylene isostearic esters. A complete characterization of this surfactant was performed, using high pressure liquid chromatography (HPLC) with mass spectrometry detection (MS) (Appendix 1). The HLB values of these esters ranged from 8.5 to 14.1, with an average HLB value equal to 12. There was also a fraction (14.5%) of non esterified polyoxyethylene, a small amount of isostearic acid (2.2%) and almost no water. The oil was hydrogenated polyisobutene, supplied by NOF Co (Parleam); its chemical formula is (CH3)3C[CH2C(CH3)3]n CH2CH(CH3)2 with n = 6 to 8. The water was D2O, which yields a good contrast with in SANS experiments.Phase inversion experiments were performed by adding water to a surfactant/oil/water mixture, where the mass ratio of surfactant to oil was maintained at 1/1, 1/2 or 1/3. Other experiments were performed on equilibrium phases, for systems with surfactant and water only (no oil) and for systems with surfactant/oil = 1/1.
Phase inversion process
We used a phase inversion process similar to that described by Lin et al.14 and by Forgiarini et al.12 The starting point was a microemulsion containing oil, surfactant and a small amount of water (oil/surfactant/water = 0.6/0.3/0.1 w/w/w in most experiments). At this composition, there was only 1.4 water molecule per EO unit in the polyoxyethylene chains of the surfactant; consequently the spontaneous curvature of the surfactant was directed toward water. SANS experiments (see below) indicated that the surfactant formed small micelles with a core that contained the partly hydrated EO chains, surrounded by a corona made by the hydrocarbon chains of the surfactant, solvated by the oil. This reverse microemulsion was transparent and isotropic.This microemulsion was heated to 30 °C and stirred with a magnetic stirrer, and then water, also heated to 30 °C, was added quickly in about 1 s. The final water volume fraction was 0.7, which corresponds to 28 water molecules per monomer in the EO chains of the surfactant. The volume occupied by these hydrated EO chains was such that the spontaneous curvature of the surfactant became directed toward oil. The stirred mixture immediately became white; drops picked up from the mixture stretched to become long thin threads, indicating that they contained a viscoelastic liquid. After a few minutes, the viscoelastic behavior vanished, and after one hour the liquid became opalescent with the slight bluish reflexion of light that is characteristic of colloidal dispersions. Observations through quasi-elastic light scattering indicated that the system was an emulsion with a distribution of droplet diameters that was centered at 100 nm. This process was quite reliable provided that the initial mixing was quick and thorough; inadequate mixing resulted in the formation of a minority population of large droplets (≈1 μm), or, in worse cases, in the formation of mesophases that did not evolve. Phase inversion experiments which started from microemulsions with a ratio surfactant/oil = 1/3 instead of 1/2 also led to the formation of similar oil/water emulsions, but the stages of the phase inversion were too fast to be observed.
Methods
The phase inversion process was followed through visual observations, SANS and NMR.SANS experiments were performed with the instrument D11 at ILL.22 The phase inversion was performed in a small vessel located next to the instrument. Immediately after addition of water to the microemulsion, a small volume of the liquid was collected with a pipet (id 0.5 mm) and injected into a quartz cell (1 mm thick) located on the beam path. The first scattering pattern was taken 20 s after the addition of water, with a counting time of 10 s, and the next ones every 10 s. The early scattering patterns contained diffraction spots at low scattering angles, indicating that at least one region of the sample had become a mesophase that was oriented by the flow through the syringe during injection into the cell.
At this point it is appropriate to mention that scattering techniques emphasize the scattering from ordered regions of the sample, because the scattering from these regions is concentrated into spots, whereas the scattering from the disordered regions is distributed over the whole interference pattern. Thus, if the sample contains both ordered and disordered regions, the interference patterns will show diffraction spots superimposed on a diffuse background. A detector image that is color-coded according to levels of intensity will enhance the relative importance of the scattering from ordered regions (spots) in comparison with that from disordered regions (background). This effect is well known in protein crystallography, where the signal from the disordered and mobile regions of the proteins is hidden in the background of the interference patterns.
NMR experiments were also performed during phase inversion. Samples were prepared in the same way through the phase inversion process and injected immediately after mixing through a long syringe into a 5 mm NMR tube. 1H spectra were taken using a Bruker DSX 200 MHz spectrometer with the sample temperature regulated at 30 °C by pumping air in the coil through a Dewar tube in the probe. Contrarily to scattering, NMR spectra emphasize the signal from the disordered regions of the sample. Indeed, the amorphous structures of emulsions and microemulsions give NMR signals with a long free induction decay, which yield spectra with narrow lines that have very high peak intensities. Conversely, ordered mesophases give signals with short free induction decays, which yield very broad lines that have low peak intensities.
Experiments performed during phase inversion
This section describes mainly small angle neutron scattering (SANS) experiments performed during the first few seconds of the phase inversion process. Two similar phase inversion experiments were performed, with the neutron detector located at two different positions, giving structural information at scales ranging from 30 to 300 nm, and from 60 to 600 nm, respectively.Before water addition
The initial microemulsion contained a small amount of D2O and a large amount of surfactant (composition oil/surfactant/water = 0.6/0.3/0.1 w/w/w). SANS interference patterns of this phase show an isotropic diffraction ring, with a Q value that corresponds to a repetition distance of 11.8 nm. The radially averaged spectrum is shown in Fig. 1. Since the contrast is produced by D2O, this repetition must correspond to the center-to-center distance of D2O droplets (containing the hydrated EO chains of the surfactant), that are separated by oil and the hydrocarbon chains of the surfactant. Since the microemulsion was fluid, transparent and non-birefringent, and contained little water, these objects must be the aqueous cores of reverse micelles. From this distance, and from the composition of the microemulsion, the diameter of the D2O/EO cores may be calculated. For this purpose, we assume that the micelles are spherical and placed on a regular fcc lattice. Then the diameter of the cores is found to be 10.2 nm and their separation is 4.3 nm; other lattices (bcc), and also arrays with short range order only, give similar values. The area per surfactant molecule at the water/oil interface is A = 0.54 nm2, which is close to the areas calculated for other surfactants with similar EO chains.23–25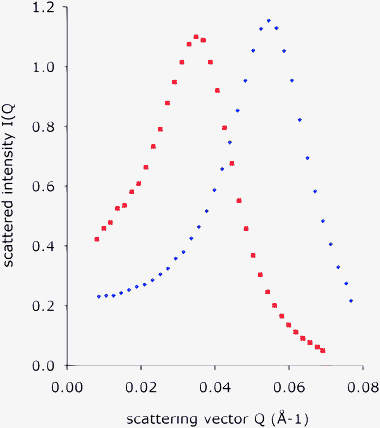 | ||
| Fig. 1 Radially averaged SANS spectra of the microemulsion. Red squares: composition oil/surfactant/water = 0.6/0.3/0.1 w/w/w. This is the microemulsion used in the phase inversion experiment described below. The peak position corresponds to the average distance between the aqueous cores of reverse micelles, which is d = 11.8 nm. The micelle core diameter is D = 10.2 nm and the average separation of micelle cores is h = 4.3 nm. Blue diamonds: composition oil/surfactant/water = 0.44/0.44/0.12 wt, lower oil concentration, the distance between micelles is shorter. | ||
In the context of phase inversion, there are two features of this phase that are of interest. One is the very short separation of the aqueous cores (about the length of a surfactant molecule); the other is the fact that this phase vanishes at water contents in excess of 0.2, because the hydration of the EO chains becomes incompatible with the curvature of the reverse micelles.
Right after water addition (20 s)
The first interference pattern (obtained 20 s after addition of water) was anisotropic: it contained two bright crescents located on either side of the beam (Fig. 2a). These crescents must have been produced by a phase that had uniaxial symmetry around the direction that goes through the middle points of both crescents and the center of the beam. The distance between the crescents and the center of the beam corresponds to a repeat spacing of 60 nm in that direction. The elongation of the crescents in the transverse direction reflects the contributions of domains with the same repeat spacing but different orientations. This interference pattern is typical of an oriented lamellar phase: the crescents originate from the repetition of lamellae in the uniaxial direction.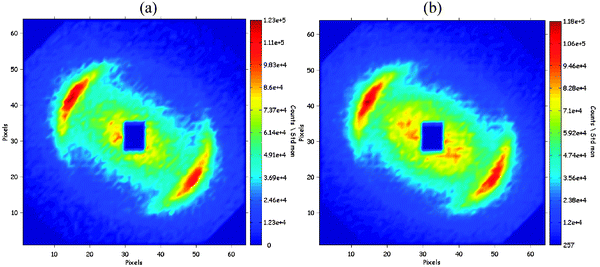 | ||
| Fig. 2 SANS interference patterns taken during phase inversion. (a) 20 s after addition of water; (b) 50 s after addition of water. The crescents originate from diffraction by a transient lamellar phase, with lamellae that are repeated in the direction that goes through the middle points of both cresents and the center of the beam. The central scattering is produced by defects of this lamellar phase. The horizontal and vertical distances from the center of the beam correspond to Q values ranging from 0 to 2 × 10⁻²Å−1. The color codes correspond to the magnitudes of scattered intensities. | ||
Assuming that the lamellar phase has the same composition as the whole sample, we can use its repeat spacing (d = 60 nm) to calculate the individual thicknesses of the water layers, oil layers, and surfactant monolayers. We find that the average thickness of the water layers is enormous (42 nm); the oil layers are also quite thick (12 nm), whereas the surfactant monolayers have usual dimensions (3 nm).
In addition to the crescents that originate from the repetition of the oil and water layers, there was some weak scattering close to the beam, in the same direction as the centers of the crescents. This scattering must originate from defects of the lamellar phase, since it shares the same alignment. In order to better resolve this central scattering, we performed another experiment performed with a longer sample-detector distance. The first interference pattern is shown in Fig. 3a; it was obtained at the same time after water addition as in Fig. 1a. It shows that the central scattering decreases monotonically with scattering angle, indicating that the defects have a simple shape. The anisotropy of the decay indicates that they must be elongated in the direction of the lamellae. Fig. 3b shows a plot of the radially averaged intensity according to the Guinier approximation. From the slope of this plot we obtain the average radius of gyration of the defects, which yields a size of 60 nm. It is remarkable that this defect size matches the repeat spacing of the lamellar phase.
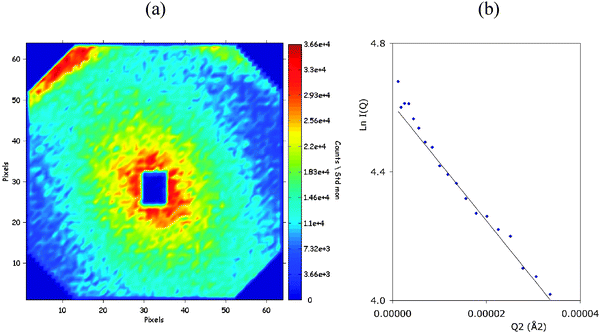 | ||
| Fig. 3 Interference patterns from another phase inversion experiment performed with a longer sample–detector distance. (a) interference pattern taken 20 s after addition of water. The crescent seen near the upper edge of the interference pattern originates from the repetition of water and oil layers in the transient lamellar phase. The central scattering is produced by defects that grow within this phase. The horizontal and vertical distances from the center of the beam correspond to Q values ranging from 0 to 1 × 10⁻²Å−1. (b) Plot of the natural logarithm of the radially averaged intensity according to square of the magnitude of the scattering vector Q. The slope of this plot yields the radius of gyration of the defects. | ||
Later times (50 s and beyond)
For a short time (50 s) after the addition of water, the interference pattern remained similar, with an increase in the central scattering (Fig. 2b). However, very soon afterwards (10 s later), a new set of diffraction spots appeared, located in the same direction as the original crescents, but at a smaller separation from the beam, corresponding to a longer repeat distance (Fig. 4a). Still another 10 s later, the original crescents from the transient lamellar phase had nearly vanished, and the new spots merged into an elliptical ring (Fig. 5b). This ring finally became circular and then no longer changed: it was the interference pattern of the oil-in-water emulsion that had been produced by the phase inversion process.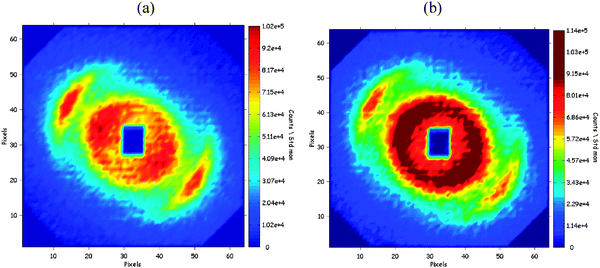 | ||
| Fig. 4 Interference patterns from the same sample as in Fig. 1 but at later times. (a) 60 s after addition of water. A new scattering appears, consisting of two broad spots, located in the same direction as the centers of the original crescents, but closer to the beam. It is argued that these spots originate from the diffraction from an emulsion that has kept the anisotropy of the transient lamellar phase. (b) 70 s after the addition of water. The new spots turn into crescents and then merge into a circular ring. This ring is the interference pattern of the oil-in-water emulsion produced by the phase inversion process. The horizontal and vertical distances from the center of the beam correspond to Q values ranging from 0 to 2 × 10⁻²Å−1. | ||
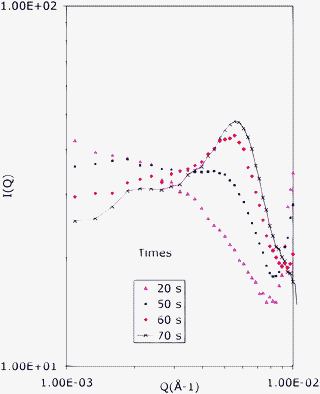 | ||
| Fig. 5 Radially averaged spectra taken at 20, 50, 60 and 70 s after water addition in the experiment with a longer sample-dectector distance (as in Fig. 3). The peak that is located at the high Q edge of the first spectrum (repeat distance 60 nm) is the first diffraction order of the transient lamellar phase. The broad hump that grows with time at intermediate Q values (distances 140–100 nm) originates from the new phase that grows at the expense of the transient lamellar phase. | ||
The complete set of radially averaged spectra taken during this evolution is shown in Fig. 5. Here the first spectrum shows the lamellar diffraction peak at Q = 10−2Å−1 and the diffraction from defects at low Q values; the last spectrum shows the broad emulsion peak at Q = 4 × 10⁻³Å−1. A remarkable feature of this set of spectra is that they appear to be linear combinations of the first and last spectrum. This may indicate that one phase grows at the expense of the previous one.
However, the radial averaging of anisotropic interference patterns may obscure some of the relevant information. For this reason, we have tested this feature for the full interference patterns as well. Fig. 6 shows indeed that one pattern taken at intermediate times can be reproduced as a linear combination of the first and last interference pattern. Accordingly, the succession of interference patterns reflects the growth of a new phase (the emulsion) at the expense of the previous one (the transient lamellar phase). Still, the interference pattern from the emulsion retains a definite anisotropy that cannot be explained by the contribution from the leftovers of the lamellar phase (Fig. 4b). This anisotropy suggests that, initially, the emulsion has some memory of the orientational correlations of the transient lamellar phase.
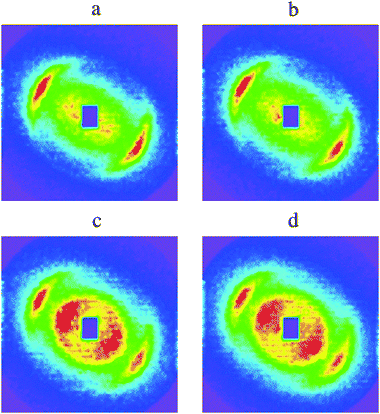 | ||
| Fig. 6 Comparison of experimental interference patterns taken at intermediate times with linear combinations of the first and last experimental patterns. (a) Experimental pattern taken at 50 s after water addition, compared with (b) linear combination of the first pattern (20 s) and the last one (70 s), with coefficients 0.9 and 0.1. (c) Experimental pattern taken at 60 s, compared with (d) linear combination of the same two patterns, with coefficients 0.6 and 0.4. The fact that (b) matches (a), and that (d) matches (c), indicates that this set of patterns reflects the growth of a new phase at the expense of the previous one. | ||
Structure of the final emulsion
In the final state the scattering has become completely isotropic: most of the intensity is concentrated in a circular ring, which is characteristic of an array of repelling droplets. The Q value of this ring yields an average center-center distance between droplets, which is 100 nm. The average droplet diameter D may then be calculated from this distance, using the volume fraction of oil+surfactant, or the volume fraction of water, which is ϕw = 0.7. If the droplets are assumed to be regularly ordered as in a face centered cubic lattice, this calculation yields D = 91 nm. Alternatively, the measured intensities may be regrouped through radial averaging to yield a spectrum of intensity vs. the magnitude Q of the scattering vector. This spectrum may be fitted by the scattering curve calculated for a liquid of repelling hard spheres26 with a form factor that takes into account a broad distribution of the sphere diameters: this yields D = 92 nm, in very good agreement with the simple calculation made for an ordered array of droplets (Fig. 7).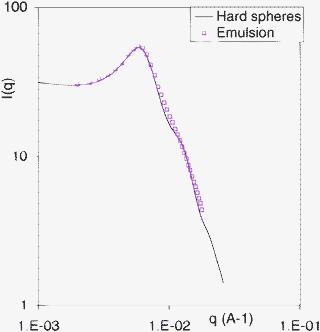 | ||
| Fig. 7 Spectrum of the final emulsion (squares) and scattering curve calculated for a liquid of polydisperse repelling hard spheres (full line), with an average diameter D = 92 nm and a broad distribution of diameters (half width 100%). | ||
Observations through 1H NMR
The phase inversion experiments were repeated to produce samples that were examined through NMR, at times ranging from 45 s to 5 minutes after the addition of water to the microemulsion. All these spectra consisted of a set of narrow lines (FWHM widths 20–50 Hz) corresponding to surfactant and oil molecules that had fast isotropic rotational motions. There was no obvious trace of the very broad band signal that would be expected for surfactant and oil molecules in an anisotropic phase, such as the transient lamellar mesophase that was observed at very short times in SANS experiments. Yet visual observations of the samples indicated the presence of a viscoelastic phase at early times after water addition, as in the case of the SANS experiments.Experiments performed on the equilibrium phases
If the phase inversion process is not performed sufficiently fast, then the system made of surfactant, oil and water does not follow the phase inversion pathway described above. Instead, it decomposes into some of the equilibrium phases that exist in specific ranges of composition. In order to better understand the constraints of the phase inversion process, we have also examined these equilibrium phases, which are the phases that the system must avoid in order to yield an emulsion at the required length scale.Coexistence of equilibrium phases
A first set of experiments was performed with compositions consisting of water and surfactant only, at increasing hydrations; then another set was performed with a made at a surfactant/oil ratio = 1/1, also varying the water content. In these 2 sets of experiments, we only found 4 equilibrium phases. These phases extend across the phase diagram, i.e. they are found along both lines of compositions. The sequence of phases that are observed along each line, upon increasing water content, is as follows:(a) A fluid and transparent phase, non-birefringent, that holds little water. This phase is the reverse microemulsion that is the initial state for the phase inversion process.
(b) A viscous and birefringent phase that contains slightly more water. The structure of this phase changes very little with the overall composition of the mixture.
(c) A white “phase” that swells considerably with water. The textures of this “phase”, as observed through optical microscopy, are characteristic of a lamellar phase.
(d) A fluid and transparent phase that contains mostly water and a small amount of surfactant. This can be identified to a direct micellar phase of the surfactant/water system.
Fig. 8 shows how the relative volumes of these phases vary with the addition of water into the system.
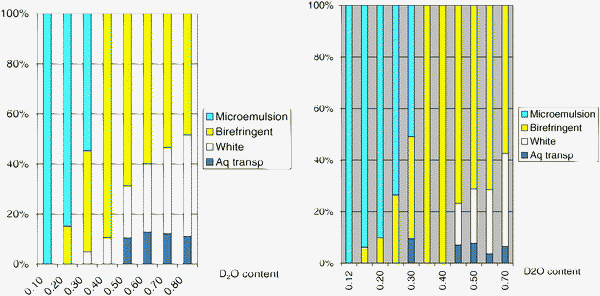 | ||
| Fig. 8 Coexistence of the four equilibrium phases. Left: water/surfactant mixtures. Right: water/surfactant/oil mixtures at surfactant/oil = 1/1. The proportions of the different phases are the same in both systems, indicating that they are determined by the hydration of the surfactant. | ||
The observation of this sequence of phases is instructive in many ways. First, it shows that an evolution of the system at equilibrium, starting from the water/oil microemulsion, would have to proceed through the birefringent phase, and would leave most of the surfactant and oil in that phase, regardless of the final hydration, which is not the desired outcome. Second, in both systems (without oil and with oil), the proportions of the different phases are the same at the same level of hydration. This gives support to the idea that the structural evolution of the system is completely driven by the hydration of the surfactant. Third, in the system with surfactant only, the coexistence of three phases shows that the mixtures are not true binary systems. This is obviously a consequence of the composition of the surfactant, which is a mixture of molecules with different EO chains.
In the following, we provide some structural data on these phases (the data on the reverse microemulsion have been presented above). This is meant to shed some light on the phase transitions that the system must avoid in order to remain on the pathway that leads to the metastable oil-in-water emulsion.
Birefringent, transparent and viscous phase
This is the most voluminous phase at all intermediate water contents, and in surfactant/oil/water systems at water contents between 0.35 and 0.4, it expands into the whole sample (Fig. 8). At higher water contents it coexists with the “white phase”, and then most of the added water is taken up by the white phase. These features indicate that the birefringent phase exists as a single phase in a narrow range of compositions, and resists further swelling with water.This phase is transparent, birefringent, and quite viscous. Accordingly, it must be made of infinite aggregates (resistance to flow) that are arranged in an ordered pattern (transparency and birefringence). The structures of these aggregates are not known a priori. SANS spectra show a set of two peaks that may be interpreted as a structure with 2-D order, e.g.surfactant layers with water-filled holes that form a 2-D lattice.27,28 When the overall water content of the multiphase sample is shifted from 0.2 to 0.7, the main repeat spacing of this structure only changes from 10 to 14 nm, and the extra water is used in other phases (Fig. 9). This is of course in agreement with the fact that the density of this phase remains nearly constant.
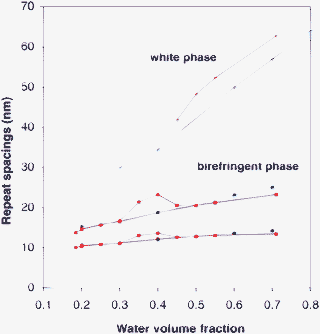 | ||
| Fig. 9 Repeat spacings of the two main mesophases according to the overall volume fraction of water in the samples. Diamonds and squares: birefringent phase. Crosses: white phase. The repeat spacings are nearly the same in the water + surfactant system (blue symbols) and in the water + surfactant + oil system (red symbols). The birefringent phase swells very little, while most of the added water is taken up by the white phase. | ||
For the purposes of phase inversion, this phase is a “dead end”. Indeed, it resists swelling with water (its water content remains close to 0.4), and the extra water is used in other phases. This resistance to swelling may originate from an oil-continuous structure (e.g. aqueous cylinders or ribbons). Therefore successful inversion pathways must avoid the formation of this birefringent phase.
White “phase”
This “phase” is present in increasing amounts when the water content rises from 0.3 to 0.8. The growth of its relative volume is such that it takes up most of the water added to the system. Its density is close to that of water, which confirms that it contains mostly water. Observations through optical microscopy show a texture made of spherulites, which is characteristic of a lamellar phase.29–31 The neutron scattering spectra of this “phase” show a strong scattering next to the beam, followed by single broad peak. The repeat distance that is deduced from the peak position swells rapidly with water content, from 30 to 64 nm (Fig. 9). If the white “phase” was a dispersion of lamellar domains in excess aqueous phase, then the repetition of bilayers would remain the same when the amount of excess water is varied. In fact, the repetition distance of bilayers in the white phase swells very quickly when the water content of the sample is increased, indicating that the extra water is used to swell the interbilayer spacings.Similar spectra have been obtained for sponge phases that are made of flexible bilayers dispersed in water.32–35 In this case the swelling is caused by entropic forces associated with the spontaneous undulations of the bilayers. These spontaneous undulations are also the cause of spatial fluctuations of the surfactant concentration, which scatter light and give rise to the white appearance of this phase.
For the purposes of phase inversion, the white phase is interesting, since it has the same swelling as the transient phase that is formed at the same composition in the non equilibrium phase inversion process (about 60 nm). Both are white and fluid. However, the transient phase may hold temporarily all the oil that was originally in the microemulsion, whereas the white phase has lost most of the oil through coexistence with the oil-continous birefringent phase (Fig. 8).
Transparent aqueous phase
This phase coexists with the other phases at the higher water contents, it has a small relative volume (less than 8% of the total volume) and it is never observed as a single phase. Its density is higher than that of the white phase, which indicates that it contains even less surfactant. These features correspond to the behavior of an aqueous solution, in which the most hydrophilic surfactant molecules are dissolved.Discussion
The aim of this discussion is to examine the possible mechanisms for the phase inversion process. By mechanism, it is meant the succession of transient states, or pathways, that the system goes through once it has been set in its initial condition, i.e. after addition of water to the reverse microemulsion. There are three types of pathways that have been mentioned in the literature and could be relevant for the experiments described here:(a) Pathways that involve the formation of one or more phases that are equilibrium phases at the composition of the system.
(b) Pathways in which the system forms a non-equilibrium mesophase with zero mean curvature, as in the PIT process.
(c) Pathways that invert the structure through the formation of multiple emulsions.
In the following, we examine the conditions in which the surfactant/oil/water systems may follow each of these pathways, the stages in the phase inversion, and the final state of the surfactant/oil/water system.
Growth of equilibrium phases
Evolution along this pathway was observed in this work when water was added very slowly to the microemulsion (section “Experiments performed on equilibrium phases”). Upon progressive addition of water, the stages of evolution were those shown in Fig. 8b:(i) Water was added into the reverse microemulsion, and the birefringent viscous phase grew at the interface.
(ii) The microemulsion was completely replaced by the birefringent viscous phase.
(iii) Further addition of water caused the formation of the white phase, which remained in coexistence with the birefringent viscous phase.
The final state of the surfactant/oil/water system was the separation of macroscopic mesophases. It could not lead to an oil/water emulsion, even with mechanical agitation, since most of the oil and surfactant remained trapped in the birefringent viscous phase. Hence, successful phase inversion processes must go through another pathway.
Formation of a transient mesophase
This pathway was observed in the present work when a large amount of water was added rapidly to a microemulsion that had a high surfactant/oil ratio (surfactant/oil ≥1/2). SANS experiments (interference patterns) and visual observations (presence of a viscoelastic phase) performed during phase inversion indicated the following stages:(i) The added water was “pumped” into the EO cores of the surfactant micelles, which coalesced together to form a transient lamellar phase with thick water layers (42 nm) and oil + surfactant layers (18 nm) (Fig. 1).
(ii) An emulsion grew at the expense of the lamellar phase, keeping the same orientational anisotropy as the lamellar phase, and with droplet spacings that are about 100 nm (Fig. 4a).
(iii) The emulsion lost all memory of the orientational correlations of the lamellar phase (Fig. 4b).
It would be interesting to speculate on how the transformation from the lamellar phase to the emulsion occurs, e.g. through the fragmentation of the surfactant + oil bilayers into disks,36–38 or through the formation of a mesh phase,27,28 but this is beyond the experimental information available here.
Another interesting question about this mechanism is whether the system evolves through a homogeneous or through a non-homogeneous transformation. If it is assumed that the transient lamellar phase undergoes a homogeneous transformation to an intermediate phase, and then to an isotropic emulsion, over times on the order of a minute, then the results of SANS and NMR experiments are not be compatible with each other since the early SANS interference patterns (up to 60 s) show diffraction by a transient lamellar phase whereas the early NMR spectra (taken at 45 s) do not show any trace of this phase.
However, the SANS spectra actually indicate that the emulsion phase nucleates from the transient lamellar phase at early times in the process (see the reconstruction of the SANS spectra that is presented in Fig. 6). In this case, the results from both experiments are compatible, since SANS emphasizes the scattering from the ordered regions of the sample (the transient lamellar phase), whereas NMR emphasizes the signal from the disordered regions (the emulsion phase). Accordingly, it may be concluded that both phases coexist over the time interval that was studied in the phase inversion process. The fact that the emulsion phase nucleates from the transient lamellar phase and not directly from the reverse microemulsion is demonstrated by its initial anisotropy, which is in the same direction as that of the transient lamellar phase (see Fig. 4a). The nucleation time may be extremely short, on the order of seconds, especially so for systems with a low surfactant/oil ratio (<1/2).
The final state of the surfactant/oil/water system was an emulsion with a relatively broad distribution of droplet diameters, centered at 90 nm. This final state was reached with very good reliability, provided that the addition of water to the reverse microemulsion was fast. Hence, there must be some kinetic factors that prevent evolution through the separation of equilibrium phases, as described above. The final size of the emulsion droplets must be determined by the fragmentation of the oil layers in the transient lamellar phase, and therefore may depend on the characteristics of the surfactant.
Formation of a multiple emulsion
This pathway was observed by Lin et al.14 in systems that contained similar mixtures of surfactants, oil and water, but with a lower surfactant/oil ratio (1/6). The stages described by Lin are as follows.(i) The reverse microemulsion was rapidly dispersed in excess water, which yielded a multiple emulsion made of oily globules (containing the aqueous micelles) in a continuous aqueous phase.
(ii) The aqueous micelles that were contained in these globules met the outer surfaces of the globules and coalesced with the continuous aqueous phase.
(iii) When all the reverse micelles had been eliminated from the interior of the globules, these oil globules became the final emulsion droplets.
In the experiments described by Lin, this evolution did lead to oil/water emulsions, but the sizes of the droplets were above 1 μm. Similarly, experiments performed in the present work, with fast water addition to a microemulsion with a low surfactant/oil ratio (surfactant/oil < 1/3) also led to emulsions with micrometer sized droplets.
An interesting question is whether this mechanism could also be active in systems with a high surfactant/oil ratio (≥1/2) and lead to emulsions with droplet diameters near 100 nm, such as those obtained in the present work. The difficulty with this hypothesis is that there does not seem to be any obvious mechanism by which the oily globules containing the aqueous micelles could be fragmented down to such small sizes. Indeed, hydrodynamic shear such as obtained by simple stirring is not efficient at submicrometer scales, and spontaneous fragmentation of the globules caused by the growth and coalescence of the aqueous micelles would be unlikely to give a narrow distribution of diameters.
Conclusion
Amphiphilic systems (surfactant, oil, water) that have been prepared in a state where their interfaces have the “wrong” curvature can evolve in many ways. In this work we have examined systems that have been prepared with a strong water/oil curvature (reverse microemulsions), and then have been given a strong spontaneous curvature in the opposite direction (through hydration of the surfactant). We have found that the spontaneous evolution of such systems depends on the choice of process (how fast is the change in spontaneous curvature) and composition (what is the surfactant concentration, or the distance between interfaces).(a) If the change in spontaneous curvature is progressive (slow addition of water to the reverse microemulsion), then the system evolves through the nucleation of the mesophases that are equilibrium states of the system at the instantaneous composition, and the final state is a coexistence of mesophases at thermodynamic equilibrium.
(b) If the change in spontaneous curvature is abrupt (fast addition of water) and the surfactant concentration is low, then the system may evolve through the formation of multiple emulsions, and end in a non equilibrium state that is an oil/water emulsion with micrometer-sized droplets, as reported by Lin et al.14
(c) If the change in spontaneous curvature is abrupt and the surfactant concentration is high (surfactant/oil ≥1/2), then the system may evolve through the formation of a transient phase with zero mean curvature, and end in a non equilibrium state that is an oil/water emulsion with 100 nm-sized droplets. This was already known in the case of changes in curvature caused by temperature jumps (PIT processes). The SANS experiments reported here demonstrate that this pathway may also be active in the case of changes in spontaneous curvature caused by hydration of the surfactant (PIC processes).
The existence of this third pathway leads to a number of interesting questions regarding the control of the structural evolution (what barriers prevent the system from nucleating the equilibrium phases), the control of the final state (what properties of the surfactant determine the final size of the droplets) and the detailed mechanism of the structural transitions (how does the system rearrange from a reverse microemulsion to a lamellar phase and then from the lamellar phase to an emulsion).
Appendix 1: Analysis of the surfactant chain length distribution through HPLC/MS
The surfactant was Prisorine 3644 supplied by Uniqema. This surfactant is a mixture of polyoxyethylene isostearic esters. A complete characterization of this surfactant was performed, using high pressure liquid chromatography (HPLC) with mass spectrometry detection (MS) (Table 1). Similar results were also obtained through other analytical methods (GC/FID and LC/Corona CAD). The HLB values of these esters ranged from 8.5 to 14.1, with an average HLB value equal to 12. There was also a fraction (14.5%) of non esterified polyoxyethylene, a small amount of isostearic acid (2.2%) and almost no water.| PEO mono-isostearates | Amount | HLB |
|---|---|---|
| EO3 | 0.9 ± 0.4% | 8.5 |
| EO4 | 3.2 ± 0.2% | 9.6 |
| EO5 | 6.3 ± 0.1% | 10.5 |
| EO6 | 12.7 ± 0.4% | 11.3 |
| EO7 | 21.7 ± 0.8% | 11.9 |
| EO8 | 21.1 ± 0.4% | 12.5 |
| EO9 | 15.4 ± 0.3% | 13.0 |
| EO10 | 10.5 ± 0.3% | 13.4 |
| EO11 | 5.6 ± 0.2% | 13.8 |
| EO12 | 2.7 ± 0.2% | 14.1 |
| EO13 | 1.3 ± 0.2% | 14.4 |
| PEO di-isostearates | <1% | |
| Non-esterified PEO | 14.5% | 20 |
| Isostearic acid | 2.2% |
References
- D. F. Evans and H. Wennerström, The Colloidal Domain, Wiley, New York, 1994 Search PubMed.
- H. L. Rosano, T. Lan, A. Weiss, J. H. Whittan and W. E. F. Gerbacia, J. Phys. Chem., 1981, 85, 468 CrossRef CAS.
- E. David Sudol and M. El Aasser, in Emulsion Polymerization and Emulsion Polymers, ed. P. A. Lowell, M. El Aasser, Wiley, 1997 Search PubMed.
- M. El Aasser, C. Lack, J. Vanderhoff and F. Fowkes, Colloids Surf., 1988, 29, 103 CrossRef CAS.
- S. Tomomasa, M. Kochi and H. Nakajima, J. Jpn. Oil Chem., 1988, 37, 1012 Search PubMed.
- S. Benita and M. Y. Levy, J. Pharm. Sci., 1993, 82, 1069 CrossRef CAS.
- T. Forster, W. Rybinski and A. Wadle, Adv. Colloid Interface Sci., 1995, 58, 119 CrossRef.
- L. Taisne, P. Walstra and B. Cabane, J. Colloid Interface Sci., 1996, 184, 378 CrossRef CAS.
- H. Nakajima, in Industrial Applications of Microemulsions, Marcel Dekker, 1997 Search PubMed.
- L. Taisne and B. Cabane, Langmuir, 1998, 14, 4744 CrossRef CAS.
- A. Forgiarini, J. Esquena, C. Gonzalez and C. Solans, Prog. Colloid Polym. Sci., 2000, 115, 36 CAS.
- A. Forgiarini, J. Esquena, C. Gonzalez and C. Solans, Langmuir, 2001, 17, 2076 CrossRef CAS.
- N. Sadurni, C. Solans, N. Azemar and M. Garcia-Celma, Eur. J. Pharm. Sci., 2005, 26, 438 CrossRef CAS.
- T. J. Lin, H. Kurihara and H. Ohta, J. Soc. Cosm. Chem., 1975, 26, 121 Search PubMed.
- S. Sajjadi, Langmuir, 2006, 22, 5597 CrossRef CAS.
- K. Shinoda and H. Saito, J. Colloid Interface Sci., 1968, 264, 70 CrossRef.
- K. Shinoda and H. Saito, J. Colloid Interface Sci., 1969, 30, 258 CAS.
- K. Shinoda and H. Kunieda, in Encyclopedia of Emulsion Technology, ed. P. Becher, Marcel Dekker, 1983 Search PubMed.
- P. Izquierdo, J. Esquena, Th. F. Tadros, C. Dederen, M. J. Garcia, N. Azemar and C. Solans, Langmuir, 2002, 18, 26 CrossRef CAS.
- D. Morales, J. M. Gutierrez, M. J. Garcia-Celma and C. Y. Solans, Langmuir, 2003, 19, 7196 CrossRef CAS.
- P. Izquierdo, J. Esquena, Th. F. Tadros, C. Dederen, J. Feng, M. J. Garcia-Celma, N. Azemar and C. Solans, Langmuir, 2004, 20, 6594 CrossRef CAS.
- The instrument D11 is fully described on the website http://www.ill.eu/d11.
- T. Sottmann, R. Strey and S. H. Chen, J. Chem. Phys., 1997, 106, 6483 CrossRef CAS.
- M. Leaver, U. Olsson, H. Wennerström, R. Strey and U. Würz, J. Chem. Soc., Faraday Trans., 1995, 91, 4269 RSC.
- B. M. Folmer and K. Holmberg, Colloids Surf., A, 2001, 180, 187 CrossRef CAS.
- N. W. Ashcroft and J. Leckner, Phys. Rev., 1966, 145, 83 CrossRef CAS.
- M. Leaver, A. Fogden, M. Holmes and C. Fairhurst, Langmuir, 2001, 17, 35 CrossRef CAS.
- S. S. Funari and G. Rapp, Proc. Natl. Acad. Sci. U. S. A., 1999, 96, 7756 CrossRef CAS.
- F. B. Rosewear, J. Am. Oil Chem. Soc., 1954, 31, 628 CrossRef CAS.
- V. Luzzati, H. Mustacchi, V. Skoulios and F. Husson, Acta Crystallogr., 1960, 13, 660 CrossRef CAS.
- F. Candau, F. Ballet, F. Debeauvais and J.-C. Wittmann, J. Colloid Interface Sci., 1982, 87, 356 CrossRef CAS.
- C. Vinches, C. Coulon and D. Roux, J. Phys. II, 1992, 2, 453 CrossRef CAS.
- H. Wennerstrom, J. Daicic, U. Olsson, G. Jerke and P. Schurtenberger, J. Mol. Liq., 1997, 72, 15 CrossRef.
- A. Maldonado, R. Ober, T. Gulik-Krzywicki, W. Urbach and D. Langevin, J. Colloid Interface Sci., 2007, 308, 485 CrossRef CAS.
- D. Roux, Physica A, 1995, 213, 168 CrossRef CAS.
- Y. Hendrikx, J. Charvolin and M. Rawiso, J. Colloid Interface Sci., 1984, 100, 597 CrossRef CAS.
- J. Charvolin, A. M. Levelut and E. T. Samulski, J. Phys. Lett., 1979, 40, L-587.
- S. Alperine, Y. Hendrickx and J. Charvolin, J. Phys. Lett., 1985, 46, L-27.
| This journal is © the Owner Societies 2009 |