Investigations of optical activity of natural products and chiral pharmaceuticals using liquid crystal technologies
Peter
Raynes
a,
Stephen J.
Cowling
b and
John W.
Goodby
*b
aDepartment of Engineering Science, The University of Oxford, Parks Road, Oxford, UK OX1 3PJ. E-mail: peter.raynes@eng.ox.ac.uk
bDepartment of Chemistry, The University of York, York, UK YO10 5DD. E-mail: jwg500@york.ac.uk; sc520@york.ac.uk
First published on 30th September 2009
Abstract
In this article we demonstrate the use of liquid crystal technologies in the determination of enantiomeric excess and in the sensing of molecular chirality, particularly at values near to zero. We use this technique to investigate the optical purities of the commercially available chiral natural product, menthol, and in the investigation of the optical activity of racemic ibuprofen.
Over recent years there has been a tendency to target the development of chiral materials for use in healthcare treatments. In such applications and therapies the optical purity is an important factor to consider.1 Two common materials, that have relevance in bio-medical applications, and which are available in their chiral and racemic forms are menthol and ibuprofen. In this article we quantitatively investigate the levels of optical purity in commercially available menthol by the amplification of its chiral properties through the self-organisation processes found in liquid crystals, and secondly, we qualitatively investigate ‘optical activity’ in racemic ibuprofen.
In organised fluids, such as liquid crystals, there are three levels of chiral complexity to consider.2 The first is point asymmetry or structural dissymmetry associated with molecular stereochemistry. The second level is related to reduced space symmetry, where the local molecular organisation, whether caused through associations between individual molecules or supramolecular ensembles, is asymmetric or dissymmetric. The reduced environmental or local symmetries are associated with physical properties such as ferroelectricity,3 antiferroelectricity,4 electroclinism,5 and secondary properties such as pyroelectricity6 and electrostriction (flexoelectricity).7 Such properties have been utilised in the determination of enantiomeric excess.8 The third level of chiral complexity is form chirality associated with the bulk organisation of the molecules. This is usually manifested in the form of helical macrostructures and frustrated defect-stabilised phases, for which properties such as helielectricity, thermochromism, and electrochromism can be observed.9 The pitch length in helical macrostructures is dependent on enantiomeric excess, ie the relative proportions of the enantiomers (or diastereoisomers) in the ensemble system. In the case of enantiomorphs, when the proportions are equal the pitch becomes infinite. Moreover, depending on the helix twist direction, ie right-hand or left-hand helix, chiral nematic phases can also be used to determine the spatial configuration for a chiral material possessing a single stereogenic centre.10
It is also known that helical macrostructures formed by chiral nematic phases have the ability to rotate the plane of incident plane polarized light many orders of magnitude more than equivalent systems when in their liquid states. Consequently, because of their abilities to amplify physical properties, when doped nematic phases can act as incredible sensors for molecular chirality.
In this article we describe a new and simple method using form chirality for the determination of the enantiomeric excess of and, to detect molecular chirality in, a chiral dopant material that is dissolved in an achiral nematic liquid crystal host.
1. Determination of enantiomeric excess
As the optical purity of a chiral dopant is increased from zero (racemate) to 100% in a chiral nematic phase, the pitch of the helix will be inversely dependent on the enantiomeric excess (ee), and the helical twisting power (HTP) and concentration of the dopant. In this article, we describe the use of a new method for measuring very long pitches in a host–chiral dopant nematic mixture as a very sensitive and general method for the determination of enantiomeric excess.Method
A new technique11 for the accurate measurement of very long pitches of chiral nematic liquid crystals has recently been reported, which employs the use of twisted nematic cells found in watch displays. Accurately constructed twisted nematic (TN) cells are readily available from LCD device manufacturers, and the ones used in this study were obtained from Merck. TN cells are generally constructured from ITO coated glass where the inner surfaces of the cells are coated with polyimide which is unidirectionally buffed. The inner buffed surfaces are arranged so that the buffed directions are perpendicular to one another and, crucially, particles to control the cell spacing are also included prior to assembly. When an achiral liquid crystal mixture is introduced into the cell the nematic phase spontaneously forms a quarter-helix on passing from one surface to the other. In this arrangement the plane of plane polarized light is rotated through 90° when it traverses the helical structure. For the 90° orientation of the two glass surfaces, two degenerate helical domains, associated with left- and right-handed quarter helices, are formed. The two domains are separated by disclination line defects, which can be observed by transmitted polarized-light optical microscopy, as shown diagrammatically in Fig. 1. | ||
| Fig. 1 A twisted nematic cell showing degenerate left- and right-hand domains separated by a disclination line. | ||
If a racemic mixture of a target dopant, such as 4′-(2-methylbutyl)-4-cyanobiphenyl (racemic CB15), solvated in a commercial liquid crystal mixture, eg E7, is placed into a conventional twisted nematic cell, then twist domains of opposite handedness are formed. However, if the dopant is chiral, eg S-4′-(2-methylbutyl)-4-cyanobiphenyl (CB15, Merck), one domain will predominate, see Fig. 2. If the twisted nematic cell is heated so that the mixture forms a liquid, and is then cooled back into the nematic phase, then disclination lines will form rapidly. As the mixture is cooled to room temperature the achiral domains for the racemic dopant will stabilise and become pinned by the spacers in the cell which are used to maintain the distance of the cell-gap, whereas those for a chiral mixture will rapidly coalesce and disappear, see Fig. 3. Furthermore, although not discussed here, the rate that the disclinations disappear is also related to the concentration, HTP and enantiomeric excess of the dopant.
 | ||
| Fig. 2 (a) Left- and right-hand twist domains separated by disclination lines; (b) single twist domain, the light defects are the cell spacers. | ||
 | ||
| Fig. 3 Disappearance of disclination loops on cooling a mixture of CB15 in E7 from the isotropic liquid in a TN cell under crossed polars, ×100. | ||
For smaller concentrations, HTP or enantiomeric excess of the dopant, the chirality is too weak to induce a single domain. However although it is weak, the chirality is still strong enough to induce a slight energy imbalance between the two domains, resulting in a bowing of the disclination lines, see Fig. 6. Equating the energy imbalance of the two domains with the energy per unit length of the disclination results in a simple relationship between the pitch P of the chiral nematic liquid crystal and the radius of curvature of the line R:11
| P = 2R |
For a target material that has a high helical twisting power, or has a high enantiomeric excess, quantitative measurements of the ee can be made at low concentrations of the target in the host liquid crystal using the standardised value of the HTP of the nominally optically pure chiral material and measurement of the pitch. Similarly, quantitative measurements of targets of low optical purity can also be achieved by the same method.
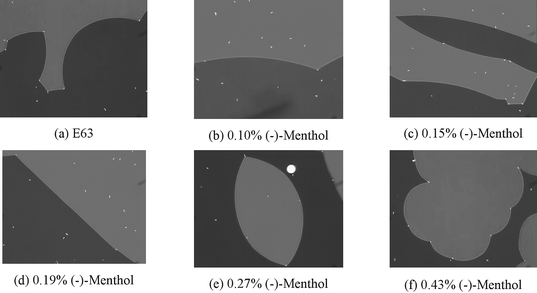
In our studies we selected menthol (Aldrich), see Fig. 4, as a non-liquid crystal chiral dopant because it is available in racemic and chiral forms. The menthol enantiomers used had the following certified enantiomeric ratios determined by chiral GC; 1R,3R,4S-(−)-menthol 99.7:0.3, ee = 99.4, and 1S,3S,4R-(+)-menthol 99.4:0.6, ee = 98.8. The following report pertains to results obtained for the higher optical purity (−)-menthol, which we solvated in the commercial host achiral liquid crystal material E63, see Fig. 5, to give mixtures of known, but low, concentrations (0.1 to 0.5 wt%). A set of twisted nematic cells of known twist angles between the rubbing directions of the upper and lower glass substrates were selected, into which the individual liquid crystal/dopant mixtures were inserted by capillary action. The mixtures in their respective twisted nematic cells are depicted together in Fig. 6. This figure shows the defect textures of the nematic phase using transmitted polarized light microscopy (×100) with a wave plate inserted above the objective in order to clearly show the left- and right-hand twist domains in light-grey and dark-grey relief, with disclination lines separating the domains.
 | ||
| Fig. 4 Enantiomers of menthol. | ||
 | ||
| Fig. 5 E63 commercial achiral liquid crystal host mixture. | ||
 | ||
| Fig. 6 Twist domains for mixtures of E63 and (−)-menthol at differing concentrations viewed by polarised optical microscopy (×100) using a wave plate to highlight the domains of opposite twist. | ||
In order to show change of sense of the bowing of the disclination lines as a dopant was added, the twisted nematic cells used were selected to have a twist angles slightly different from 90° to produce a slight initial bowing of the disclination lines when a pure nematic liquid crystal with no chiral dopant was inserted, see Fig. 6(a). The bowing is due to not having the degenerate 90° angle between the rub directions, which thereby energetically favours the formation of one twist domain over the other. In these non-90° cells the pitch is related to the radius of curvature through the equation:
| 1/P = 1/2(1/R − 1/RE63) |
In Fig. 6(b) to (f) the appearances of the twist domains are shown as a function of increasing concentration of the (−)-menthol. As the (−)-menthol concentration is increased it eventually balances the energetic inbalance caused by the non-90° twist angle of the cell, and as a consequence the disclination lines appear straight, see Fig. 6(d). Up until this point, Fig. 6(b) and (c), the light-grey twist domains show positive (convex) curvature. As the (−)-menthol concentration is increased further, Fig. 6(e) to (f), the disclination lines separating the domains become increasingly curved, and now the dark-grey domains show positive curvature. This then provides a simple sensor for chirality in a material.
The reciprocal of the radius of curvature as a function of concentration is shown in Fig. 7. For low twisting mixtures, the pitch of the chiral nematic mixture and the helical twisting power (HTP) of the chiral dopant can be extracted from the gradient of the line. The best fit to the data gives a value for the HTP of (−)-menthol of 1.0 × 10⁶ m−1, which is an order of magnitude lower than that for CB15. Thus, knowing the enantiomeric excess of the (−)-menthol used in the study and the HTP allows us to determine the ‘absolute’ enantiomeric excess from 0 ee to 100% ee.
 | ||
| Fig. 7 Variation of the reciprocal of the radius of curvature (mm−1) of the chiral nematic phase as a function of the concentration (wt%) of (−)-menthol in the achiral nematic host liquid crystal E63. | ||
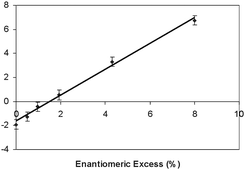
The measurement of ee is illustrated by adding 5 wt% of racemic menthol to the various mixtures of (−)-menthol in E63 used in the previous study, thereby generating mixtures of defined ee. Using cells with the same off-set angle as used in Fig. 7, the radii of curvature were determined as a function of enantiomeric excess for each of the mixtures, as shown in Fig. 8. Thus for an unknown composition of a mixture of enantiomers of menthol, by measuring the radius at known concentration and off-set angle between the cell surfaces, the enantiomeric excess can be readily obtained. This methodology also applies to any chiral material of unknown ee if its HTP has already been standardised in a given nematic solvent. This is similar to knowing the specific rotation of a material, except for the fact that the technique using a ‘liquid crystal polarimeter’ is much more sensitive and uses very little material. Our results show it may be possible to determine an ee as small as 0.001%, possibly 0.0001%, if a twisted Cano wedge cell is utilised.12
 | ||
| Fig. 8 Enantiomeric excess of a mixture of (−)-menthol and its racemate as a function of the reciprocal of the radius of curvature (mm−1) in mixtures with E63 at room temperature. | ||
Other chirality dependent liquid crystal properties, such as ferroelectricity and electroclinicity, have been investigated as potential methods for the evaluation of enantiomeric excess,8 however, they are not sensitive enough for use in the determination of enantiomeric excess. For example, in ferroelectrics at low enantiomeric excesses, the current reversal method for measuring the spontaneous polarization using a triangular wave form of the electric field produces no measurable peak, and so the ee cannot be determined. Similarly, methods based on the electroclinic effect are dependent on electrical fields and are limited by instrument sensitivity. Conversely, these techniques, just as with the twist cell method can be used as sensors, but with a reduced comparative sensitivity.
2. Sensors for molecular chirality
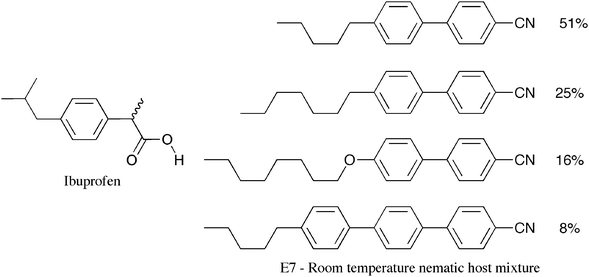
Liquid crystals, through amplification of their physical properties, are also excellent sensors of chirality.9,13 For example, ibuprofen (Fig. 9) was purchased from Aldrich and dissolved in various compositions into the room temperature nematic host mixture E7 (Merck). A number of twisted nematic cells were again selected to have twist angles slightly different from 90° to produce a slight initial bowing of the disclination lines when E7 with no ibuprofen was inserted. The cell with E7 inserted shows curved disclination lines, see Fig. 10 (left). In the other cells ibuprofen was incorporated at sequential higher concentrations. As the proportion of the ibuprofen increased the disclination lines became less curved and eventually the curvature disappears as shown across the other polarizing microscopephotomicrographs in Fig.10. This observation clearly suggests that the specimen is slightly chiral and not racemic. Tests with other sources of racemic ibuprofen show similar behaviour, indicating that chiral ‘racemic ibuprofen’ can be obtained from other commercial suppliers. | ||
| Fig. 9 Ibuprofen and the composition of E7 (wt%). | ||
 | ||
| Fig. 10 Change in curvature of the disclination lines as the amount of ibuprofen is increased in concentration in mixtures with E7. The photomicrographs were taken using a polarized transmitted light microscope with a wave plate inserted to provide the contrast (×100). | ||
Conclusions
In conclusion we have developed a simple and sensitive technique for the measurement of enantiomeric excess, using only small quantities of material, and which can be used as a universal signature and standard for a chiral material. The evaluation of enantiomeric excess of any material is only limited by the material's solubility in a host nematogen with retention of the nematic phase, and there is no need to develop complex analytical protocols as required by chiral GC. In addition, the method can also be used as a sensor and authentification procedure for chirality.Acknowledgements
The authors would like to thank Merck for the provision of twisted nematic test cells and the liquid crystal mixture E63.Notes and references
- S. Wendt and K. Zwingenberger, Nature, 1997, 385, 3003
; P. Huglund, T. Eriksson and S. Bjorkman, J. Pharmacokinet. Biopharm., 1998, 26, 363 Search PubMed
; W. Winter and E. Frankuss, Lancet, 1992, 339, 365 CrossRef CAS
.
- J. W. Goodby, J. Mater. Chem., 1991, 1, 307 RSC
.
- R. B. Meyer, Mol. Cryst. Liq. Cryst., 1977, 40, 33 CrossRef CAS
.
- A. Fukuda, Y. Takanishi, T. Isozaki, K. Ishikawa and H. Takezoe, J. Mater. Chem., 1994, 4, 997 RSC
.
- S. Garoff and R. B. Meyer, Phys. Rev. Lett., 1977, 38, 848 CrossRef CAS
.
- A. M. Glass, J. S. Patel, J. W. Goodby, D. H. Olson and J. M. Geary, J. Appl. Phys., 1986, 60, 2778 CrossRef CAS
.
- R. B. Meyer, Phys. Rev. Lett., 1969, 22, 918 CrossRef CAS
.
- D. M. Walba, L. Eshdat, E. Korblova, R. F. Shao and N. A. Clark, Angew. Chem., Int. Ed., 2007, 46, 1473 CrossRef CAS
.
-
D. G. McDonnell, in Thermotropic Liquid Crystals, Critical Reports on Applied Chemistry, ed G. W. Gray, Wiley, 1987, p. 120 Search PubMed
.
- G. W. Gray and D. G. McDonnell, Mol. Cryst. Liq. Cryst., 1977, 34, 211 CAS
.
- E. P. Raynes, Liq. Cryst., 2007, 33, 1215
.
- E. P. Raynes, Liq. Cryst., 2007, 34, 697 CrossRef CAS
.
- J. W. Goodby, I. M. Saez, S. J. Cowling, V. Görtz, M. Draper, A. W. Hall, S. Sia, G. Cosquer, S.-E. Lee and E. P. Raynes, Angew. Chem., Int. Ed., 2008, 47, 2 CrossRef
.
| This journal is © The Royal Society of Chemistry 2009 |
