Interference-free determination of abscisic acid and gibberellin in plant samples using excitation-emission matrix fluorescence based on oxidation derivatization coupled with second-order calibration methods
Yuan-Na
Li
,
Hai-Long
Wu
*,
Jin-Fang
Nie
,
Shu-Fang
Li
,
Yong-Jie
Yu
,
Shu-Rong
Zhang
and
Ru-Qin
Yu
State Key Laboratory of Chemo/Biosensing and Chemometrics, College of Chemistry and Chemical Engineering, Hunan University, Changsha, 410082, China. E-mail: hlwu@hnu.cn; Fax: (+86) 731 88821818; Tel: (+86) 731 88821818
First published on 6th October 2009
Abstract
A sensitive excitation-emission fluorescence method with a second-order calibration strategy is proposed to simultaneously determine abscisic acid (ABA) and gibberellin (GA) contents in extracts of leaves and buds of ginkgo. The methodology is based on the alternating normalization-weighed error (ANWE) and the parallel factor analysis (PARAFAC) algorithms, which make it possible that the ABA and GA concentration can be attained in extract of plants even in the presence of unknown interference from potential interfering matrix contaminants introduced during the simple pretreatment procedure. Satisfactory recoveries were obtained although the excitation and emission profiles of the analytes were heavily overlapped with each other and the background in the extracts. The limits of detection obtained for GA and ABA in leaf samples were 9.6 and 6.9 ng mL−1, respectively, which were in the concentration range (from hundreds to several ng g−1) for GA and ABA in leaves in different periods. Furthermore, in order to investigate the performance of the developed method, some statistical parameters and figures of merit of ANWE and PARAFAC are evaluated. The method proposed lights a new avenue to determine quantitatively phytohormones in extracts of plants with a simple pretreatment procedure, and may hold potential to be extended as a promising alternative for more practical applications in plant growth processes.
Introduction
Plant growth and development is regulated by internal signals and by external environmental conditions. Phytohormones are regulators produced by plants themselves, which control the physiological processes, and are grouped into four major classes including auxins, gibberellines, cytokinines and inhibitors.1Gibberellines (GA) as one kind of the endogenous growth promotors are a class of phytohormones that exert profound and diverse effects on plant growth and development, such as seed germination, epidermal cell elongation, leaf expansion and flower development.2,3Abscisic acid (ABA) is the chief representative of inhibitors; it modulates numerous aspects of plant growth and development, including seed dormancy, embryo maturation, stress responses and stomatal aperture.4 So it is often required to simultaneously determine ABA and GA in agriculture and plant physiology. On the other hand, although phytohormones are synthesized in various parts of woody plants, the primary sources are apical meristems and leaves, as shown by identification of naturally occurring phytohormones in buds and leaves.5 Therefore, it is important to simultaneously determine ABA and GA in extracts of leaves and buds.Extensive studies have been carried out to phytohormone analysis in plants. To date, a number of analytical techniques have been employed for quantitative analysis of ABA or GA, such as liquid chromatography-mass spectrometry,4capillary electrophoresis with laser-induced fluorescence,6capillary electrophoresis-mass spectrometry3 and gas chromatography.7 However, there is little information available on simultaneous determination of ABA and GA. Some methods have been employed for determination of phytohormones in plants, but common purification procedures such as liquid-phase extraction,8vapor-phase extraction, solid-phase extraction9 and solid-phase microextraction were used; they are extremely expensive and deleterious to the environment and human health due to the use of large amounts of organic solvents. In recent years, a high performance liquid chromatography (HPLC)-electrospray tandem mass spectrometry (MS) method was developed for simultaneous determination of phytohormones;1,10 it avoided liquid-phase extraction (LPE) in the purification of phytohormones in plants. Unfortunately, HPLC may inherently suffer from the disadvantages associated with the need of large amounts of hazardous organic solvents and time-consuming pretreatment procedures. Moreover, MS instruments are expensive and a matrix effect on MS detection, such as signal suppression,11 has been observed, so it is not well-suited to routine analysis to employ the two expensive hyphenated instruments. It is, therefore, important to exploit simpler and more sensitive analytical methods for simultaneous determination of ABA and GA. On the other hand, fluorescence spectroscopy as a versatile analytical technique has been extensively exploited in recent years because it is generally more sensitive than other detection systems such as classical UV absorption and less expensive than MS detection. In addition, the spectrofluorimetry method has also proved capable of acquiring a clean spectrum. ABA and GA have no suitable chromophores, they can fluoresce strongly after suitable treatment with concentrated sulfuric acid.12,13 In this work, therefore, we have attempted to make use of excitation-emission matrix fluorescence (EEM) to analyze the ABA and GA contents in extracts of leaf and bud of Ginkgo samples by second-order calibration methods.
With the rapid development of modern hyphenated instruments which generate second-order data, the second-order calibration-based analytical methodologies have been developed for quantitative analysis of complex multicomponent samples. Since the decomposition of a three-way data array stacked with a serial of response matrices measured for each sample is often mathematically unique, a second-order calibration method can overcome background interference and give rise to physical and chemical solutions. A great variety of second-order calibration algorithms have been proposed for a three-way data array, such as the generalized rank annihilation method (GRAM),14 parallel factor analysis (PARAFAC),15,16 alternating trilinear decomposition (ATLD),17 and self-weighted alternating trilinear decomposition (SWATLD).18 These methods which utilize “mathematical separation” instead of “physical or chemical separation” of both background and interferences make the quantification possible even if the unknown interferences are present in the predicted samples. This property is the so-called “second-order advantage”.19–21 In addition, these approaches not only determine the concentrations, but also provide spectral profiles of the components in the mixtures. With the second-order advantage, several second-order calibration methods have proved to have wide practical applications, mainly including drug analysis,22 environment monitoring,23 quality control and food analysis24 and cosmetic analysis.25 Furthermore, it was also employed recently for the determination of indole-3-acetic acid (IAA) in soil by our group.26
Recently, the alternating normalization-weighted error (ANWE)27 has been introduced as a second-order method, exploiting the “second-order advantage” and showing the important characteristics of handling multiple standard samples as PARAFAC. It has been tested using simulated data sets and relatively simple experimental examples. However, ANWE has not been seriously tested against real samples of high complexity, such as those of plant extract.
In the present study, a sensitive, rapid, and effective strategy for the directly quantitative analysis of ABA and GA in the extract of leaves and buds of ginkgo was proposed, by combining excitation-emission matrix fluorescence with second-order calibration methods based on the ANWE and PARAFAC algorithms, respectively. Herein, the external calibration method was utilized for simultaneous quantitative analysis of ABA and GA in leaf samples and quantification of ABA in the presence of GA in bud samples which show spectral overlapping. Moreover, the figures of merit, i.e. sensitivity (SEN), selectivity (SEL), limit of detection (LOD) and limit of quantification (LOQ) were compared, and the accuracy and precision of the proposed method was investigated by using the elliptical joint confidence region (EJCR) test.
Experimental
Reagents and chemicals
Abscisic acid (ABA) and gibberellin (GA) were purchased from Sigma; all other chemicals used were of analytical reagent grade and were used without further purification. GA and ABA were dissolved in dehydrated alcohol and diluted with ultrapure-grade water, so stock solutions of GA (83.3 µg mL−1) and ABA (50 µg mL−1) were prepared in brown volumetric flasks, respectively, and stored in the dark at 4 °C for one month.Derivatization procedure
A 5 mL volume of GA stock solution in a 50 mL beaker was slowly mixed with 15 mL of concentrated sulfuric acid (H2SO4), and heated in water bath at 100 °C for 35 min, then cooled quickly to room temperature. 30 min later, it was transferred to a 100 mL brown volumetric flask and diluted with 35% sulfuric acid, so that a working solution of 4.165 µg mL−1GA was made up. In the same way, a working solution of 2.5 µg mL−1ABA was also made up. It was done as reported in the literature.11,12Plant material and extraction procedure
The leaves and buds of ginkgo were collected from the trees in the campus of Hunan University. The collected samples were stored in plastic bags with ice and stored at −20 °C. 3.0 g buds were quantified and about 50 mL cooled 80% methanol added and the mixture left for a whole day in the refrigerator. The mixture was centrifuged at 4000 r min−1 for 20 min at 4 °C, then, filtrated with filter paper. The filtrate was stored at 4 °C in the refrigerator for future use. The crude extracts were treated in the same way as the GA and ABA working solutions. The leaves were treated in the same way as the buds.Apparatus
All of the fluorometric measurements were performed on an F-4500 fluorescence spectrophotometer (Hitachi, Japan) equipped with a continuous Xenon lamp. In all cases, a 1.00 cm quartz cell was used. The emission and excitation slit widths were 5 nm, respectively, and the scan rate was 1200 nm min−1. The spectral data were imported to a computer and analyzed in the Matlab environment. The programs of the PARAFAC and the ANWE algorithms were homemade.Analytical methodology
| Sample | Actual values/µg mL−1 | PARAFAC Recovery (%) | ANWE Recovery (%) | |||
|---|---|---|---|---|---|---|
| ABA | GA | ABA | GA | ABA | GA | |
| T1 | 0.150 | 1.166 | 97 | 96 | 96 | 96 |
| T2 | 0.225 | 1.000 | 104 | 97 | 103 | 97 |
| T3 | 0.350 | 0.833 | 103 | 97 | 102 | 97 |
| T4 | 0.400 | 0.750 | 99 | 98 | 98 | 98 |
| T5 | 0.500 | 0.417 | 93 | 102 | 93 | 103 |
| T6 | 0.600 | 0.333 | 92 | 101 | 92 | 102 |
| T7 | 0.700 | 0.292 | 91 | 104 | 91 | 104 |
| Average Recovery, % | 97 ± 5 | 99 ± 3 | 96 ± 5 | 99 ± 3 | ||
| RMSEP/µg mL−1 | 0.035 | 0.029 | 0.037 | 0.027 | ||
| T(t-test) t60.025 = 2.45 | 1.40 | 0.79 | 1.84 | 0.46 | ||
| Sample | Actual values/µg mL−1 | PARAFAC Recovery (%) | ANWE Recovery (%) | |||
|---|---|---|---|---|---|---|
| ABA | GA | ABA | GA | ABA | GA | |
| P1 | 0.150 | 1.166 | 105 | 97 | 108 | 101 |
| P2 | 0.225 | 1.000 | 101 | 97 | 102 | 99 |
| P3 | 0.350 | 0.833 | 105 | 103 | 106 | 106 |
| P4 | 0.400 | 0.750 | 89 | 98 | 91 | 105 |
| P5 | 0.500 | 0.583 | 93 | 107 | 94 | 115 |
| Average Recovery, % | 99 ± 7 | 100 ± 4 | 100 ± 7 | 105 ± 6 | ||
| RMSEP/µg mL−1 | 0.029 | 0.037 | 0.026 | 0.055 | ||
| T(t-test) t40.025 = 2.78 | 0.28 | 0.18 | 0.054 | 1.61 | ||
| Sample | Actual value/µg mL−1 | PARAFAC Recovery (%) | ANWE Recovery (%) |
|---|---|---|---|
| B1 | 0.213 | 98 | 93 |
| B2 | 0.438 | 99 | 95 |
| B3 | 0.488 | 104 | 100 |
| B4 | 0.588 | 102 | 100 |
| B5 | 0.688 | 94 | 93 |
| Average Recovery,% | 99 ± 4 | 96 ± 4 | |
| RMSEP/µg mL−1 | 0.024 | 0.029 | |
| T(t-test) t40.025 = 2.78 | 0.31 | 2.13 | |
Chemometric analysis
![[X with combining low line]](https://www.rsc.org/images/entities/b_char_0058_0332.gif) is obtained with dimensions I × J × K. A trilinear model for the three-way array has the form:
is obtained with dimensions I × J × K. A trilinear model for the three-way array has the form: | (1) |
, ain, bjk and ckn are the elements of the I × N matrix A, the J × N matrix B and the K × N matrix C, respectively. eijk is the element of a three-way residual array ![[E with combining low line]](https://www.rsc.org/images/entities/b_char_0045_0332.gif) . N denotes the number of factors, which is really the total number of detectable physically meaningful components of interest as well as the interferents and the background. The trilinear model has been accepted owing to its consistency with Beer's law in chemistry.
. N denotes the number of factors, which is really the total number of detectable physically meaningful components of interest as well as the interferents and the background. The trilinear model has been accepted owing to its consistency with Beer's law in chemistry.
The alternating normalization-weighted error (ANWE) algorithm was recently developed by our group.27 The method decomposed three-way data arrays by alternatively minimizing three different objective functions. According to the above-mentioned objective functions, an alternating normalization-weighted error method is employed to exploit the solution. The iterative procedure and calibration for ANWE are similar to the above one for PARAFAC.
Results and discussion
Spectral characteristics
Under some experimental conditions described in detail in the relevant part of the experimental, abscisic acid (ABA) and gibberellin (GA) were transformed into fluorescent derivatives with high fluorescent quantum yield, respectively. The three-dimensional excitation-emission matrix fluorescence spectra of pure ABA and GA in standard samples in the well-chosen excitation and emission wavelength ranges which avoid Rayleigh and Raman scatterings are shown in Fig. 1. As shown in Fig. 1a, the oxidation derivative of ABA presents a broad emission band with a peak value at 487 nm and excitation maxima at 372 nm. Moreover, the maximal excitation and emission peaks for the oxidation derivative of GA are found to be at 362 nm and 454 nm, respectively (Fig. 1b). | ||
| Fig. 1 Three-dimensional plots of the excitation-emission fluorescence spectra. Figures (a) and (b) are for pure abscisic acid (ABA) and gibberellin (GA), respectively. | ||
Signal stability
The oxidation derivatives of ABA and GA were repetition-scanned for three hours to ensure their stability, respectively. The scan was repeated over a single day for one week at room temperature. It showed that the fluorescent intensity of each working solution was stable.Analytical methodology
Prior to analysis, the reliability of the calibration models should be validated. So the three-way array formed by stacking the excitation-emission fluorescence matrices for eight calibration samples and seven test samples (T1–T7) was decomposed using both the parallel factor analysis (PARAFAC) and the alternating normalization-weighted error (ANWE) algorithms. The predicted recoveries of ABA and GA in seven test samples using both PARAFAC and ANWE are shown in Table 1. The average recoveries of GA and ABA were found to be 99 ± 3 and 97 ± 5% for PARAFAC and 99 ± 3 and 96 ± 5% for ANWE, respectively. The t-test was performed to compare the recoveries of the two phytohormones with the ideal value of 100%, i.e. ,
, ![[X with combining macron]](https://www.rsc.org/images/entities/char_0058_0304.gif) is the average recovery, µ0 is 100%, n is the degree of freedom, and the confidence level is 95%. The null hypothesis is: “the average recovery is equal to 100%”. T < t60.025 = 2.45, the results for GA and ABA are acceptable and satisfactory as shown in Table 1. The results highlight the fact that the chosen second-order calibration algorithms are reliable for the simultaneous determination of ABA and GA in artificial samples; we are actually interested in obtaining satisfactory results from real samples such as extracts of plants-based samples, whose components are unknown beforehand. Therefore, the specific implementation as well as the study of plant samples will be discussed in detail in the following part.
is the average recovery, µ0 is 100%, n is the degree of freedom, and the confidence level is 95%. The null hypothesis is: “the average recovery is equal to 100%”. T < t60.025 = 2.45, the results for GA and ABA are acceptable and satisfactory as shown in Table 1. The results highlight the fact that the chosen second-order calibration algorithms are reliable for the simultaneous determination of ABA and GA in artificial samples; we are actually interested in obtaining satisfactory results from real samples such as extracts of plants-based samples, whose components are unknown beforehand. Therefore, the specific implementation as well as the study of plant samples will be discussed in detail in the following part.
Five prediction samples (P1–P5) were prepared with the different concentrations of ABA and GA in leaf extracts. The samples were measured and a three-way data array was produced. The core consistency diagnostic (CORCONDIA) test was used to estimate the component number. The core consistency diagnostic was proposed by Bro.28 The core consistency is calculated as a function of a trial number of components. When the selected number is bigger than the correct factor number, the core consistency is close to zero, even negative. When the selected number is equal to or smaller than the correct number, the core consistency is close to one. Generally we think the number is equal to or smaller than the correct number when the value is bigger than 0.5. Three components were suggested for the model as shown in Fig. 2.
 | ||
| Fig. 2 Core consistency values as a function of the trial number of components for analysis of the leaf samples. | ||
Table 2 summaries the results from the predictions for the leaf samples. The three-factor model was performed with both PARAFAC and ANWE. For ABA, the predicted recoveries gained from PARAFAC and ANWE are 99 ± 7 and 100 ± 7%, respectively. For GA, the average predicted recoveries gained from PARAFAC and ANWE are 100 ± 4 and 105 ± 6%, respectively. A t-test was performed to compare the recoveries of GA and ABA with the ideal value of 100%. T < t40.025 = 2.78, it is acceptable and satisfactory. The results reveal that second-order calibration methods based on PARAFAC and ANWE algorithms, respectively, allow for the satisfactory prediction capacity of simultaneous determination of ABA and GA contents in complex extracts of leaves of gingko matrix.
Figs. 3 and 4 show the actual spectral profiles and the profiles from the decomposition of the excitation-emission matrix fluorescence data array obtained for both the calibration and predicted samples using PARAFAC (Fig. 3) and ANWE (Fig. 4) with three factors. The profiles associated with the emission mode are shown in Fig. 3(a) and Fig. 4(a) and the profiles related to the excitation mode are shown in Fig. 3(b) and Fig. 4(b). The figures indicate that the spectral profiles of interferents from the gingko leaves background spread all measured wavelength, both excitation and emission, and overlap with ABA and GA spectral profiles. Moreover, the excitation and emission spectral profiles of ABA and GA overlap with each other, respectively. Therefore, it is difficult to simultaneously determine the ABA and GA in extracts of gingko leaves in a straightforward way using sensitive spectrofluorimetry without further separation. Furthermore, it was also found that not only were the excitation and emission spectral profiles of ABA and GA similar to their actual ones, but also the structures of the excitation and emission modes of the interesting analytes were not affected by the variety of the algorithms chosen, which indicated that the obtained results are accurate and reliable and that both methods have the “second-order advantage”, i.e. can resolve the spectral profiles from the unknown interference.
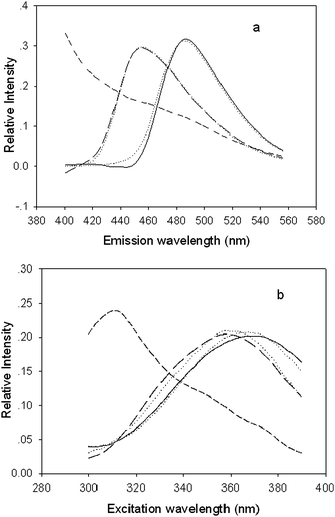 | ||
| Fig. 3 Normalised emission (a) and excitation (b) profiles, which were resolved from fluorescence EEM of the ginkgo extracts by the PARAFAC method with three factors. Solid, long-dash, and short-dash lines represent the spectral profiles of ABA, GA, and interferents of ginkgo leaf, respectively. The dotted line denotes actual ABA and GA. | ||
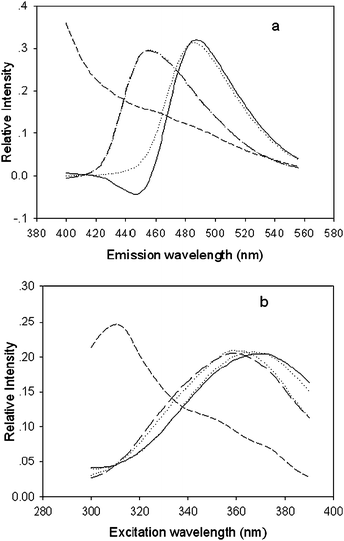 | ||
| Fig. 4 Normalised emission (a) and excitation (b) profiles, which were resolved from fluorescence EEM of the ginkgo extracts by the ANWE method with three factors. Solid, long-dash, and short-dash lines represent the spectral profiles of ABA, GA, and interferents of ginkgo leaf, respectively. The dotted line denotes actual ABA and GA. | ||
Figs. 5 and 6 show the resolved excitation-emission spectral profiles together with the actual ones of ABA and GA, respectively, in bud samples using the PARAFAC (Fig. 5) and ANWE (Fig. 6) algorithms when the chosen factor number was set to three. Figs. 5(a) and 6(a) show the emission spectral profiles by PARAFAC and ANWE algorithms, respectively. Fig. 5(b) and 6(b) show the excitation spectral profiles using PARAFAC and ANWE, respectively. These emission and excitation spectral profiles were collected into matrices A and B, respectively. One can observe that the profiles of the GA, ABA and the profile of the background were overlapped heavily. Looking at the profiles one can judge the difficulty in analyzing the mixture samples. From the figures, the resolved spectral profiles of ABA and GA and the actual ones are similar, which implies the good ability of qualitative analysis of the second-order calibration methods.
 | ||
| Fig. 5 Normalised emission (a) and excitation (b) profiles, which were resolved from fluorescence EEM of the ginkgo extracts by the PARAFAC method with three factors. Solid, long-dash, and short-dash lines represent the spectral profiles of ABA, GA, and interferents of ginkgo bud, respectively. The dotted line denotes actual ABA and GA. | ||
 | ||
| Fig. 6 Normalised emission (a) and excitation (b) profiles, which were resolved from fluorescence EEM of the ginkgo extracts by the ANWE method with three factors. Solid, long-dash, and short-dash lines represent the spectral profiles of ABA, GA, and interferents of ginkgo bud, respectively. The dotted line denotes actual ABA and GA. | ||
As can be seen from Figs. 3 to 6, the excitation spectral profiles and emission spectral profiles of ABA in both actual and resolved cases are very similar, respectively, in despite of choosing different algorithms or being in the different matrices. It proves again that the property of the “second-order advantage” is advantageous and the second-order calibration methods based on PARAFAC and ANWE algorithms not only determine the concentrations of analytes, but also extract the spectral profiles of analytes from the different matrices. Besides this, for model development, they do not need large training sets which are required for first-order methodologies.
Statistical validation and figures of merit
The determination of figures of merit (FOM) is an important requisite for method comparison, such as SEN, SEL, LOD and LOQ. In second-order calibration, they are understood by resorting to the useful concept of net analyte signal (NAS), firstly developed by Lorber.29 The sensitivity (SEN) for a particular analyte is estimated as the net analyte signal at unit concentration, the following equation seems to apply to the presently studied case:30| SENn,HCD = k{[(ATA)−1]nn[(BTB)−1]nn}−1/2 | (2) |
| SELn,HCD = {[(ATA)−1]nn[(BTB)−1]nn}−1/2 | (3) |
The limit of detection (LOD) is calculated as LOD = 3.3s(0),32 where s(0) is the standard deviation in the predicted concentration of the analyte of interest in three blank samples. The limit of quantification (LOQ) is computed as LOQ = 10s(0).
The study based on second-order calibration also furnished analytical figures of merit. The root-mean-square error of prediction (RMSEP) is determined as:  , where M is the number of prediction samples, cact and cpred are the actual and predicted concentrations of the analytes, respectively. Table 4 collects the figures of merit, including SEN, SEL, as well as LOD and LOQ, for direct determination of ABA and GA with different concentration magnitudes in leaf and bud samples using both PARAFAC and ANWE algorithms. The LODs for GA and ABA in leaf samples were calculated to be 9.6 and 6.9 ng mL−1, respectively. One can find that the proposed second-order calibration method based on either PARAFAC or ANWE can yield satisfactory predictive capacity for determination of ABA and GA in the two complex extracts of plants. Keeping in mind the complexity of the problem, it should also be noted that any purification and separation procedure was not employed in this study.
Moreover, for the sake of a further investigation into the accuracy of the two proposed algorithms of PARAFAC and ANWE, a linear-regression analysis of the actual versus the predicted concentration was applied.33 The calculated intercept and slope were compared with their ideal point (0, 1), based on the elliptical joint confidence region (EJCR) test. If the ellipses contain the point (0, 1) for intercept and slope, respectively, showing the reference values and results do not present a significant difference at the level of 99% confidence. Fig. 7 gives the results of EJCRs for both PARAFAC and ANWE algorithms. It shows that the ideal point (0, 1) labeled with an asterisk (*) lies in all EJCRs. In the leaf and bud matrices, the ellipses corresponding to the ANWE algorithm were smaller than that related to the PARAFAC algorithm for ABA, i.e. the confidence region was closer to the ideal point (0, 1). These results proved again that both algorithms could allow for accurate determination of ABA in complex matrices, and the recently introduced ANWE algorithm is at least the same as the widely accepted PARAFAC algorithm for determination of ABA in leaf and bud samples on the elliptical joint confidence region (EJCR) test.
 | ||
| Fig. 7 EJCRs for ABA applying PARAFAC and ANWE with N = 3. The asterisk (*) indicates the ideal points (0, 1). Solid and dotted lines correspond to the EJCRs in leaf samples by applying ANWE and PARAFAC, respectively. Dashed and dash-dot lines correspond to the EJCRs in a bud sample by applying ANWE and PARAFAC, respectively. | ||
Conclusions
The research work indicated in this paper establishes that the coupling of a second-order calibration based on either the ANWE or the PARAFAC algorithms with excitation-emission matrix fluorescence measurements yields a powerful method for the simultaneous determination of ABA and GA contents in extracts of leaves and buds of ginkgo. The study shows that fluorescence is adequate as a screening method to obtain good recovery values in all the analyzed extracts of plants. Using ANWE or PARAFAC, the signal of analytes can be extracted from the plant samples, even in the presence of unknown interference, fully exploiting “second-order advantage”. In addition to the outstanding sensitivity and selectivity achieved in the present work, other properties should be remarked upon; the proposed method is performed without using toxic organic solvents, a fact which is essential for the environmental safety. Its simple, cheap and rapid speed of analysis, high resolution and sensitivity, as well as low LOD highlight that such an approach can become a promising alternative for practical application in plant growth processes.Acknowledgements
The authors gratefully acknowledge the National Natural Science Foundation of China (Grant Nos. 20775025, and 20435010) and Program for Changjiang Scholars and Innovative Research Team in University (PCSIRT) for financial support.References and notes
- S. J. Hou, J. Zhu, M. Y. Ding and G. H. Lv, Talanta, 2008, 76, 798–802 CrossRef CAS.
- L. V. Pozo, Sci. Hortic., 2001, 91, 251–260 CrossRef CAS.
- L. Ge, C. Y. Chyn Peh, J. W. Hong Yong and S. N. Tan, J. Chromatogr., A, 2007, 1159, 242–249 CrossRef CAS.
- M. López-Carbonell and O. A. Jáuregui, Plant Physiol. Biochem., 2005, 43, 407–411 CAS.
- S. G. Pallardy, Plant hormones and other signaling molecules. Physiology of woody plants, 3rd edn; Elsevier/Academic press, Amsterdam, 2008; 367–377 Search PubMed.
- X. Liu, L. Ma, Y. W. Lin and Y. T. Lu, J. Chromatogr., A, 2003, 1021, 209–213 CrossRef CAS.
- E. W. Weiler, Planta, 1979, 144, 255–233 CrossRef CAS.
- A. Durgbanshi, V. Arbona, O. Poza, O. Miersch, J. V. Sancho and A. Gomez-Cadenas, J. Agric. Food Chem., 2005, 53, 8437–8442 CrossRef CAS.
- P. I. Dobrev, L. Havlíček, M. Vágner, J. Malbeck and M. Kamíneck, J. Chromatogr., A, 2005, 1075, 159–166 CrossRef CAS.
- X. Q. Pan, R. Welt and X. M. Wang, Phytochemistry, 2008, 69, 1773–1781 CrossRef CAS.
- A. C. Hogenboom, M. P. Hofman, D. A. Jolly, W. M. A. Niessen and U. A. Th. Brinkman, J. Chromatogr., A, 2000, 885, 377–388 CrossRef CAS.
- H. Wu and Y. Wan, J. Xuzhou Normal Uni. (Nature Science), 2002, 20, 39–41 Search PubMed.
- Q. H. Xue, D. Li and L. Tang, Acta Univ. Agric. Boreali-occidentalis, 2000, 28, 34–39 Search PubMed.
- E. Sánchez and B. R. Kowalski, Anal. Chem., 1986, 58, 496–499 CrossRef CAS.
- R. A. Harshman, UCLA Working Papers in Phonetics, 1970, 16, 1–84 Search PubMed.
- J. D. Carroll and J. J. Chang, Psychometrika, 1970, 35, 283–319 CrossRef.
- H. L. Wu, M. Shibukawa and K. Oguma, J. Chemom., 1998, 12, 1–26 CrossRef CAS.
- Z. P. Chen, H. L. Wu, J. H. Jiang, Y. Li and R. Q. Yu, Chemom. Intell. Lab. Syst., 2000, 52, 75–86 CrossRef CAS.
- G. M. Escandar, N. M. Faber, H. C. Goicoechea, A. M. de la Peña, A. C. Olivieri and R. J. Poppi, TrAC, Trends Anal. Chem., 2007, 26, 752–765 CrossRef CAS.
- A. C. Olivieri, Anal. Chem., 2008, 80, 5713–5720 CrossRef CAS.
- H. L. Wu, J. F. Nie, Y. J. Yu and R. Q. Yu, Anal. Chim. Acta, 2009, 650, 131–142 CrossRef CAS.
- F. Cañada-Cañada, A. Espinosa-Mansilla, A. Muñoz de la Peña, A. J. Girón and D. González-Gómez, Food Chem., 2009, 113, 1260–1265 CrossRef CAS.
- S. A. Bortolato, J. A. Arancibia and G. M. Escandar, Anal. Chem., 2008, 80, 8276–8286 CrossRef CAS.
- S. H. Zhu, H. L. Wu, B. R. Li, A. L. Xia, Q. J. Han, Y. Zhang, Y. C. Bian and R. Q. Yu, Anal. Chim. Acta, 2008, 619, 165–172 CrossRef CAS.
- J. F. Nie, H. L. Wu, S. H. Zhu, Q. J. Han, H. Y. Fu, S. F. Li and R. Q. Yu, Talanta, 2008, 75, 1260–1269 CrossRef CAS.
- Y. N. Li, H. L. Wu, S. H. Zhu, J. F. Nie, Y. J. Yu, X. M. Wang and R. Q. Yu, Anal. Sci., 2009, 25, 83–88 CrossRef CAS.
- A. L. Xia, H. L. Wu, S. H. Zhu, Q. J. Han, Y. Zhang and R. Q. Yu, Anal. Sci., 2008, 24, 1171–1176 CrossRef CAS.
- R. Bro and H. A. L. Kiers, J. Chemom., 2003, 17, 274–286 CrossRef CAS.
- A. Lorber, Anal. Chem., 1986, 58, 1167–1172 CrossRef CAS.
- A. C. Olivieri and N. M. Faber, J. Chemom., 2005, 19, 583–592 CrossRef CAS.
- A. C. Olivieri, Anal. Chem., 2005, 77, 4936–4946 CrossRef CAS.
- R. Boqué, J. Ferré, N. M. Faber and F. X. Rius, Anal. Chim. Acta, 2002, 451, 313–321 CrossRef CAS.
- A. G. González, M. A. Herrador and A. G. Asuero, Talanta, 1999, 48, 729–736 CrossRef CAS.
| This journal is © The Royal Society of Chemistry 2009 |