The development, optimization and validation of an ELISA bioanalytical method for the determination of Cetuximab in human serum
Jamil
Hantash
*,
Mary
Smidt
* and
Ronald R.
Bowsher
*
Millipore, Inc., 15 Research Park Dr. St. Charles, MO 63304, USA. E-mail: jamil_hantash@millipore.com; mary_smidt@millipore.com; ron_bowsher@millipore.com; Fax: +636-442-6058; Tel: +636-441-8400
First published on 24th September 2009
Abstract
Cetuximab is a chimeric IgG1 monoclonal antibody that inhibits epidermal growth factor receptor (EGFR). Additionally, Cetuximab, used in combination therapy, potentiates the effects of chemotherapy and radiation therapy in eradicating well-established tumors. Recently, a combination of Cetuximab and newly developed chemotherapeutic candidate drugs is being investigated for use as a new-generation chemotherapy cocktail. Therefore, there is an increasing need for a highly selective immunoassay to detect Cetuximab at low concentration levels in human serum. We report a newly developed ELISA that is validated under FDA-GLP regulations for the detection of Cetuximab. It is highly selective and achieves a lower limit of quantitation of 0.31 µg/mL. We have validated a selective and sensitive bioanalytical method.
Introduction
Cetuximab (IMC-C225, Erbitux® ImClone Systems Inc., New York, NY) is a chimeric human murine derivative IgG1 monoclonal antibody (mAb) that binds the extra-cellular domain of the EGFR.1–3 It is a 152-kDa molecule composed of four polypeptide chains: two identical heavy chains and two identical light chains, consisting of 449 and 214 amino acids, respectively, bound by covalent and non-covalent bonds.4 The bond with EGFR is characterized by a higher affinity (Kd = 0.1–0.2 nM) than either endogenous ligand, as epidermal growth factor (EGF), or transforming growth factor alpha.5 This binding inhibits activation of the receptor tyrosine kinase6 and the associated downstream signaling that includes the mitogen-activated protein kinase, phosphoinositide 3-kinase/Akt and the Janus kinases/signal transducers and activator of transcription (Stat) pathways. Furthermore Cetuximab induces antibody-mediated receptor dimerization, internalization and degradation leading to receptor down-regulation.7 In addition, it exhibits antibody-dependent cellular cytotoxicity that could contribute to its antitumor effect.8The EGFR, also called ErbB1 or HER1, is a transmembrane receptor tyrosine kinase that belongs to the HER family receptors. This receptor family includes four related receptors: the EGFR (ErbB1/EGFR/HER1), ErbB2 (HER2/neu), ErbB3 (HER3) and ErbB4 (HER4). These receptors are trans-membrane glycoproteins formed by an extra-cellular ligand-binding domain, a transmembrane region and an intracellular tyrosine kinase domain with a regulatory carboxyl terminal segment.9,10 EGFR is expressed on normal and malignant epithelial cells and it plays an important role in tumor biology. In fact, it promotes proliferation, metastasis, angiogenesis and inhibition of apoptosis.11,12
The most common EGFR alteration in tumor cells is its over-expression that may lead to ligand- independent receptor dimerization. EGFR is frequently over-expressed in human tumors including breast cancer, lung cancer, glioblastoma, bladder carcinoma, head and neck cancer, ovarian carcinoma, colorectal cancer and prostate cancer.13
The current research effort toward development of therapeutic agents for second-generation treatment of colorectal cancer in combination with Cetuximab requires a selective and sensitive bioanalytical method. Therefore we report the optimization and validation of an enzyme-linked immunosorbent assay (ELISA) for the quantitative determination of Cetuximab (Erbitux®) in human serum under Food and Drug Administration (FDA) regulations.
Methods
Materials and reagents
Reference Standard Cetuximab was purchased from Bristol-Myers Squibb, Lot # 07C00341A. Carrier-free EGFR was purchased from R&D Systems. Anti-Human HRP conjugate antibody (catalog # 05-3320) and Anti-Human unconjugated antibody (catalog # 05-3300) was purchased from Zymed. Normal Human Serum (NHS) was purchased from Bioreclamation catalog # HMSRM. TMB One Component Substrate was purchased from BioFX, catalog # TMB-0100-01. Blocker Blotto TBS (catalog # 37530) and Blocker Casein TBS (catalog # 37532) was purchased from Pierce. Phosphate Buffered Saline - 10X (PBS) (catalog # BP399-1), Hydrochloric Acid - 10 N (HCl) (catalog # SA49) and 10X Tris-Buffered Saline (TBS) (catalog # BP2471) was purchased from Fisher. Tween-20, was purchased from Sigma-Aldrich, catalog # P-7949. Sodium Hydroxide - 10 N (NaOH) was purchased from Fluka, catalog # 72068. Ultrapure water was obtained from systems such as Milli-Q Water Purification System.Assay development
The goals in developing an ELISA assay were: 1) a maximized signal-to-noise ratio which will increase the sensitivity level, 2) a robust, reproducible assay for testing samples and 3) the ability to measure the antigen in a biological matrix over a biologically relevant assay range (dynamic range). Therefore, ideal concentrations of each assay reagent must be established empirically. The signal generated by a sample containing analyte, relative to the signal of the same sample without analyte, is the signal-to-noise (signal:noise) ratio. As the signal:noise ratio increases, the assay improves for measuring small amounts of antigen.The assay parameters that were optimized included the concentration of EGFR coated on the plate, the buffer used for coating the plate, the buffer used for blocking, sample incubations and detection antibody incubations as well as the specificity and specific activity of the detection antibody. Optimal color development occurs in about 30 minutes. In order to achieve this, the specific activity of the horseradish peroxidase (HRP) -conjugated detection antibody was reduced in order to slow the rate of color development due to HRP activity. Rather than diluting the detection antibody to achieve this rate, mixtures of conjugated and unconjugated preparations of the same antibody clone were made keeping the total antibody dilution at 1:2000.
Protocol
A representation of the assay protocol is shown in Fig. 1. Carrier-free EGFR was incubated in a Nunc Maxisorb flat-bottomed plate. The plate was blocked with assay buffer (Blocker Blotto in TBS:Blocker Casein in TBS; 20:80; v/v). The samples were diluted to a minimum required dilution (MRD) of 1:100 and incubated for 1–2 hours. A secondary antibody mix of HRP-conjugated and -unconjugated antibody (ratio of 1:5 v/v) was added and the TMB reaction end point was used to detect the anti-drug antibody complex formed.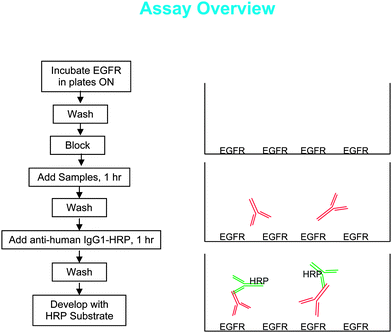 | ||
| Fig. 1 The validated assay consisted of five steps, including coating the plate with the target molecule for Cetuximab, incubating samples in matrix, and detecting with a conjugated antibody for colorimetric measurement. | ||
Assay validation

Freeze-thaw stability was assessed following five freeze-thaw cycles. One set of samples was thawed and refrozen once, another group twice, a third group three times, a fourth group four times and a fifth group five times. The final thaw of each group was timed to occur on the same day. The samples from the five groups were assayed simultaneously with a set of reference controls that had not gone through additional freeze-thaw cycles. The initial freezing period was at least 24 hours and each subsequent freeze-thaw cycle required that validation samples be stored frozen for a minimum of 12 hours followed by thawing under appropriate conditions. Stability samples were analyzed, for each concentration and condition, to generate three reportable results per concentration and condition.
Ambient temperature stability was assessed after storing one set of the validation samples at ambient temperature (20–25 °C) and a second set at 2–8 °C for approximately 4 and 24 hours. A set of validation samples that had not previously been removed from approximately −70 °C (reference) was analyzed with the validation samples. The % difference from reference was calculated for each sample.
The stability of Cetuximab (Erbitux®) in the primary stock solution (formulation buffer) stored at ambient temperature (20–25 °C) for approximately six hours was determined by comparing the mean responses (n = 12) of identical concentrations of a stored primary stock solution and a primary stock solution prepared from a fresh, refrigerated aliquot. The % difference of the responses of the two solutions was calculated as follows:

The stability of Cetuximab (Erbitux®) in the working stock (200 µg/mL in PBS + 1% BSA) stored at ambient temperature (20–25 °C) for approximately six hours was determined by comparing the mean responses (n = 12) of identical concentrations of a stored primary stock solution and a primary stock solution prepared from a fresh, refrigerated aliquot. The % difference of the responses of the two solutions was calculated as follows:

Results and discussion
Assay optimization
To increase the signal, the coating protein, EGFR, was applied at a higher concentration (1.65 ug/well) than is customarily used when coating with an antibody. It was also determined that a higher signal was obtained when EGFR was coated in PBS rather than the Carbonate/Bicarbonate buffer customarily used with antibodies. The signal was good after one hour of coating, although there was a small increase with an overnight incubation (Fig. 2).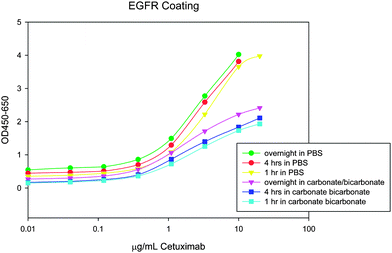 | ||
| Fig. 2 The signal (OD450–OD650) increased with coating time and was higher in PBS than in bicarbonate buffer. | ||
Several buffers were tested for plate blocking and as an assay buffer to use during sample and detection incubations. A 20%/80% mixture of Blotto and Casein increased signal-to-noise ratio by about 2 fold greater than StartingBlock and was chosen for both blocking and assay buffer functions (data not shown).
The detection antibody also affected the signal-to-noise ratio. The first detection antibody tested reacted with IgG1, 2, 3, and 4; however, an antibody with specificity for IgG1 had lower background signal (Cetuximab is IgG1) (Fig. 3).
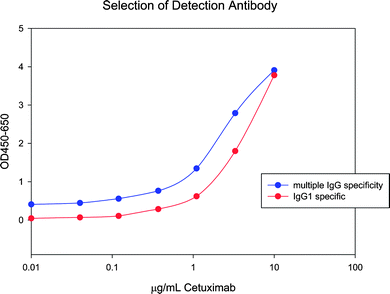 | ||
| Fig. 3 A lower background signal was obtained when a more specific detection antibody was used. Top curve represents multiple IgG specificity and lower curve represents IgG1 specificity. | ||
The desired rate of color development from HRP activity was adjusted by mixing 1 part conjugated- with 4 parts unconjugated-HRP (see Fig. 4). The mix reduced the specific activity of the HRP label without resulting in a decrease of antibody. Using a diluted anti-human HRP conjugated antibody would potentially have been a limiting step in the development of a dose-response curve.
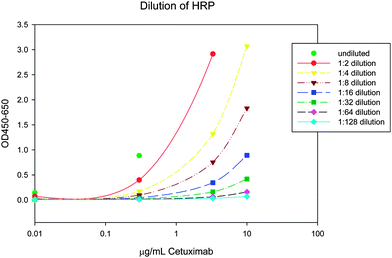 | ||
| Fig. 4 HRP-conjugated detection antibody was diluted with unconjugated antibody from the same clone and used together in the assay . The optical density (OD) was determined after 30 min of incubation. With an optimal dilution of 1:5, the upper limit of quantification (10 µg/mL) had an OD of just under 3. | ||
Assay validation
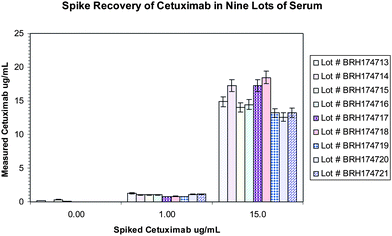 | ||
| Fig. 5 Nine lots of human sera were spiked at low and high levels and tested in the assay . The boxes within the graph show the range of responses that were within 20% of the expected concentration. | ||
| Cetuximab Concentration µg/mL | Dilution factor | Irinotecan Concentration µg/mL | ||||||||||
|---|---|---|---|---|---|---|---|---|---|---|---|---|
| 0 | 0.37 | 1.1 | 3.3 | 10 | 30 | 0 + 1% DMSO | Mean | Standard Deviation | Precision (%CV) | % Relative to 0 | ||
| 360 | 45 | 9.861 | 9.009 | 8.514 | 8.508 | 8.416 | 8.166 | 9.078 | 8.615 | 0.356 | 0.0 | 87.4 |
| 160 | 20 | 9.184 | 8.94 | 8.86 | 8.458 | 8.422 | 8.102 | 8.551 | 8.556 | 0.308 | 0.0 | 93.2 |
| 50 | 6.25 | 9.678 | 9.519 | 9.148 | 9.036 | 8.781 | 8.601 | 8.343 | 8.905 | 0.419 | 0.0 | 92.0 |
| Mean | 9.57 | 9.16 | 8.84 | 8.67 | 8.54 | 8.29 | 8.66 | |||||
| Standard Deviation | 0.35 | 0.32 | 0.32 | 0.32 | 0.21 | 0.27 | 0.38 | |||||
| Precision (%CV) | 3.7 | 3.5 | 3.6 | 3.7 | 2.4 | 3.3 | 4.4 | |||||
| % Relative to 0 | 100.0 | 95.6 | 92.3 | 90.5 | 89.2 | 86.6 | 90.4 | |||||
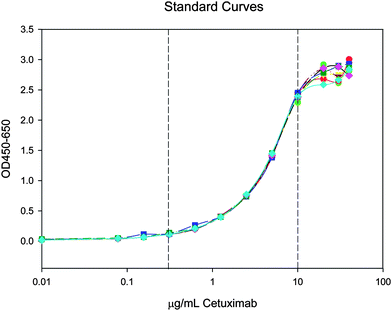 | ||
| Fig. 6 Seven standard curves show the assay is reproducible within the validated range of 0.31–10.00 µg/mL (bracketed by dotted lines). | ||
| Sample (µg/mL) | Statistics | n | Mean | Stdev | %CV | %RE |
|---|---|---|---|---|---|---|
| 0.3 | Intra-assay (within-run) (Pooled): | 3.0 | 0.28 | 0.02 | 6.41 | −7.04 |
| Inter-assay (between-run) (ANOVA): | 18.0 | 0.28 | 0.06 | 18.70 | −7.04 | |
| 1 | Intra-assay (within-run) (Pooled): | 3.0 | 0.95 | 0.01 | 1.17 | −5.46 |
| Inter-assay (between-run) (ANOVA): | 18.0 | 0.95 | 0.14 | 14.25 | −5.46 | |
| 4 | Intra-assay (within-run) (Pooled): | 3.0 | 3.81 | 0.12 | 2.91 | −4.65 |
| Inter-assay (between-run) (ANOVA): | 18.0 | 3.81 | 0.37 | 9.27 | −4.65 | |
| 8 | Intra-assay (within-run) (Pooled): | 3.0 | 7.87 | 0.24 | 3.02 | −1.67 |
| Inter-assay (between-run) (ANOVA): | 18.0 | 7.87 | 0.43 | 5.42 | −1.67 | |
| 10 | Intra-assay (within-run) (Pooled): | 3.0 | 11.23 | 0.49 | 4.90 | 12.33 |
| Inter-assay (between-run) (ANOVA): | 18.0 | 11.23 | 1.00 | 10.02 | 12.33 |
Cetuximab (Erbitux®) was also stable in the primary stock solution (formulation buffer) stored at ambient temperature (20–25 °C) for approximately six hours (the relative % difference between the stored and freshly thawed solutions was −0.5%) and in the working stock (200 µg/mL in PBS + 1% BSA) stored at ambient temperature (20–25 °C) for approximately six hours. The % difference in the responses of the two solutions was 8.4%
Discussion
An assay developed by Millipore BioPharma Services has been shown to be valid for measuring Cetuximab in human serum samples. The testing methodology demonstrates acceptable specificity for Cetuximab (Erbitux®). The assay exhibited adequate accuracy and precision within a range of 0.30 to 10.00 µg/mL and dilution linearity up to 400 µg/mL. The anticipated Cetuximab concentration in the clinical trail is 300 µg/mL which is within the validated dilutional linearity range.14 The matrix used for the assay did not interfere with measurement of the analyte and stability of the analyte in the matrix was demonstrated through five freeze/thaw cycles and when incubated at temperatures commonly achieved during assay performance. Stability of the primary stock and working stock was also established.References
- T. Kawamoto, J. D. Sato, A. Le, J. Polikoff, G. H. Sato and J. Mendelsohn, Growth stimulation of A431 cells by EGF: identification of high affinity receptors for epidermal growth factor by an anti-receptor monoclonal antibody, Proc. Natl. Acad. Sci. U. S. A., 1983, 80, 1337–41 CAS.
- J. D. Sato, T. Kawamoto, A. D. Le, J. Mendelsohn, J. Polikoff and G. H. Sato, Biological effect in vitro of monoclonal antibodies to human EGF receptors, Mol. Biol. Med.1, 1983, 511–29 Search PubMed.
- G. N. Gill, T. Kawamoto, C. Cochet and et al., Monoclonal anti-epidermal growth factor receptor antibodies which are inhibitors of epidermal growth factor binding and antagonists of epidermal growth factor-stimulated tyrosine protein kinase activity, J. Biol. Chem., 1984, 259, 7755–60 CAS.
- Y. Humblet, Cetuximab: an IgG1 monoclonal antibody for the treatment of epidermal growth factor receptor-expressing tumors, Expert Opin. Pharmacother., 2004, 5, 1621–33 Search PubMed.
- N. I. Goldstein and M. Prewett, Biological efficacy of a chimeric antibody to the epidermal growth factor receptor in a human tumor xenograft model, Clin. Cancer Res., 1995, 1, 1311–8 CAS.
- R. S. Herbst and D. M. Shin, Monoclonal antibodies to target epidermal growth factor receptor-positive tumors: a new paradigm for cancer therapy, Cancer, 2002, 94, 1593–611 CrossRef CAS.
- Z. Fan, Y. Lu, X. Wu and J. Mendelsohn, Antibody-induced epidermal growth factor dimerization mediates inhibition of autocrine proliferation of A431 squamous carcinoma cells, J. Biol. Chem., 1994, 269, 27595–602 CAS.
- M. Naramura, S. D. Gillies, J. Mendelsohn, R. A. Reisfeld and B. M. Mueller, Therapeutic potential of chimeric and murine anti-(epidermal growth factor receptor) antibodies in a metastasis model for human melanoma, Cancer Immunol. Immunother., 1993, 37, 343–9 CrossRef CAS.
- G. Carpenter and S. Cohen, Epidermal growth factor, J. Biol. Chem., 1990, 265, 7709–12 CAS.
- F. X. Real, W. J. Rettig, P. G. Chesa, M. R. Melamed, L. J. Old and J. Mendelsohn, Expression of epidermal growth factor receptor in human cultured cells and tissues: relationship to cell lineage and stage of differentiation, Cancer Res., 1986, 46, 4726–31 CAS.
- J. Baselga, New technologies in epidermal growth factor receptor targeted cancer therapy, Signal, 2000, 1, 12–21 Search PubMed.
- A. Wells, The epidermal growth factor receptor (EGFR)-a new target in cancer therapy, Signal, 2000, 1, 4–11 Search PubMed.
- D. Salomon, R. Brandt, F. Ciardiello and N. Normanno, Epidermal growth factor related peptides and their receptors in human malignancies, Crit. Rev. Oncol. Hematol., 1995, 19, 183–232 CrossRef CAS.
- G. Masi, A. Falcone, A. di Paolo, G. Allegrini, R. Danesi, C. Barbara, S. Cupini and M. Del Tacca, A phase I and pharmacokinetic study of Irinotecan given as a 7-day continuous infusion in metastatic colorectal cancer patients pretreted with 5-fluorouracil or raltitrexed, Clin. Cancer Res., 2004, 10, 1657–1663 CrossRef CAS.
| This journal is © The Royal Society of Chemistry 2009 |