Formation of double helical and filamentous structures in models of physical and chemical gels
Martin
Kröger
*a,
Orit
Peleg
b,
Yi
Ding
c and
Yitzhak
Rabin
d
aPolymer Physics, ETH Zürich, Department of Materials, Wolfgang-Pauli-Str. 10, CH-8093 Zürich, Switzerland. E-mail: mk@mat.ethz.ch
bDepartment of Physics, Bar-Ilan University, Ramat-Gan 52900, Israel
cPolymer Physics and Polymer Chemistry, ETH Zürich, Department of Materials, Wolfgang-Pauli-Str. 10, CH-8093 Zürich, Switzerland
dDepartment of Physics, Nano-materials Research Center, Institute of Nanotechnology and Advanced Materials, Bar-Ilan University, Ramat-Gan 52900, Israel
First published on 28th September 2007
Abstract
This Highlight discusses two recent models, one that captures physical network formation starting from the molecular architecture of its constituents and another that contains the basic features of phase separation in cross-linked polymer gels: A) the Janus chain (multibead bead-spring type) model exhibiting semiflexibility and induced curvature and B) a stretched elastic network of Lennard-Jones particles. The length scales and related structures predicted by the two generic models are different. Model B, a generic soft solid model, exhibits hysteresis and the formation of filamentous structures in two dimensions. The Janus chain model A is able to describe the process of the formation of double helical superstructures, will be operated in three dimensions, and its internal parameters are directly deduced from atomistic simulation. Both models rely on classical ingredients which have been separately studied extensively: i) the Lennard-Jones particle system, ii) the elastic solid, and iii) the FENE-B model for semiflexible, finitely extendable nonlinear elastic (FENE) polymer chains. While model A combines i) and iii), model B combines i) and ii). This aspect of technical simplicity, however, is contrasted by the rich phenomenology observed for these models. The Janus model even resolves structure formation on the molecular scale. Intriguingly, the coarse dynamical models capture a wide range of superstructures known for polymeric networks and therefore clearly serve to understand their underlying physical mechanisms.
 Martin Kröger | Martin Kröger studied mathematics and physics (1985–1991), and received a PhD in Theoretical Physics (1994) from the Technical University of Berlin (TUB). He was senior scientist at TUB (1995–2003) and ETH Zurich (1997–2005), and invited professor at the Universities of Metz (1995) and Strasbourg (1996). He has been editor of Applied Rheology since 1998. He has performed post-docs at Hebrew University, Jerusalem (1997), and the Kavli Institute for Theoretical Physics, UCSB (2002). Venia Legendi/habilitation Theoretical Physics, TUB (2001) and Department of Materials, ETH Zurich (2005). He is currently Professor for Computational Polymer Physics at the ETH Zurich (since 2006). His research focuses on coarse-grained models for complex liquids, stochastic differential equations, computational physics, applied mathematics, and statistical physics of anisotropic fluids. |
 Orit Peleg | Orit Peleg is a student of Computational Physics Science (BSc, since 2003) and Physics Science (M.Sc, since 2006) at Bar-Ilan University, Israel. She has worked at the air-force central computers unit, Israel (2001–2003). She has taught numerical analysis (2006) and computational physics (2007) at the Bar-Ilan University. Her research interests are in the field of soft condensed matter physics focusing on phase separation in polymer gels. |
1. Introduction
Gelation is the conversion of a liquid to a disordered solid by formation of a network of physical or chemical bonds. The different sources of junctions which can lead to networks and hence gels, and their interrelation has been widely discussed and reviewed in e.g.Ref. 1–5. In soft matter there are gels everywhere: from polymers to colloids, from surfactants to biomolecules, from mixtures to polyelectrolytes.6–10 This Highlight focuses on gels where the disperse polymeric phase is connected through adhesive contact, and phase-connected bicontinuous gels. Associative polymers form reversible networks and gels.3,11 The understanding of different mechanisms governing the dynamics of associative polymers has been significantly advanced.9,11–13 Supramolecular structures formed by the self-assembly of functional molecular building blocks are a promising class of materials for future technologies. Useful for their fabrication had been hydrogen bonding, which provides both high selectivity and directionality, and enables, in particular, the creation of supramolecular twin chains.14 Unidirectional design of binding sites has been used to also prevent uncontrolled multidirectional association or gelation.15–17 Reversible networks were formed from monomers with a few binding sites. The thermal and environmental control over lifetime and bond strength makes many properties, such as viscosity, chain length, and composition, tunable in a way not accessible to traditional polymers. Hence, polymer networks with thermodynamically controlled architectures can be formed, for use in, for example, coatings and hot melts, where a reversible, strongly temperature-dependent rheology is highly advantageous. Charged dendronized polymers (DPs) are among the candidates to facilitate the manufacturing of networks with tunable mechanical characteristics.18–24 Their constituents, dendrimers, are synthetic polymers with a highly branched architecture and nearly perfect molecular structure. They are identical, monodisperse macromolecules that expose many terminal groups at their globular periphery. Dendrimers have been used as light- and energy-harvesting materials, for drug delivery, as catalysts, and in optoelectronic applications. Yet they have not been widely introduced commercially. This situation is about to change, with several dendrimers now entering the market.25 As specialty polymers, dendrimers can be prepared with the precision of small organic molecules, yet they behave like macromolecules. Fig. 1 and 2 show typical examples of physical gels, taken from literature, which occur as a result of intermolecular association—the type to be highlighted in this article.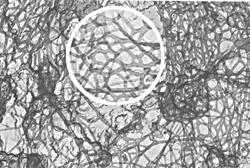 | ||
| Fig. 1 Physical gel. Cytoplasmic filamentous network in cultured ovarian granulosa cells. Reprinted with permission from Ref. 72. | ||
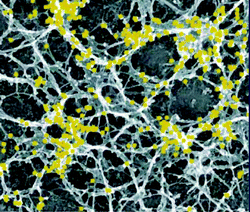 | ||
| Fig. 2 Physical gel. Electron micrograph of unroofed cells, immunogold labeled. The picture shows an overview of actin organization at the bottom surface of a cell. Reprinted with permission from Ref. 73. | ||
Model A, and the underlying bottom-up multiscale approach for DPs exhibiting double-helical network superstructures had been established recently by two of us (DY, MK et al., Ref. 26). From the atomistically detailed model geometrical parameters such as lateral size, flexibility and “surface” charge coverage, and their dependence on molecular weight and number of generations had been quantified. The simulations render the DP a sectorial amphiphile. Based on the phenomenology18,26 of the atomistic model for this class of polymers we introduced the “Janus chain” (JC) model, which adds a vectorial degree of freedom (Janus vector)—related to the sectorial amphiphilicity—to each segment of the linear backbone of a (classical) uncharged, semiflexible, multibead chain representation of a polymer. The JC features induced polymeric curvature and ultimately triggers complexation. JC parameters related to the topology and chemical details are obtained from the atomistic level. Available experimental observations including the formation of superstructures and double-helical conformations are well reproduced by the JC model, which is efficiently solved via Brownian dynamics simulation, and can be seen as a member of a universality class which is one (two) levels above the magnetic (semiflexible) chain model. It therefore offers the modeling not only of dendronized polymers, but also of structures belonging to the same class—exhibiting spontaneous or induced curvature—such as single stranded DNA, actin filaments, and assemblies of twisted beta-sheet peptide ribbons.27,28
Model B, first introduced by three of us (OP, MK, YR, Ref. 29), shows that the appearance of mesoscopic structures is a quite general feature of phase separation in a connected network. The model allows to obtain some insight about their properties and the mechanism of their formation. As discussed in the original paper,29 phase transitions in polymer networks (gels) involve two coupled yet distinct processes: volume transition and phase separation.30 During a volume transition the gel undergoes a uniform change of volume by expelling some of the solvent contained within it.31–35 Since this process takes place by (slow) cooperative diffusion, it is well-separated in time from the fast local reorganization of the gel which leads to its separation into domains of high and low polymer concentration (at constant total volume of the gel). While the volume transition is well understood, most of the work on phase separation in polymer gels focused on surface instabilities36 and the question of what happens in the bulk of the gel remained largely unresolved. This question is of considerable interest from the fundamental perspective because, unlike binary liquids in which two macroscopic phases are formed in the process of phase separation, a gel is a connected network that cannot undergo phase separation on macroscopic scales. While it is obvious that only local reorganization of the polymer concentration profile can take place in such a system, little was known about the details of this process. In particular, it was not clear whether the characteristic length scale of microphase separation is of the order of the mesh size or whether cooperative behavior that results from long range elastic interactions can lead to the formation of much larger domains. The former scenario according to which the wavelength of microphase separation is determined by molecular length scales, takes place in diblock copolymer mesophases. However, previous theoretical37 and experimental38 investigations of phase separation in gels suggest the presence of much larger structures (like the ones resulting from the JC model, spongelike domains in Ref. 37, filamentous honeycomb-shaped networks in Ref. 38).
The two models will be reviewed in this manuscript, details can be found in the original papers.26,29 Section 2 motivates and defines the JC model (A) and discusses its range of applicability. Section 3 focuses on the properties of presumably the simplest possible soft-solid model (B) which—accordingly—neglects internal molecular structure. We will offer evidence that the observed mesoscopic patterns are a quite general feature of phase separation in a connected network and will obtain some insight about their properties and the mechanism of their formation.
Before we start, a brief comment on reduced units is in order, since such units are usually avoided in Soft Matter contributions. Simulations using (dimensionless) numbers provide results which are valid for a class of materials; material-dependent dimensional results are easily obtained in a post-processing step, without the need for a new simulation. That is why we prefer using Lennard-Jones (LJu) and Janus chain (JCu) reduced units. Dealing with them is straightforward, allows prediction of the order of magnitude of results by dimensional arguments, often improves numerical precision, and works as follows. For a given material, dimensional reference values for three independent quantities q1,2,3 like mass (SI unit kg), length (m), and time (s) have to be specified by comparing model predictions with measurements for the real substance. Any number Asim for a physical quantity—like energy or viscosity—calculated in a simulation receives its dimensional value A expressed in SI units (to be compared with dimensional experimental data) by multiplying Asim with a reference unit Aref (either LJu orJCu for this manuscript). This reference unit is uniquely defined by a multiple product of the q's in such a way that the SI dimension of Aref equals the SI dimension of A. For example, a single energy LJu corresponds to q1q22q−23 in the above example, and a viscosity LJu corresponds to q1/(q2q3). Values for q1,2,3 for both LJu and JCu are material dependent, sample values are given in this manuscript and elsewhere.39–42 The model potentials used in the following will be very simple and contain the essential physics, i.e., attractive and repulsive interactions, and topological constraints. In view of slow dynamics occurring in gels,43–47 rather than introducing atomistically detailed expressions and performing time-consuming computations we recommend elaborating the values for reference quantities for any given particular material, along the lines presented in Section 2. For the readers’ convenience, an interactive tool converting between reduced units and dimensional experimental data belongs to the add-on material for this manuscript, cf. Ref. 48.
2. Janus chain model
The JC model is a coarse-grained representation of a linear polymer which exhibits internal structure, and where the internal structure is essential to understand intermolecular interactions. The JC model was developed by investigating dendronized polymers (DP) via atomistic simulation,26cf.Fig. 3, whose amount of internal structure can be chemically adjusted by synthesizing DPs at a given number of generations and for varying number of repeat units (molecular weight). By constructing and applying measures characterizing the shape and charge distribution of the atomistic chains (single and interacting chains), the few parameters of the JC model have been determined for the vinyl-type DP (Fig. 2 of Ref. 49). These parameters will be collected in Table 1.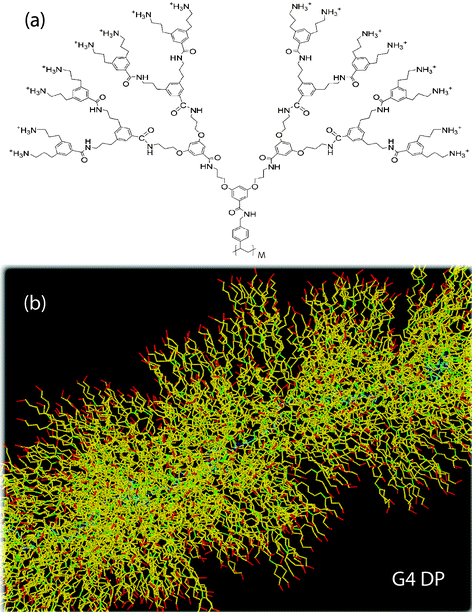 | ||
| Fig. 3 (a) Topology of a G4 vinyl-type DP. Explicitly shown is a single repeat unit (dendron) which is attached to the polymeric backbone of the DP (with M repeat units). (b) Sample snapshot of a stretched part of a G4 DP during atomistic simulation. Color coding: backbone (blue), segments attached to branching points (green), attached to atoms carrying charges (red), otherwise (yellow). Upper image reprinted with permission from Ref. 49. | ||
| M 0/M | 〈R2ee〉/M | L/M | d rep | l p | l p/drep | d eff M/L | d eff M 0/L | S ± | S o | ϕ 0 | |
|---|---|---|---|---|---|---|---|---|---|---|---|
| G3 | 81 | 518 Å2 | 1.22 Å | 3.4 nm | 51 nm | 15.3 | 31.0 | 2510 | 46% | 7% | 66% |
| G4 | 169 | 356 Å2 | 0.90 Å | 4.7 nm | 119 nm | 25.5 | 58.4 | 9870 | 60% | 18% | 31% |
| JCu | 1 | κ/kBT | M/N | M 0/N | ϕ 0 |
The JC model (A) neglects chemical details of the DP but captures its physical properties: contact induced phase separation and interplay between phase separation and bending. Correspondingly, the contact induced phase separation generates a neutral surface in the (inner side of the) region of close contact, leading to an effective hydrophobic (attractive) force between contacting DPs (includes backfolding). Such a process gives rise to a self-stimulating, self-amplifying mechanism for the formation of helically inter-winded DP super-structures (thus rendering them as active systems), provided the system parameters exceed certain thresholds to be discussed below. The JC model for self-assembling DPs is based on the classical dynamical multi-bead FENE chain model17,42,50 supplemented with LJ interactions, bending interactions, and an attractive part of the LJ potential which is parameterized by an effective solvent quality. It reduces to several known models for particular choices of its parameters.
2.1. Classical ingredients
A main ingredient of the JC model is the classical FENE (+LJ) model which consists of a multiple disconnected off-lattice path (N nodes for each of the Np subpaths) of LJ particles (“beads”) at each node interacting viaULJ(r;χ) = ULJ(r) for r < rWCA and ULJ(r;χ) = χULJ(r) for rWCA < r < rJC, respectively, where rWCA = 21/6 denotes the minimum of the LJ potential, which, if truncated at rWCA, is known as WCA potential,51,52 and rJC denotes a cut-off distance beyond which the (suitably shifted) LJ potential is identical to zero. The parameter χ is known to model the effect of solvent quality.53 Adjacent beads along the subpaths (polymer contours) are connected chain-like through anharmonic springs with a FENE force law FFENE(s) = −H(s)s, s = |s|, for all the (N− 1)Np connectors sαi≡rαi+1−rαi. The non-Hookean spring coefficient H(s) is chosen strong enough to ensure uncrossability as H(s) = kH[1 − (s/smax)2]−1, with kH = 30 and smax = 1.5 as in Refs. 50,54, such that the preferred bond length 〈s〉 of the FENE + LJ chain is very close to unity. Semiflexibility of chains without spontaneous curvature is usually introduced (FENE-B model) by adding bending forces which derive from a bending potential Vbend = −κΣαΣiŝαi·ŝαi+1 where the hat denotes, throughout this manuscript, a unit vector, ŝ≡s/|s| = s/s for any s, and κ denotes the bending coefficient.2.2. Induced curvature
The JC model extends the FENE-B model to a bending potential with induced curvature, where so called Janus vectors Jα=1,..,Npi=2,..,N−1 (see Fig. 4d), assigned to each interior bead i in chain α—themselves instantaneously determined from a configuration—trigger curvature, twist rigidity, and have an effect on both bonded and nonbonded interactions. Unit Janus vectors Ĵαi for each interior bead represent the local orientation of the uncharged (hydrophobic) material and are calculated, for each bead i on chain α, from the coordinate of its spatially nearest nonbonded bead (denoted as bead i′ on chain α′, nonbonded beads either have α′≠α or rααii′ > rJC), i.e., Ĵαi =![[r with combining circumflex]](https://www.rsc.org/images/entities/b_char_0072_0302.gif) αα′ii′ where rαβij≡rβj−rαi denotes the vector pointing from bead i in chain α to bead j in chain β. The Janus vectors are considered as fast, relaxed variables, whose dependence on coordinates is neglected when deriving forces from the JC potential. The JC potential, which adds to the LJ and FENE potentials, ULJ+FENE = Σi,α[UFENE(sαi) + Σj,βULJ(rαβij;χαβij)], reads
αα′ii′ where rαβij≡rβj−rαi denotes the vector pointing from bead i in chain α to bead j in chain β. The Janus vectors are considered as fast, relaxed variables, whose dependence on coordinates is neglected when deriving forces from the JC potential. The JC potential, which adds to the LJ and FENE potentials, ULJ+FENE = Σi,α[UFENE(sαi) + Σj,βULJ(rαβij;χαβij)], reads  | (1) |
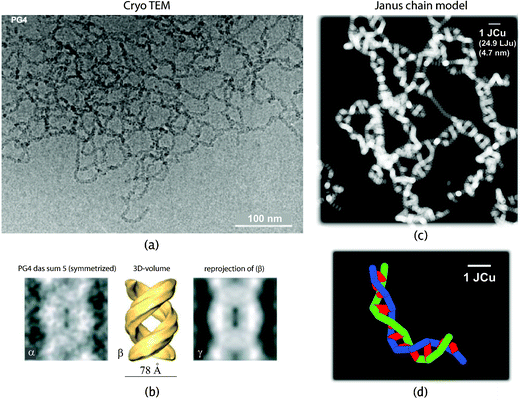 | ||
| Fig. 4 (a) Experimental cryo TEM image and (c) simulated counterpart of a JC system corresponding to the G4 vinyl-type DP of Fig. 3a. The simulated JC network has volume fraction ϕ≈ 2.5%, χ0 = −2 (good solvent), Δχ = 8. The mesh size, approximately 30 nm, well coincides with the experimental value. The same holds for the pitch height, measured from the zoomed experimental images given in (b). Notice the scale-bar in (c) and the amount of coarse graining compared with the underlying atomistic model. (d) Two interwound Janus chains (blue and green, respectively). The conformation dependent Janus vectors are shown in red (a + b reprinted from Ref. 49, c + d reprinted from our Ref. 26). | ||
2.3. Effective solvent quality
The JC model has a second integral part, a configuration dependent (and Janus vector induced) expression for the effective solvent quality, i.e., for the strength of attractive/repulsive interaction beyond distances r≥rWCA. It reads| χαβij = χ0±ϕ0(1 −ϕ0)|gαβijgβαji|Δχ, | (2) |
 characterizing the orientational part, which vanishes for neutral and fully charged DPs. The plus sign in eqn (2) applies when gαβij and gβαji are both positive, otherwise the minus sign applies; χ0 characterizes the solvent quality of the (dendronized) polymer at infinite dilution,53 and the solvent quality parameter varies in the range χαβij∈ [χ0−Δχ, χ0 + Δχ] by construction, where Δχ≥ 0 parameterizes the maximum effective departure from χ0 due to internal charge redistribution. Notice, that gαβij = 1 for β = α′ and j = i′. We see, that for the case of both neutral or fully charged chains, the JC model reduces to the classical FENE-B model (with solvent quality χ0, choose χ0 = 1 for the original FENE-B model), where Janus interactions are absent. For the case of hydrophilic chains, ϕ0≈ 1, χ0 > 0, the plus sign in eqn (2) applies; beads tend to attract each other since χαβij > 0, while the strength of attraction depends on the relative orientation of chains and Janus vectors. For the case of hydrophobic chains, ϕ0≈ 0, χ0 < 0, the minus sign applies. For a chain for which each bead carries a Janus vector, the bending angle is close to π/3 everywhere along the chain, and the dimensionless persistence length (for the JC model, bond length 〈s〉≈ 1 LJu) can therefore be approximated by the analytic expression lp = −1/log(1/2) ≈ 1.4427 or, alternatively,1〈R2ee〉 = 3(N− 1) − 4(1 − 21−N). The JC model features many-body interactions. Microscopic origins for eqn (1) and (2) are the internal degrees of freedom of the atomistic chain, in particular, the distribution of its hydrophilic sites. As we have seen in Ref. 26 from the experiments with U-shaped DPs, the charge distribution becomes asymmetric, charges tend to populate the “outer” surface, and cause a repulsion between a pair of two interwound, agglomerated chains and a third chain, which can approach and break this pair only by surmounting an energy barrier, captured by eqn (2).
2.4. Results for the JC model
The Langevin equation of motion for a JC system has been solved via conventional Brownian dynamics, implementation details can be found in Ref. 17,24,26. The FENE potential can also be replaced by constraints for bond lengths, which lead to constraint and metric forces as described in Ref. 55,56. Connectivity and topology, rather than chemical details allow to capture the “universal” physical properties of polymers using these models.1,57,58 Because of the short-ranged nature of forces in the JC model, the equations of motions can be integrated with computational effort which is linear in the total number (NpN) of particles. With increasing concentration intermolecular interactions become more relevant, induce curvature, and essentially affect the flexibility of chains confined in a network or in mutual contact.In order to explore the corresponding phase diagram we systematically varied the JC parameters χ0 and Δχ in Ref. 26. We observe that the tendency of forming globular aggregates is increased by strengthening the inter-chain affinity which is achieved by decreasing the coverage ϕ0 of the charged surface of the JC, and also by lowering the quality of the solvent, i.e., by increasing χ0. Fig. 4c is a simulated cryo TEM image of a double helical network JC system, which exhibits many similarities with the images taken from the real system, which we show for comparison in Fig. 4a and b. For the average pitch of helices we obtain approximately 2 JCu (9.4 nm), to be compared with 9.1 nm reported from experiments,49cf.Fig. 4b. The presentation of a large amount of more quantitative results for the simple JC model must stay outside the scope of this review.
3. Filamentous network model
Since microphase separation in gels arises as the result of interplay between attractive forces which promote the appearance of a polymer-rich phase and elastic network forces that oppose phase separation, we recently introduced29 a “minimal” two-dimensional model (above model B) in which these two (and only these two) aspects of real gels are represented, albeit in an idealized fashion. This model is quite general in the sense that interactions between its constituents (point particles representing atoms, molecules or molecular aggregates) are initialized by the node positions of a given, simple lattice such as a square or hexagonal grid (supplemented with periodic boundary conditions). In Ref. 29 the qualitative results were shown to be insensitive to the particular underlying lattice and here we assume a hexagonal grid, cf. inset to Fig. 5. Each of the particles initially located at a grid node is connected through identical stretched harmonic springs of zero equilibrium length and of spring constant k, to its six nearest neighbors. These springs are permanent and thus the topology of the network remains fixed throughout the simulation. Without adding further interactions, this network behaves as an elastic solid. In Ref. 29 we added attractive interactions by having all the particles interact via the Lennard-Jones (LJ) potential. The system has been studied by molecular dynamics simulations in the (N,V,T) ensemble (N is the total number of particles, V the total area and T the temperature). The choice of the LJ potential is dictated by convenience: it is the simplest model potential that combines both attraction and excluded volume effects. All quantities (length, times, energies etc.) are conventionally made dimensionless by expressing them in LJ units.17 We truncated the LJ potential at an interparticle distance of rcut = 3 × 21/6. Quantitative results presented here are usually for a 100 × 100 (N = 104) hexagonal grid with k = 1/15, grid spacing l0 = 3.5, cooled down to the prescribed temperature, if not explicitly stated differently. Several snapshots will be shown for a larger 500 × 500 grid (N = 250![[thin space (1/6-em)]](https://www.rsc.org/images/entities/char_2009.gif) 000). The above choice of the value of the spring constant is quite arbitrary—generic behavior occurs for a wide range of spring constant values.29
000). The above choice of the value of the spring constant is quite arbitrary—generic behavior occurs for a wide range of spring constant values.29
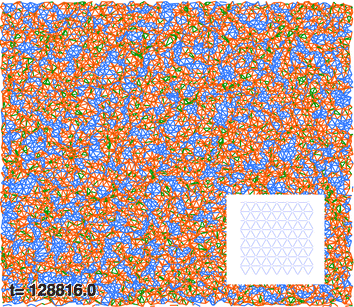 | ||
| Fig. 5 Particles and connecting linear springs for a 100 × 100 (periodic) network at T = 0.48. The initial ‘high temperature’ hexagonal grid topology is (schematically) depicted in the inset. Springs connecting isolated particles are shown in blue; those connecting clusters to particles and to other clusters are orange; and those (the reader is encouraged to zoom in) connecting particles in the same clusters are green. | ||
3.1. Percolating high density clusters
When the elastic LJ system is brought to a temperature higher than T* ≈ 0.435 (to be characterized further in Section 3.3 below), only isolated particles and small clusters (dense aggregates of particles with nearest neighbors separated by distance ≤1.5) of size that break up and reform, are observed. A typical snapshot at T = 0.48 is shown in Fig. 5. The probability that a particle belongs to a (small) cluster is slightly above the value obtained for an ideal gas of non-interacting particles at the same concentration.29
In order to study the effect of temperature and initial state on phase separation we started from the hexagonal configuration and performed temperature quenches in the range T > 0.3 (for the study of hysteric effects to be discussed in Section 3.3, we also started from the final, low-temperature configurations, and raised temperature). We observe the nucleation of high density filaments that elongate by absorbing small clusters at their ends. Sample snapshots of a transient configuration at T = 0.41 in a large system (for N = 250![[thin space (1/6-em)]](https://www.rsc.org/images/entities/char_2009.gif) 000 this value is slightly below the transition temperature) are given in Fig. 6 and 7. At this temperature the time to form a large filament is of the order of 104 LJu (a value to be compared with experimental values to fix the LJu for time for a particular gel). We observe sequences of events where linear filaments are first formed and, later on, new linear clusters nucleate and grow until ends collide with an existing linear filament, giving rise to double vertex structures. The total energy of the system, as well as its kinetic and potential (elastic and LJ) contributions are resolved in Fig. 8, for the case where the system (N = 104) was cooled starting from the homogeneous “phase”. The formation of PHDC (percolating high density cluster) is clearly reflected by a strong decrease of the LJ energy, partly compensated by an increase of the spring energy. The specific heat (see inset) has a pronounced peak at the transition temperature, a characteristic signature of a first order transition in a finite system.
000 this value is slightly below the transition temperature) are given in Fig. 6 and 7. At this temperature the time to form a large filament is of the order of 104 LJu (a value to be compared with experimental values to fix the LJu for time for a particular gel). We observe sequences of events where linear filaments are first formed and, later on, new linear clusters nucleate and grow until ends collide with an existing linear filament, giving rise to double vertex structures. The total energy of the system, as well as its kinetic and potential (elastic and LJ) contributions are resolved in Fig. 8, for the case where the system (N = 104) was cooled starting from the homogeneous “phase”. The formation of PHDC (percolating high density cluster) is clearly reflected by a strong decrease of the LJ energy, partly compensated by an increase of the spring energy. The specific heat (see inset) has a pronounced peak at the transition temperature, a characteristic signature of a first order transition in a finite system.
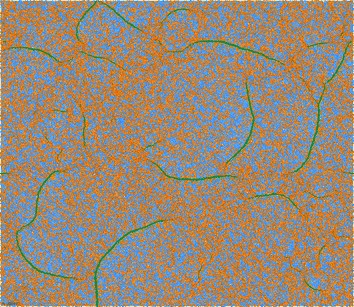 | ||
| Fig. 6 Initial stage of a forming filamentous network at T = 0.41 (500 × 500 hexagonal grid, grid spacing l0 = 3.5, spring coefficient k = 1/15, started from the homogeneous phase). Snapshot taken at time t = 5024 LJu. | ||
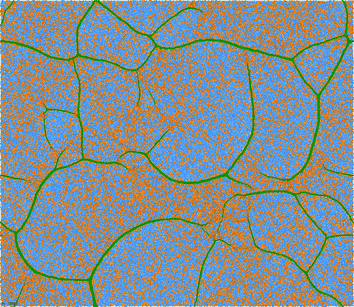 | ||
| Fig. 7 Further developed filamentous network at t = 7656 LJu slightly below the transition temperature (T = 0.41 < T*). Model parameters as for Fig. 6. Finite size effects are negligible. | ||
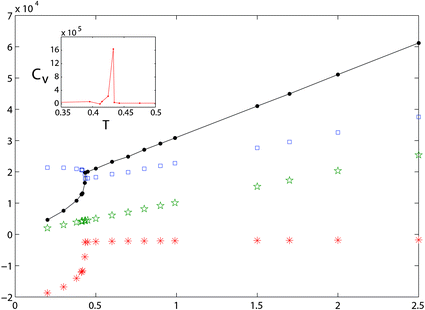 | ||
| Fig. 8 Plots of the total energy of the system E (full line), energy stored in the harmonic springs Esp (□), kinetic energy Ekin (☆), LJ interaction energy ELJ (*), vs. temperature. The specific heat as a function of temperature is shown in the inset. | ||
The lower the temperature, the larger the amount of multiple nucleation events that take place in the simulation box, that are followed by growth of linear filaments, and that are terminated by collisions. Such processes lead to the formation of the “super network” of dense filaments connected by 3-fold vertices, embedded in a dilute phase of isolated particles connected by strongly stretched springs, such as the ones shown for a temperatures below T* in Fig. 9 and 10. Interestingly, the shapes resemble not only those of physical gels (Fig. 1, 2) but also those of two-dimensional foams,59 even though the physics is very different—interplay of elasticity and attractions in our case, vs. interplay of surface tension and gas pressure in foams.
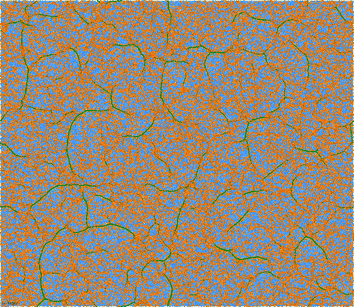 | ||
| Fig. 9 Same as Fig. 6 at T = 0.35 (at t = 1128 LJu), well below the transition temperature. | ||
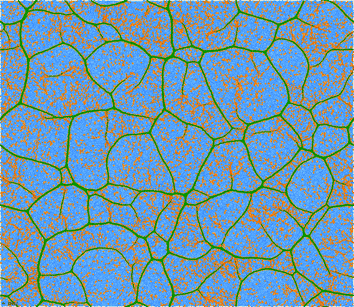 | ||
| Fig. 10 Further developed filamentous network (t = 2328 LJu) well below the transition temperature (T = 0.35). Remaining model parameters as for Fig. 9. | ||
3.2. Nucleation and growth
In order to examine the sequence of events that precedes the birth of a filament, we decreased the temperature to T = 0.2 and followed the dynamics of the system in time (see accompanying movie B at Ref. 48). Following the quench, numerous compact clusters of up to about n = 10 particles appear in the simulation box. Each of the particles in such a cluster is typically connected by several springs to the ‘outside’ and therefore there are about n = 10 springs that connect neighboring clusters (see Fig. 3a,b of Ref. 29). Since the pulling force on a cluster due to n parallel springs is n times larger than the force exerted by a similarly stretched single spring (between the cluster and an isolated neighboring particle), in mechanical equilibrium this force has to be balanced by a force equal in magnitude and acting along the opposite direction. The same argument can be applied to the neighboring cluster as well, and clusters arrange themselves along lines of high stress. This breaks radial symmetry and the resulting critical nucleus has the shape of a linear filament,29 reminiscent of the string-like arrangement of magnetic or electric dipoles. The electric/magnetic analogy is not accidental since such a cluster can be described as a force dipole.60 In Fig. 11 we plot the probability that a particle belongs i) to the PHDC, ii) to a ‘small’ cluster, or that it is iii) an isolated particle, as a function of temperature. As T decreases, the probability for a particle to belong to a small cluster drops sharply from a value exceeding 0.5 to less than 0.1 at T* and approaches zero at lower T. A much smaller drop at T* is observed for the probability to observe an isolated particle. The formation of large clusters therefore occurs mainly at the expense of small clusters that are absorbed by them, reminiscent of late stage growth of droplets in a phase separating binary liquid (in the metastable region of its phase diagram). Selected distributions of cluster sizes are shown in Fig. 12. The distribution ps of cluster sizes s can be fitted by a single exponential above T*, ps∝ e−ms. Below the transition, for T < T*, it becomes peaked at the percolating cluster size, while the distribution of the remaining small clusters stays monoexponential, with a larger coefficient m (which depends on T) since the total number of particles is constant. The sizes p* of the percolated clusters, existing for the two temperatures with T < T* = 0.425, can be calculated from Fig. 12 with the help of the total number of particles, which is N = 104. To be specific, p* = N−p1em(1 − e−m[1+m−1lnp1])/(em− 1) ≈N−p1em/(em− 1), where p1 is the number of individual particles, m > 0 the slope of the exponential, and [x] denotes the integer part of x.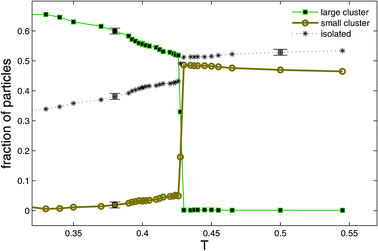 | ||
| Fig. 11 Plots of probability that a particle belongs to a large cluster (■), a small cluster (○), or that it is an isolated particle (*). Data for both hexagonal (shown) and square grids with N = 104 particles fall onto the same curves within statistical certainty and with the exception, that the high T values for the number of small clusters slightly differ as expected from the corresponding ideal gas values. Reprinted from Ref. 29. | ||
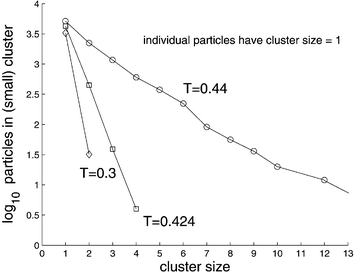 | ||
| Fig. 12 Number of particles ps in clusters of given size s (including individual particles, s = 1). The distribution is monoexponential in the shown regime of small cluster sizes. The sizes p* of the percolated clusters, existing for the two temperatures with T < T* = 0.425, are not shown but can be calculated from this plot, because it contains the two parameters (for each temperature) of the cluster size distribution, cf. Section 3.2. | ||
3.3. Melting and hysteresis
In order to study the melting transition we started from an equilibrated low temperature (T < T*) configuration which contains a PHDC, increased T to some value larger than T*, and monitored the system during very long simulation runs.29 When T is increased to the range T* < T < T** (in which no filaments are observed under cooling from an initial high-temperature state, cf.Fig. 13), filaments tend to thin by progressive ‘melting’ at their surface and then break. The process continues until a single thin filament remains which appears to be stable during the longest simulations runs. Finally, at T** no filaments are observed. This behavior is summarized in Fig. 13 where the ratio of the number of particles in the PHDC to the total number of particles in clusters of all sizes, is monitored. Under cooling from the homogeneous state, the system follows the lower branch and jumps to the inhomogeneous filamentous state at T*; conversely, when the system is heated starting from the low-temperature inhomogeneous phase where PHDC are present, it follows the upper branch up to T** = 0.55 ± 0.02 and then undergoes a transition to the homogeneous phase. The hysteresis apparent from Fig. 13 is familiar from the study of first order phase transitions (see, e.g., the isotropic–nematic or isotropic–smectic transition in liquid crystals61,62). The interpretation (based on mean field considerations) is that two free energy minima corresponding to the two phases are present in the range T* < T < T**. Even though only the lowest minimum corresponds to the true equilibrium state, a system which was initially prepared in the other (metastable) state, will remain in it almost indefinitely if this local free energy minimum is deep enough (compared to thermal energy, T). We therefore interpret T* and T** as the stability limits of the homogeneous and the inhomogeneous phases, respectively. Notice that unlike the true thermodynamic transition temperature which lies somewhere between T* and T** and which is strictly defined only in the limit of an infinite system, the latter temperatures have no thermodynamic significance and depend on the size of the system.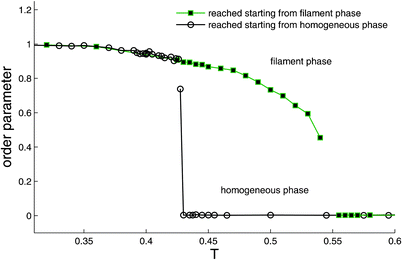 | ||
| Fig. 13 Order parameter 0 ≤S≤ 1 defined as S = L/C where L and C denote the number of particles in the largest cluster and in all clusters (isolated particles do not belong to any cluster), respectively. Data shown for both ‘cooling’ and ‘heating’ runs, results indistinguishable for both the hexagonal and square grids with N = 104 particles. States on both branches are reached from all states within their branch upon heating or cooling. Reprinted from Ref. 29. | ||
In order to test the effect of initial configuration on the final results, we deformed the initial grid, as shown in Fig. 14a, and observed the breakup of the compact large cluster and the formation of a filamentous network in Fig. 14b,c which is qualitatively similar to the ones discussed above, and not yet relaxed.
 | ||
| Fig. 14 Reverse simulation experiment (T = 0.30, 100 × 100 hexagonal grid). Initial configuration (a), snapshots at times t = 361 (b) and t = 1561 (c). White “spacings” arise, as for foregoing figures, because we do not plot springs which initially wrapped around the torus, in order to visualize the motion of two arbitrarily selected straight lines. | ||
4. Conclusions and outlook
This manuscript attempts to shed some light on two simple, very recently developed models for the study of the dynamics, structure and physical properties of double helical and filamentous networks. The ranges of applicability of the JC model and elastic network of LJ particles model are weak and strong physical gels with and without double helices (upon varying the strength of attraction, persistence length, charge parameters, solvent quality, concentration, temperature), and chemical gels (strength of attraction, network topology, temperature), respectively. While for the JC gel the disperse (DP) phase is connected through adhesive contact, the elastic network can be considered as a phase-connected bicontinuous gel. Both models are easy to implement, and have been motivated through combined atomistic simulation, experimental findings, and/or theoretical arguments, and are going to be studied further in order to resolve the full spectrum of phenomena they allow to capture and describe, and to elaborate their predictive qualitative and quantitative power in comparison with alternate models and empirical results, cf.Ref. 1,5,7–10,63. Core properties as well as main simulation details have been summarized in this manuscript.The Janus chain (JC) model (Section 2) allows for an efficient study of dynamical and structural properties of a given, atomistically detailed, polymeric structure (essentially ab initio). It resolves structures on huge length scales compared with the size of a single repeat unit (dendron), and down to a fraction of the typical pitch size of a helical network. Reconstruction methods may be applied to calculate, for example, structure factors from the conformation of the JC by making use of the atomistic model also introduced here. The JC network bears analogies to a randomly cross-linked gel,64 for which expressions for the static structure factor had been derived using replica field theory.65 We applied a mapping procedure26 which allows to calculate all parameters of the JC model related to the topology and chemical details of the molecules of interest. The JC model and underlying concepts, induced curvature and effective solvent quality, have been approved qualitatively by the fact that sectorial amphiphilicity occurs when atomistic DPs are in close contact. Under such conditions, the hydrophilic (terminal) and hydrophobic (internal) beads tend to segregate, and to exhibit a sectorial amphiphilical phase separation. Solvent quality and the corresponding strength of repulsive/attractive forces had been added on the level of the JC model, for which—without induced curvature—we profit from known results on related coarse-grained models.1,42,66 Due to its efficiency, the JC allows to study the formation of superstructures, helical chains for DPs. The JC model introduces a new class of models by adding a vectorial degree of freedom to each segment of a conventional coarse-grained model for polymers. This approach is certainly not restricted to the class of DPs. Established routes1,42,66–68 can now be followed to explore the correlation between architecture and static and time-dependent material properties of the JC model. Supramolecular, or molecular, gels have been made sensitive to external stimuli like light and chemical entities which makes them suitable for applications such as sensing and actuating. The diversity of gel structural architectures has allowed them to be utilized as templates to prepare novel inorganic superstructures for possible applications in catalysis and separation. Supramolecular gels can be important in controlled release applications, in oil recovery, for gelling cryogenic fuels etc. They can also serve as media for a range of applications, as summarized in Ref. 8,10.
The stretched elastic network of LJ particles, reviewed in Section 3, serves to visualize48 and investigate dynamics of gel formation, the origin of hysteretic effects, and cluster size distributions efficiently. Its phenomenological features are very robust: when temperature is lowered below some critical value T*, which is affected by the choice of lattice and spring coefficient, attraction between particles dominates over both thermal motion and elastic forces, and the network separates into dense domains of filaments connected by three-fold vertices, surrounded by low density domains in which the network is homogeneously stretched. The length of the filaments decreases and the number of domains increases with decreasing temperature, cf.Fig. 11. The system exhibits hysteresis characteristic of first order phase transitions, cf.Fig. 13: pre-formed filaments thin upon heating and eventually melt at a temperature T** (>T*). Although details may vary, the above general features are independent of network topology (square or hexagonal), system size, distribution of spring constants, and perturbations of initial conditions. The microphase separation patterns reported for the elastic LJ network bear strong resemblance to those seen in sections of elastin hydrogels observed by cryoscopic scanning electron microscopy: a network of 7 nm thick and several hundred nm long filaments, the latter made of spherical beads (see Fig. 3a and 3b in Ref. 38).
These findings provide support to our belief that, despite—and in addition to—their simplicity, the two models capture main physical ingredients responsible for phase separation in gels (with and without double helical assemblies). Work on the effect of temperature, molecular architecture, and solvent quality, on the mechanical properties and the phase diagrams of the networks, as well as on time scale separation issues and corresponding thermodynamic variables, is in progress.69,70
These supplementary works are motivated in part by the fact that mechanical and biomechanical properties of gels are increasingly receiving interest. For example, potential materials for artificial cartilage are required to be viscoelastic, strong, durable to repetitive stress, low in friction, resistant to wear, and resistant to biodegradation within the living body. In addition, not only the whole material itself but also wear particles from the material are needed to have affinity and non-toxicity for cells and tissues. It had been difficult to develop a gel material having only one of these excellent properties.71 It is known that the measurement of viscoelastic properties is a powerful tool in the study of thermoreversible gels. Although many conclusions may be drawn about network development and its structure, it is also shown that the use of additional techniques (e.g. small angle X-ray and neutron scattering techniques and optical rotation) and the combination with thermodynamics and network models, widens the insight in the crosslinking process and the gel structure tremendously.7,8
Acknowledgements
DY and MK would like to thank A. D. Schlüter and H. C. Öttinger for helpful comments. MK acknowledges support from the European community, EU-NSF contract NMP3-CT-2005-016375 and FP6-2004-NMP-TI-4 STRP 033339.References
- M. Rubinstein and R. H. Colby, Polymer Physics, Oxford University Press, Oxford, 2003 Search PubMed.
- C. N. Likos, Soft Matter, 2006, 2, 478 RSC.
- P. G. de Gennes, Scaling Concepts in Polymer Physics, Cornell University Press, Ithaca, NY, 1979 Search PubMed.
- S. Rieth, C. Baddeley and J. D. Badjic, Soft Matter, 2007, 3, 137–154 RSC.
- R. G. Larson, The structure and rheology of complex fluids, Oxford University Press, NY, 1999 Search PubMed.
- A. Keller, Faraday Discuss., 1995, 101, 1 RSC.
- K. T. Nijenhuis, Adv. Polym. Sci., 1997, 130, 1.
- Macromol. Symp., ed. E. Geissler, vol. 200, 2003 Search PubMed.
- M. Rubinstein and A. V. Dobrynin, Curr. Opin. Colloid Interface Sci., 1999, 4, 83 CrossRef CAS.
- N. M. Sangeetha and U. Maitra, Chem. Soc. Rev., 2005, 34, 821 RSC.
- A. N. Semenov and M. Rubinstein, Macromolecules, 1998, 31, 1373 CrossRef CAS.
- M. lshida and F. Tanaka, Macromolecules, 1997, 30, 3900 CrossRef.
- M. Rubinstein and A. N. Semenov, Macromolecules, 1998, 31, 1386 CrossRef CAS.
- J. V. Barth, J. Weckesser, C. Cai, P. Günter, L. Bürgi, O. Jeandupeux and K. Kern, Angew. Chem., Int. Ed., 2000, 39, 1230 CrossRef CAS.
- R. P. Sijbesma, F. H. Beijer, L. Brunsveld, B. J. B. Folmer, J. H. K. Ky Hirschberg, R. F. M. Lange, J. K. L. Lowe and E. W. Meijer, Science, 1997, 278, 1601 CrossRef CAS.
- M. Kröger and R. Makhloufi, Phys. Rev. E: Stat. Phys., Plasmas, Fluids, Relat. Interdiscip. Top., 1996, 53, 2531 CrossRef.
- M. Kröger, Phys. Rep., 2004, 390, 453 CrossRef.
- A. D. Schlüter and J. P. Rabe, Angew. Chem., Int. Ed., 2000, 39, 864 CrossRef CAS.
- D. Onoshima and T. Imae, Soft Matter, 2006, 2, 141 RSC.
- H. Frauenrath, Prog. Polym. Sci., 2005, 30, 325 CrossRef CAS.
- K. T. Kim, M. A. Winnik and I. Manners, Soft Matter, 2006, 2, 957–965 RSC.
- A. D. Schlüter, Top. Curr. Chem., 2005, 245, 151.
- P. M. Welch and C. F. Welch, Nano Lett., 2006, 6, 1922 CrossRef CAS.
- D. K. Christopoulos, A. F. Terzis, A. G. Vanakaras and D. J. Photinos, J. Chem. Phys., 2006, 125, 204907 CrossRef CAS.
- B. Helms and E. W. Meijer, Science, 2006, 313, 929 CrossRef CAS.
- Y. Ding, H. C. Öttinger, A. D. Schlüter and M. Kröger, J. Chem. Phys., 2007, 127, 094904 CrossRef CAS.
- C. W. G. Fishwick, A. J. Beevers, L. M. Carrick, C. D. Whitehouse, A. Aggeli and N. Boden, Nano Lett., 2003, 3, 1475 CrossRef CAS.
- E. Jahnke, I. Lieberwirth, N. Severin, J. P. Rabe and H. Frauenrath, Angew. Chem., Int. Ed., 2006, 45, 5383 CrossRef CAS.
- O. Peleg, M. Kröger and Y. Rabin, Europhys. Lett., 2007, 77, 58007 CrossRef.
- A. Onuki, Adv. Polym. Sci., 1993, 109, 63 CAS.
- K. Dusek and D. Patterson, J. Polym. Sci., Part A-2, 1968, 6, 1209–1216 CrossRef CAS.
- T. Tanaka, Phys. Rev. Lett., 1978, 40, 820 CrossRef CAS.
- T. Tanaka, D. Fillmore, S.-T. Sun, I. Nishio, G. Swislow and A. Shah, Phys. Rev. Lett., 1980, 45, 1636 CrossRef CAS.
- F. Ilmain, T. Tanaka and E. Kokufuta, Nature, 1991, 349, 400 CrossRef.
- M. Shibayama and T. Tanaka, Adv. Polym. Sci., 1993, 109, 1 CAS.
- T. Tanaka, S. T. Sun, Y. Hirokawa, S. Katayama, J. Kucera, Y. Hirose and T. Amiya, Nature, 1987, 325, 796 CrossRef CAS.
- K. Sekimoto, N. Suematsu and K. Kawasaki, Phys. Rev. A: At., Mol., Opt. Phys., 1989, 39, 4912 CrossRef CAS.
- R. A. McMillan, K. L. Caran, R. P. Apkarian and V. P. Conticello, Macromolecules, 1999, 32, 9067 CrossRef CAS.
- D. Rapaport, The Art of Molecular Dynamics Simulation, Cambridge University Press, Cambridge, 2nd edn, 2004 Search PubMed.
- M. P. Allen and D. J. Tildesley, Computer simulation of liquids, Clarendon, Oxford, 1989 Search PubMed.
- D. Frenkel and B. Smit, Understanding Molecular Simulation: From Algorithms to Applications, Academic Press, London, 2002 Search PubMed.
- M. Kröger, Models for polymeric and anisotropic liquids, Springer, Berlin, 2005 Search PubMed.
- L. Cipelletti and L. Ramos, Curr. Opin. Colloid Interface Sci., 2002, 7, 228 CrossRef CAS.
- T. Abete, A. de Candia, E. Del Gado, A. Fierro and A. Coniglio, Phys. Rev. Lett., 2007, 98, 088301 CrossRef CAS.
- K. A. Dawson, Curr. Opin. Colloid Interface Sci., 2002, 7, 218 CrossRef CAS.
- E. Del Gado and W. Kob, Phys. Rev. Lett., 2007, 98, 028303 CrossRef.
- A. Coniglio, T. Abete, A. de Candia, E. Del Gado and A. Fierro, J. Phys.: Condens. Matter, 2007, 19, 205103 CrossRef.
- Movies and an interactive tool converting between reduced and dimensional units are permanently available at http://www.complexfluids.ethz.ch/gels.
- C. Böttcher, B. Schade, C. Ecker, J. P. Rabe, L. Shu and A. D. Schlüter, Chem.–Eur. J., 2005, 11, 2923 CrossRef.
- M. Kröger, W. Loose and S. Hess, J. Rheol., 1993, 37, 1057 CrossRef.
- S. Hess, M. Kröger and H. Voigt, Physica A, 1998, 250, 58 CrossRef CAS.
- S. Hess, C. Aust, L. Bennett, M. Kröger, C. Pereira Borgmeyer and T. Weider, Physica A, 1997, 240, 126 CrossRef CAS.
- J. F. Ryder and J. M. Yeomans, J. Chem. Phys., 2006, 125, 194906 CrossRef CAS.
- M. Kröger and S. Hess, Physica A, 1993, 195, 336 CrossRef.
- M. Pasquali and D. C. Morse, J. Chem. Phys., 2002, 116, 1834 CrossRef CAS.
- H. C. Öttinger, Stochastic Processes in Polymeric Fluids, Springer, Berlin, 1996 Search PubMed.
- S. M. Rappaport and Y. Rabin, J. Phys. A: Math. Theor., 2007, 40, 4455 Search PubMed.
- A. G. Cherstvy and R. G. Winkler, J. Chem. Phys., 2004, 120, 9394 CrossRef CAS.
- J. E. Avron and D. Levine, Phys. Rev. Lett., 1992, 69, 208 CrossRef CAS.
- J.-P. Bouchaud and E. Pitard, Eur. Phys. J. E, 2001, 6, 231 CrossRef CAS.
- P. M. Chaikin and T. C. Lubensky, Principles of Condensed Matter Physics, Cambridge University Press, Cambridge, 1995 Search PubMed.
- F. Affouard, M. Kröger and S. Hess, Phys. Rev. E: Stat. Phys., Plasmas, Fluids, Relat. Interdiscip. Top., 1996, 54, 5178 CrossRef CAS.
- Electroactive polymer (EAP) actuators as artificial muscles, ed. Y. Bar-Cohen, SPIE press, Bellingham, 2001 Search PubMed.
- E. Del Gado, L. De Arcangelis and A. Coniglio, Phys. Rev. E: Stat., Nonlinear, Soft Matter Phys., 2002, 65, 041803 CrossRef.
- S. Panyukov and Y. Rabin, Phys. Rep., 1996, 269, 1 CrossRef CAS.
- Micelles, Membranes, Microemulsions and Monolayers, ed. W. Gelbart, A. Ben-Shaul and D. Roux, Springer, New York, 1994 Search PubMed.
- S. Hess, M. Kröger and W. G. Hoover, Physica A, 1997, 239, 449 CrossRef CAS.
- S. Hess, M. Kröger and D. J. Evans, Phys. Rev. E: Stat., Nonlinear, Soft Matter Phys., 2003, 67, 042201 CrossRef.
- O. Peleg, M. Kröger and Y. Rabin, in preparation. Will be available online at http://www.complexfluids.ethz.ch/cgi-bin/p?single=11372.
- P. Ilg, H. C. Öttinger and M. Kröger, in preparation. Will be available online at http://www.complexfluids.ethz.ch/cgi-bin/p?single=11310.
- K. Yasuda, J. P. Gong, Y. Katsuyama, A. Nakayama, Y. Tanabe, E. Kondo, M. Ueno and Y. Osada, Biomaterials, 2005, 26, 4468 CrossRef CAS.
- B. E. Batten, J. J. Aalberg and E. Anderson, Cell, 1980, 21, 885 CrossRef CAS.
- T. Brettschneider, S. Diez, K. Anderson, J. Heuser, M. Clarke, A. Müller-Taubenberger, J. Köhler and G. Gerisch, Curr. Biol., 2004, 14, 1 CrossRef.
| This journal is © The Royal Society of Chemistry 2008 |
