Controlled on-chip stimulation of quantal catecholamine release from chromaffin cells using photolysis of caged Ca2+ on transparent indium-tin-oxide microchip electrodes†‡
Xiaohui
Chen
ab,
Yuanfang
Gao
c,
Maruf
Hossain
c,
Shubhra
Gangopadhyay
c and
Kevin D.
Gillis
*abde
aDepartment of Biological Engineering, University of Missouri, Columbia, MO 65211, USA
bDalton Cardiovascular Research Center, University of Missouri, Columbia, MO 65211, USA
cDepartment of Electrical and Computer Engineering, University of Missouri, Columbia, MO 65211, USA
dDepartment of Medical Pharmacology and Physiology, University of Missouri, Columbia, MO 65211, USA
eDalton Cardiovascular Research Center, 134 Research Park Dr., Columbia, MO 65211, USA. E-mail: gillisk@missouri.edu
First published on 26th October 2007
Abstract
Photorelease of caged Ca2+ is a uniquely powerful tool to study the dynamics of Ca2+-triggered exocytosis from individual cells. Using photolithography and other microfabrication techniques, we have developed transparent microchip devices to enable photorelease of caged Ca2+, together with electrochemical detection of quantal catecholamine secretion from individual cells or cell arrays as a step towards developing high-throughput experimental devices. A 100 nm thick transparent indium-tin-oxide (ITO) film was sputter-deposited onto glass coverslips, which were then patterned into 24 cell-sized working electrodes (∼20 µm by 20 µm). We loaded bovine chromaffin cells with acetoxymethyl (AM) ester derivatives of the Ca2+ cage NP-EGTA and Ca2+ indicator dye fura-4F, then transferred these cells onto the working ITO electrodes for amperometric recordings. Upon flash photorelease of caged Ca2+, a uniform rise of [Ca2+]i within the target cell leads to quantal release of oxidizable catecholamines measured amperometrically by the underlying ITO electrode. We observed a burst of amperometric spikes upon rapid elevation of [Ca2+]i and a “priming” effect of sub-stimulatory [Ca2+]i on the response of cells to subsequent [Ca2+]i elevation, similar to previous reports using different techniques. We conclude that UV photolysis of caged Ca2+ is a suitable stimulation technique for higher-throughput studies of Ca2+-dependent exocytosis on transparent electrochemical microelectrode arrays.
Introduction
Neurons and neuroendocrine cells secrete signaling molecules viaCa2+-dependent exocytosis, a process in which intracellular vesicles fuse with the cell membrane and release their contents of hormones and neurotransmitters into the extracellular space in response to an increase in intracellular Ca2+ concentration ([Ca2+]i). Techniques that can measure “quantal” release, i.e., release of the contents of individual vesicles, are particularly powerful to study exocytosis at the molecular level. Among these, carbon fiber amperometry stands out as a high temporal-resolution technique for detecting quantal vesicle release events.1–3 In brief, a carbon fiber microelectrode is placed close to a cell that secretes electroactive substances, such as dopamine, epinephrine, norepinephrine or serotonin, and is held at a constant potential. Upon stimulation of the cell, oxidative current spikes are measured, with each spike reporting a single-vesicle release event. Integration of the current spike indicates the amount of transmitter released by an individual vesicle. The time course of the spike also provides important information about vesicle release kinetics, such as the initial flux of transmitter through a nanometre-scale fusion pore.2,4–6Vesicle release kinetics are altered upon activation of second-messenger systems, so quantal assays of exocytosis are used to understand regulatory mechanisms of the cell.7–9 In addition, measurements of quantal exocytosis following experimental perturbations of relevant proteins provide detailed information about the molecules that trigger or regulate vesicle fusion.10,11A drawback to the use of carbon fiber electrodes to measure quantal exocytosis is that it is a low-throughput and labor-intensive technique. This is because carbon fiber microelectrodes are manually fabricated in small lots, must be manually positioned close to cells using micromanipulators, and can only record from one cell at a time. Application of microchip technology potentially offers compact, automated, high-throughput lab-on-a-chip solutions to biomedical studies at the single-cell level.12 Recent efforts to develop microfabricated devices to electrochemically measure quantal exocytosis, include gold electrodes patterned in cell-sized wells etched in silicon to enable detection over a large area of the cell,13 a glass microchip with 4 platinum electrodes surrounding a single cell to enable localization of the site of release on the cell surface,14,15 and a carbon electrode on a silicon substrate to detect serotonin release from isolated vesicles.16 Our group17 and another18 have recently demonstrated quantal release of catecholamines from chromaffin cells using transparent ITO electrodes patterned on a glass substrate to potentially allow simultaneous optical and amperometric measurements of cells using conventional inverted microscopy.
The most commonly used method to stimulate exocytosis for amperometric studies is perfusion of high-K+ solution, which leads to cell membrane depolarization, opening of voltage-gated Ca2+ channels, influx of Ca2+ and then Ca2+-triggered exocytosis.13,17,19 Although high-K+ stimulation is an effective way to trigger exocytosis, it only allows indirect control of the [Ca2+]i stimulus, which makes it difficult to resolve which step in the stimulus-secretion cascade is affected by an experimental perturbation. Perfusion of buffered Ca2+ solutions over permeabilized cells allows more direct control of [Ca2+]i8, but readily diffusible cytosolic components are lost upon membrane permeabilization. In addition, the rate that [Ca2+]i can be elevated is limited by the solution exchange time, therefore rapid kinetic phases of Ca2+-triggered exocytosis cannot be resolved.
Arguably the most powerful stimulation method for studying Ca2+-secretion coupling with high temporal resolution, is photorelease of “caged” Ca2+ within cells.20–22 Caged Ca2+ compounds are organic molecules that bind Ca2+ with a high affinity but undergo a large decrease in affinity for Ca2+ upon UV photolysis. Flash photolysis leads to rapid elevation of [Ca2+]i to enable measurement of fast kinetic phases of exocytosis. In addition, photoelevation of [Ca2+]i is believed to occur in a spatially uniform manner throughout the cell. In contrast, depolarization-evoked Ca2+ entry leads to steep near-membrane Ca2+ gradients, so that the local [Ca2+]i that is driving exocytosis is difficult to measure with fluorescent Ca2+ indicators. Thus, a combination of caged Ca2+ with fluorescent Ca2+ indicators allows fine control and accurate measurement of the [Ca2+]i stimulus.
Here we report the development of an innovative microchip device, which integrates the caged Ca2+ technique with transparent ITO electrodes and fluorescence photometry, to perform controlled on-chip stimulation of Ca2+-dependent exocytosis. By integrating the caged Ca2+ technique into our ITO microchip devices, we can elevate [Ca2+]i to a targeted level to trigger and measure exocytosis. Our results demonstrate that, upon flash photolysis, a burst of catecholamine release was detected from cells sitting above the transparent recording ITO electrodes, similar to previous reports using different techniques.23,24
Materials and methods
Design, microfabrication and testing of ITO microchip
![[thin space (1/6-em)]](https://www.rsc.org/images/entities/char_2009.gif) 000 dpi) transparency mask (CAD Art Services, Bandon, OR, USA) and then developed in M351 (Rohm and Haas electronic materials) for ∼1 min. It was then baked at 200 °C on the hot plate for 10 min. An acidic solution composed of 6 M HCl and 0.2 M FeCl3 was used to wet etch the portion of the ITO film that was not protected by photoresist for 30 min, leaving 20 µm wide ITO stripes (vertical stripes in Fig. 1(B) bottom) that widen to form connecting pads on the edge of the chip (Fig. 1(B) top). The photoresist protection layer was then removed with an acetone wash. The cover glass with patterned ITO electrodes was rinsed with de-ionised water and air-dried. Using similar photolithographic methods, we insulated the bulk of the ITO stripes with photoresist, leaving a 20 µm wide opening orthogonal to the ITO stripes (horizontal stripe in Fig. 1(B) bottom) to result in an array of 24 working electrodes with dimensions of 20 µm by 20 µm. In some of our earlier experiments we used AZ P4620 positive photoresist (AZ Electronic Materials USA Corp, Branchburg, NJ, USA) to pattern ITO electrodes following a similar procedure.
000 dpi) transparency mask (CAD Art Services, Bandon, OR, USA) and then developed in M351 (Rohm and Haas electronic materials) for ∼1 min. It was then baked at 200 °C on the hot plate for 10 min. An acidic solution composed of 6 M HCl and 0.2 M FeCl3 was used to wet etch the portion of the ITO film that was not protected by photoresist for 30 min, leaving 20 µm wide ITO stripes (vertical stripes in Fig. 1(B) bottom) that widen to form connecting pads on the edge of the chip (Fig. 1(B) top). The photoresist protection layer was then removed with an acetone wash. The cover glass with patterned ITO electrodes was rinsed with de-ionised water and air-dried. Using similar photolithographic methods, we insulated the bulk of the ITO stripes with photoresist, leaving a 20 µm wide opening orthogonal to the ITO stripes (horizontal stripe in Fig. 1(B) bottom) to result in an array of 24 working electrodes with dimensions of 20 µm by 20 µm. In some of our earlier experiments we used AZ P4620 positive photoresist (AZ Electronic Materials USA Corp, Branchburg, NJ, USA) to pattern ITO electrodes following a similar procedure.
![Design of the instrument for on-chip photolysis of caged Ca2+ and electrochemical measurement of quantal exocytosis using transparent ITO microelectrodes. (A) Schematic of the experimental system. The flash lamp is used for rapid (∼1 ms) photolysis of the cage, whereas the monochromator excites Ca2+ indicator dyes to measure [Ca2+]i. (B) Top: photo of microchip with 24 electrochemical ITO electrodes. Bottom: a DIC micrograph of 2 working ITO electrodes with dimensions of 20 × 20 µm.](/image/article/2008/LC/b715308m/b715308m-f1.gif) | ||
| Fig. 1 Design of the instrument for on-chip photolysis of caged Ca2+ and electrochemical measurement of quantal exocytosis using transparent ITO microelectrodes. (A) Schematic of the experimental system. The flash lamp is used for rapid (∼1 ms) photolysis of the cage, whereas the monochromator excites Ca2+ indicator dyes to measure [Ca2+]i. (B) Top: photo of microchip with 24 electrochemical ITO electrodes. Bottom: a DIC micrograph of 2 working ITO electrodes with dimensions of 20 × 20 µm. | ||
Cell preparation and solutions
For the caged Ca2+ experiments with digitonin-permeablized cells on ITO electrodes, the “intracellular mimicking solution” consisted of (in mM): 100 K-glutamate, 20 DPTA, 6.49 CaCl2, 10 NP-EGTA, 30 HEPES (titrated to pH 7.2 with KOH), 2 Na2ATP, 50 µM bisfura-2 and 50 µM fura-2FF. Cells were initially permeabilized in culture media containing 20 µM digitonin. The usual cell bathing solution consisted of (in mM): 150 NaCl, 5 KCl, 1.2 MgCl2, 2 CaCl2, 10 HEPES, 11 glucose, titrated to pH 7.2 with NaOH.
For the experiments using AM ester cell loading, the “incubation solution” for loading cells consisted of 25 µM NP-EGTA (AM) and 5 µM fura-4F (AM) in Dulbecco's Modified Eagles Medium (DMEM). Stock solutions of NP-EGTA (AM) and fura-4F (AM) were dissolved in DMSO at a concentration of 5 mM with 10% w/v Pluronic F-127 to facilitate loading. For the “Ca2+ priming effect” experiments, the bath solution was either the standard cell bathing solution or a solution with lower Ca2+ (1 mM). NP-EGTA (AM) and fura-4F (AM) were obtained from Invitrogen (Carlsbad, CA, USA). All other reagents were obtained from Sigma (St. Louis, MO, USA) unless otherwise stated.
[Ca2+]i calibration, photorelease and measurement
 | (1) |
For experiments using AM ester loaded cells, we used the Ca2+ indicator dye fura-4F (AM). Since fura-4F (AM) is hydrolyzed to the free base fura-4F inside the cell, we performed calibrations by loading a solution containing the fura-4F (K+ salt) into cells through a patch-clamp pipette during whole-cell recordings. The 4 calibration solutions we used contained 10 mM EGTA, with either 0, 6.7 mM or 9 mM CaCl2, to yield free [Ca2+] values “0”, 311 nM, or 1.2 µM. In addition, a solution containing 10 mM CaCl2 without EGTA was used to measure the fluorescence of Ca2+-saturated fura-4F. Fluorescent ratios obtained from 360 nm versus 380 nm stimulation were fitted by the equation from Grynkiewicz et al.,28 to obtain Keff, Rmin, and Rmax.
On-chip amperometry and photometry
For the experiments using photorelease of caged Ca2+ in digitonin-permeabilized cells, 5 µM digitonin in DMSO (0.1% after dilution in culture media) was added into a T25 flask of cultured chromaffin cells and incubated in a humidified incubator (37 °C, 5% CO2) for 2 min. Then the cells were vigorously washed off the flask with the media, transferred into a 15 ml conical tube, and centrifuged at 100 g for 4 min. The supernatant was aspirated out and 100 µl “intracellular mimicking solution” was added and the cell pellet was resuspended. ∼20 µl of the cell suspension was pipetted onto the ITO microchip. Brief exposures to 360 nm and 380 nm light were used to measure [Ca2+]i, whereas continuous 360 nm light from the monochromator was used to photorelease the caged Ca2+. The amperometric current from quantal release of oxidative catecholamines was measured using a patch-clamp amplifier (EPC9, HEKA, Lambrecht, Germany) with a dc potential at 700 mV, relative to a Ag/AgCl ground electrode placed in the drop of solution. The monochromator was dark while recording amperometric current from cells sitting on the ITO electrodes. We used the data acquisition interface built into the EPC9 patch-clamp amplifier and Pulse software (HEKA) to control the monochromator for these experiments.For the experiments where cells were loaded with AM cage and indicator, chromaffin cells were washed off a T25 flask with 2 ml DMEM and transferred into a 35 mm tissue culture dish. After adding 25 µM NP-EGTA (AM) and 5 µM fura-4F (AM), we incubated the cell suspension in a humidified incubator (37 °C, 5% CO2) for 60 min. Then the cell suspension was centrifuged at 100 g for 4 min. The supernatant was removed using a Pasteur pipette and discarded. The pellet was resuspended in 5 ml of the standard cell bathing solution. The cell suspension was again centrifuged at 100 g for 4 min and the supernatant was removed with a Pasteur pipette and discarded. 700 µl cell bathing solution was added and the pellet was resuspended. About 20 µl of the cell solution was pipetted onto the ITO microchip.
Results
Design and fabrication of a biochip device with multiple cell-sized ITO electrodes
Effective use of caged Ca2+ requires use of a high-numerical-aperture lens, both to focus the excitation light and to collect fluorescent light emitted by the Ca2+ indicator dye with high efficiency. The distance between the lens surface and the sample (working distance) is typically ∼0.3 mm for common high numerical aperture objective lenses, therefore, fluorescent microscopy is often carried out using an inverted microscope, with cells visualized from below through a thin glass coverslip. Thus, fluorescence measurement of cells on microchips is most conveniently carried out using a thin transparent substrate. Another important design principle for our application is that the working electrochemical electrodes should be small to minimize background noise so that ∼pA-scale currents, due to quantal exocytosis, can be resolved. Finally, electrochemical electrodes need to be directly adjacent to cells (within several µm) so that released catecholamines diffuse to the electrode over a brief enough interval so that a recognizable “spike” of oxidative current is produced to indicate the time course of release from an individual vesicle.Our solution to these design constraints is depicted in schematic fashion in Fig. 1(A). Use of transparent ITO electrodes allows us to visualize cells sitting directly on top of electrochemical electrodes, therefore we sputter-deposited a thin (∼100 nm) ITO film on size 2 glass coverslips (nominal thickness ∼220 µm). We used photolithography and wet etching to pattern the ITO into 24 cell-sized working electrodes (see Methods section for details). During experiments, one of the electrodes is connected to the headstage of the amplifier to serve as the working electrode. A Ag/AgCl wire is immersed in the drop containing the cell suspension to serve as the ground electrode. A computer controls the firing of a UV flash lamp to photolyze caged Ca2+ within cells. A monochromator is used to excite the Ca2+ indicator dye at a pair of wavelengths (360/380 nm) and is also under computer control. A high numerical aperture objective lens on an inverted microscope is used to both focus the flash and monochromator excitation light on the cell and collect the emitted fluorescent light. A photodiode is used to measure the fluorescent light emitted by the Ca2+ indicator dye.
A photograph of our microchip device is shown in the upper panel of Fig. 1(B). The 24 ITO squares around the edge of the microchip serve as the connection pads to facilitate connection to the amplifier headstage. A PDMS gasket sealed around the 24 ITO working electrodes functions as a reservoir for the drop of solution containing the cell suspension. The lower panel of Fig. 1(B) is a photomicrograph showing 2 of the 24 working electrodes. The vertical stripes are 20 µm wide ITO stripes patterned by wet etching, whereas the 20 µm wide horizontal stripe is the opening of the photoresist that serves to insulate portions of the ITO film that are not electrochemically active. Therefore, the working electrodes are at the intersection of the vertical and horizontal stripes.
Characterization of ITO working electrodes
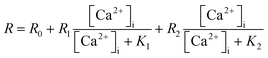
It is important for our deposited ITO film to pass both visible and near-UV light in order to photolyze the Ca2+ cage (<∼400 nm), excite the Ca2+ indicators (360 nm, 380 nm) and pass the fluorescent light (∼500 nm). We optimized the fabrication parameters for ITO sputter-deposition on cover glass, so that 80% of light is transmitted for wavelengths longer than 360 nm (Fig. 2(A), see Methods section for deposition parameters). The transmittance spectrum of our ITO-coated cover glasses (ITO thickness: 110 nm) is comparable to commercially available ITO-coated glass slides with a thinner ITO coating (15–30 nm). The electrical conductance of the ITO electrodes was also optimized. The measured sheet resistance of ITO-coated cover glass is 5.38 Ω per square, with a resistivity of 0.59 × 10⁻⁴ Ωcm.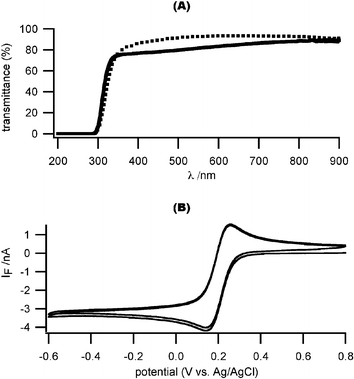 | ||
| Fig. 2 Optical and electrochemical characterization of ITO microelectrodes. (A) The optical transmittance of our sputtered ITO film is comparable to a commercially available ITO film (solid line: our ITO-coated coverslip with a 110 nm-thick ITO coating; dotted line: commercial ITO-coated glass slide with a 15–30 nm thick ITO coating). (B) Cyclic voltammogram with test analyte (1 mM K3Fe(CN)6 in 0.5 M KCl, pH 3, scan rate 1 V s–1). The ITO microelectrode had dimensions of 17.5 µm by 25 µm. | ||
We next characterized the electrochemical response of our patterned ITO electrodes using a standard reversible analyte: 1 mM K3Fe(CN)6 in 0.5 M KCl, pH 3.0. Fig. 2(B) shows a sample voltammogram (scan rate: 1 V s–1) that exhibits a sharp transition and flat diffusion-limited reduction current for potentials more negative than ∼ –0.2 V versusAg/AgCl, indicative of an appropriately low series resistance. The theoretical value of a diffusion limited current (ilim) for a univalent reaction on a disk electrode in an infinite plane is given by:
| ilim = 4FDCr |
We also measured the specific capacitance of our deposited ITO film electrodes using sinusoidal voltage stimulation (frequency 1 kHz, peak amplitude 1 mV). The measured specific capacitance of a typical 20 µm by 20 µm ITO working electrode is ∼0.1 pF µm–2, comparable to the value we measured from commercially available ITO slides17 and carbon fiber microelectrodes.29
Photorelease of caged Ca2+ in digitonin-permeabilized cells
Our initial approach to stimulate cell secretion through photorelease of caged Ca2+ was to pemeabilize cell membranes with digitonin to allow loading of the cage and Ca2+ indicators into cells. To confirm the efficacy of cell permeabilization by digitonin, we first positioned a carbon fiber electrode adjacent to a chromaffin cell in our standard cell bath solution lacking Ca2+. A pipette containing 20 µM digitonin and ∼20 µM free Ca2+ was brought close to the cell and the pipette solution was perfused onto the cell membrane. Free Ca2+ diffused into the cell through the permeabilized cell membrane and triggered quantal catecholamine release, which was detected by the carbon fiber electrode (Fig. 3(A)). | ||
| Fig. 3 On-chip amperometric detection of quantal catecholamine release from digitonin-permeabilized cells. (A) Catecholamine release from digitonin-permeabilized chromaffin cells detected by a carbon fiber electrode. (B) Top: typical amperometric spikes recorded from digitonin-permeabilized chromaffin cells sitting on top of ITO electrodes. The sloping baseline is a current artifact that resulted from cage photolysis. Bottom: expanded view of the interval outlined by the gray box in the top panel. | ||
We next loaded digitonin permeabilized chromaffin cells with the Ca2+ cage NP-EGTA and Ca2+ indicator dyes (an equimolar combination of bisfura-2 and fura-2FF). To minimize the impact of endogenous Ca2+ buffers, we designed an “intracellular mimicking solution” with very high Ca2+ buffer capacity. This solution was intended to confound the ability of intracellularCa2+ buffers to reduce [Ca2+]i within the cell (e.g., see ref. 30) in order to minimize the gradient of [Ca2+]i between the inside and outside of the cells after photolysis of caged Ca2+. Loaded cells were transferred to the microchip device. Those cells settling on top of the ITO microelectrodes were used for amperometric recordings. Upon UV photolysis of caged Ca2+, we detected oxidative current spikes as released catecholamine molecules were oxidized on the surface of ITO microelectrodes (Fig. 3(B)). Surprisingly, we also detected a large background current that continued for tens of seconds, even when the excitation light was terminated (Fig. 3(B)). This slowly varying current occurred whether cells were present or not, and resulted from photolysis of caged Ca2+ in the bath solution because it was absent when the cage was removed (data not shown).
Use of membrane-permeant (AM) forms of the Ca2+ cage and Ca2+ indicator
The large current artifact due to photolysis of cage-containing solution over the electrochemical electrode led us to pursue an alternative approach, whereby we used membrane-permeant acetoxymethyl (AM) ester derivatives of the Ca2+ cage (NP-EGTA) and the Ca2+ indicator (fura-4F). Modification of carboxylic acids with AM ester groups creates an uncharged molecule that can permeate cell membranes. Once inside the cell, the lipophilic blocking groups are cleaved by nonspecific esterases within the cell, resulting in a charged form that leaks out of cells much more slowly than its parent compound.31Bovine adrenal chromaffin cells were incubated with NP-EGTA (AM) and fura-4F (AM) and then washed with a dye-free and cage-free bath solution. A drop of cell-containing solution was then transferred to the microchip device. Fig. 4(A) presents a photomicrograph of cells that settled randomly on the microdevice. In this example, an individual chromaffin cell settled onto the working electrochemical electrode, which is at the intersection of the horizontal and vertical stripes in the center of the photo. We were able to verify the loading of fura-4F AM by measuring the green cell fluorescence in response to 360 nm excitation (Fig. 4(B), taken from a different experiment). We set the aperture defining the illuminated area and the aperture defining the area of collected fluorescent light equal to the location of the working electrode. This ensures that only the cell on the working electrode is stimulated upon photolysis of the cage and that the measured fluorescent light is reporting the [Ca2+]i of the cell under study.
![On-chip amperometric exocytosis measurement from cells loaded with AM forms of the Ca2+ cage and Ca2+ indicator (A) A DIC picture of an individual chromaffin cell sitting on top of an ITO working electrode (20 µm by 20 µm). (B) A chromaffin cell loaded with fura-4F (AM) sitting on top of a working ITO electrode (white square) fluoresces in response to UV excitation. (C) Spectrum of light-induced current artifact at ITO electrochemical electrodes immersed in cell bathing solution (dark trace: light on; gray trace: light off). (D) Quantal catecholamine release from chromaffin cell induced by Ca2+ uncaging. (a) A sample amperometric response to flash photolysis of caged Ca2+ from a cell sitting on an ITO electrode. (b) Light-induced current artifact from an ITO electrochemical electrode. Discharge of the flash lamp produces a large, rapidly decaying current artifact. Illumination from the monochromator alternating between 360 nm and 380 nm to measure [Ca2+]i with a fluorescent indicator produces small pulse-like current transients (inset). (c) Faradaic current due to oxidation of catecholamines released from the cell obtained by subtracting the light-induced artifacts (b) from the recorded current (a). (d) Fluorescent measurement of [Ca2+]i using fura-4F (AM) reports rapid [Ca2+]i elevation from 281 nM to 3.6 µM upon UV photolysis of caged Ca2+.](/image/article/2008/LC/b715308m/b715308m-f4.gif) | ||
| Fig. 4 On-chip amperometric exocytosis measurement from cells loaded with AM forms of the Ca2+ cage and Ca2+ indicator (A) A DIC picture of an individual chromaffin cell sitting on top of an ITO working electrode (20 µm by 20 µm). (B) A chromaffin cell loaded with fura-4F (AM) sitting on top of a working ITO electrode (white square) fluoresces in response to UV excitation. (C) Spectrum of light-induced current artifact at ITO electrochemical electrodes immersed in cell bathing solution (dark trace: light on; gray trace: light off). (D) Quantal catecholamine release from chromaffin cell induced by Ca2+ uncaging. (a) A sample amperometric response to flash photolysis of caged Ca2+ from a cell sitting on an ITO electrode. (b) Light-induced current artifact from an ITO electrochemical electrode. Discharge of the flash lamp produces a large, rapidly decaying current artifact. Illumination from the monochromator alternating between 360 nm and 380 nm to measure [Ca2+]i with a fluorescent indicator produces small pulse-like current transients (inset). (c) Faradaic current due to oxidation of catecholamines released from the cell obtained by subtracting the light-induced artifacts (b) from the recorded current (a). (d) Fluorescent measurement of [Ca2+]i using fura-4F (AM) reports rapid [Ca2+]i elevation from 281 nM to 3.6 µM upon UV photolysis of caged Ca2+. | ||
Upon flash photolysis of caged Ca2+ inside a cell sitting immediately above an ITO microelectrode, fura-4F reported a step-like increase of [Ca2+]i to ∼3.5 µM (Fig. 4(D) (d)). Flash photoillumination did not result in an increase in [Ca2+]i if cells were incubated in fura-4F AM without the cage (data not shown). Simultaneously, the ITO microelectrode detected a wave of oxidative current consistent with a burst of catecholamine release from the cell (Fig. 4(D) (a)).32 Note that current spikes are evident, which likely represent quantal release from individual vesicles fusing to the bottom surface of the cell immediately adjacent to the electrode. Note that the amperometric current diminishes despite the continuous elevation of [Ca2+]i. This is thought to be due to depletion of a readily releasable pool of vesicles that are docked to the plasma membrane and primed for release.22
We noticed that UV illumination creates a modest background current (Fig. 4(D) (b)) even in the absence of caged Ca2+ in the bath solution. In fact, this light-induced current is noted in the absence of cells. We and others have previously noted a small light-induced current in carbon fiber electrodes also (data not shown). We scanned the wavelength of the monochromator to obtain an excitation spectrum of the light-induced current (Fig. 4(C)). The spectrum reveals that the current is prominent for UV to blue excitation wavelengths. This light-induced current produces small pulse-like current artifacts when the excitation wavelength is alternated between 360 nm and 380 nm for fluorescent [Ca2+]i measurements (see inset of Fig. 4(D) (b)), and a large, rapidly decaying current artifact when the flash lamp discharges (Fig. 4(D) (b)). By subtracting the light-induced current (Fig. 4(D) (b)) from the amperometric current elicited from photorelease of caged Ca2+ in a cell (Fig. 4(D) (a)), we can eliminate the light-induced current artifact (Fig. 4(D) (c)).
“Priming” effect of sub-stimulatory [Ca2+]i on catecholamine release reported by microchip devices
Most neuron and neuroendocrine cells secrete hormone and neurotransmittersviaCa2+-dependent exocytosis, a process involving the fusion of vesicles with plasma membrane, triggered by a rise in [Ca2+]i.Vesicles undergo several steps, such as translocation, docking, and priming, before they are ready to fuse with the plasma membrane and release their content into the extracellular environment.33 Although the exact role of Ca2+ in every step of this vesicle cycle is not completely understood, experimental evidence suggests that a moderate increase in basal [Ca2+]i facilitates priming vesicles to become fusion-competent.34–36We performed a set of experiments using the ITO microdevices to correlate the response to flash photoelevation of [Ca2+]i with the basal [Ca2+]i level before the flash. In order to obtain a larger range of basal [Ca2+]i, we incubated cells in a bath solution containing either 1 mM or 2 mM Ca2+. Fig. 5(B) depicts a typical robust response to photoelevation of [Ca2+]i when basal [Ca2+]i is relatively high (680 nM), whereas Fig. 5(A) depicts a much smaller response from a cell with a low initial [Ca2+]i (243 nM). Note that, whereas the basal, pre-flash [Ca2+]i varies ∼3-fold between the 2 cells, the post-flash [Ca2+]i that triggers release is similar (3.29 µM versus 3.95 µM). Therefore, the difference in response is potentially due to Ca2+-dependent “priming” of exocytosis. Whereas Fig. 5(B) depicts a response with few amperometric spikes, many cells with low basal [Ca2+]i had no detectable amperometric response at all to photoelevation of [Ca2+]i. We found that out of 37 cells with basal [Ca2+]i lower than 600 nM (mean [Ca2+]i = 267 nM), only 9 cells showed detectable catecholamine release (defined as one or more amperometric spikes with an amplitude greater than 10 pA) in response to flash photoelevation of [Ca2+]i (mean post-flash [Ca2+]i = 3.11 µM). In contrast, 17 out of 34 cells with basal [Ca2+]i above 600 nM (mean basal [Ca2+]i = 976 nM) respond with a burst of amperometric spikes to photoelevation of [Ca2+]i (mean post-flash [Ca2+]i = 3.21 µM).
![Elevation of “basal” (pre-flash) [Ca2+]i results in more catecholamine release in response to flash photoelevation of [Ca2+]i. (A) Sample response of a cell with lower initial [Ca2+]i (243 nM), to photo-elevation of [Ca2+]i to several µM. (B) Sample response of a different cell with higher initial [Ca2+]i (680 nM).](/image/article/2008/LC/b715308m/b715308m-f5.gif) | ||
| Fig. 5 Elevation of “basal” (pre-flash) [Ca2+]i results in more catecholamine release in response to flash photoelevation of [Ca2+]i. (A) Sample response of a cell with lower initial [Ca2+]i (243 nM), to photo-elevation of [Ca2+]i to several µM. (B) Sample response of a different cell with higher initial [Ca2+]i (680 nM). | ||
Discussion
We describe here a novel biochip device to perform on-chip optical stimulation and electrochemical detection of Ca2+-dependent exocytosis at the single-vesicle level. Use of transparent ITO electrodes on a glass coverslip substrate allows us to use an inverted microscope with a high numerical aperture objective lens for high efficiency fluorescence measurement of cell [Ca2+]i and on-chip photolysis of caged Ca2+. Previous work in our lab has shown that transparent ITO microelectrodes have a similar electrochemical performance as carbon fiber electrodes.17 Using the acetoxymethyl ester derivative of the Ca2+ cage NP-EGTA and the Ca2+ indicator dye fura-4F, we are able to deliver caged Ca2+ and Ca2+ indicator dye into a cell population in a much faster and less invasive manner than delivery through a patch-clamp pipette. Since we can restrict the light excitation aperture to cell-size, we can confine photorelease of caged Ca2+ and measurement of [Ca2+]i to an individual cell (Fig. 4(B)).We encountered 2 different light-induced current artifacts in our recordings. A large light-induced current was produced only when the Ca2+ cage was in the bath solution and decayed for tens of seconds after illumination was discontinued (Fig. 3(B)). Possible sources for this current are acidification of the solution upon cage photolysis or electrochemical activity of one or more byproducts of NP-EGTA photolysis. This artifact was eliminated by preloading cells with the membrane-permeant AM form of NP-EGTA. The other light-induced artifact was smaller, decayed rapidly following a light pulse, and was prominent for wavelengths in the blue to UV range (Fig. 4(D) (a),(b)). Light effects on metal electrochemical electrode currents were observed as early as 1839 by M. Edmond Becquerel37 and likely result from a low-efficiency water-splitting reaction at the metal–electrolyte junction.38 Unfortunately, this artifact is difficult to avoid in ratiometric measurement of [Ca2+]i because fluorescent indicators in the fura-2 family are excited over this same range of wavelengths. The use of fluorescent Ca2+ indicators excited by longer wavelengths could minimize this problem, but the available indicators are not ratiometric, so accurate calibration is problematic. Nevertheless, we were able to eliminate this artifact by subtracting the current elicited by illumination of the electrode in the absence of a cell (Fig 5D (c)).
Our on-chip experiments show that this ITO biochip device is suitable for study of exocytosis. We observed a burst of amperometric spikes upon rapid elevation of [Ca2+]i as shown in Fig. 4(D) and Fig. 5. A wave of oxidative current with superimposed spikes was observed following flash photolysis of caged Ca2+, which is likely due to a burst of catecholamine release from the cell, similar to previous reports using carbon fiber electrodes.32 Using our biochip device, we have also observed that the response to step elevation of [Ca2+]i depends on the basal [Ca2+]i level before the flash (Fig. 5). Higher basal [Ca2+]i (>∼600 nM) appears to “prime” vesicles for exocytosis, similar to previous reports using different techniques.34,35 Our microchip device should facilitate further study of this effect. For example, it would be straightforward to use a feed-back control system to control UV illumination to elevate [Ca2+]i to different sub-stimulatory levels and study the dose response of the “priming” effect on a subsequent secretory response triggered by a higher [Ca2+]i level.
Our approach allows very powerful control of the Ca2+ stimulus and measurement of quantal exocytosis. With our current approach of random placement of cells on electrodes, we typically get 4 cells on electrodes per chip, which allows slightly higher throughput than with the use of carbon fiber electrodes, which are manually positioned to record from one cell at a time. An area for future improvement to enable higher throughput would be to integrate approaches to automatically target cells to the electrochemical electrodes. Another opportunity for improvement would be to integrate on-chip amplifier arrays and a sensitive CCD camera to allow parallel stimulation and recording from many cells simultaneously in an electrode array.
Conclusion
We have designed and microfabricated a novel biochip device to integrate photolysis of caged Ca2+, ITO amperometry, and fluorescence photometry together for higher-throughput on-chip stimulation and detection of Ca2+-dependent exocytosis. This biochip device has potential applications for higher-throughput screening of drugs and toxins that target exocytosis. In addition, studies of exocytosis which use green fluorescent protein as a reporter of gene expression could benefit from the transparent device.Acknowledgements
We thank Drs Timothy E. Glass and Prabir Choudhury for their kind gift of NP-EGTA (K+ salt). Also we thank MEMC Electronic Materials Inc. (St. Peters, MO, USA) for the gift of silicon wafers. This research is supported by NIH NS048826. Some of the micrographs were obtained using a microscope purchased from NIH MRI grant 1S10RR022578.References
- R. M. Wightman, J. A. Jankowski, R. T. Kennedy, K. T. Kawagoe, T. J. Schroeder, D. J. Leszczyszyn, J. A. Near, E. J. Diliberto, Jr. and O. H. Viveros, Proc. Natl. Acad. Sci. U. S. A., 1991, 88, 10754–10758 CAS.
- R. H. Chow, L. von Ruden and E. Neher, Nature, 1992, 356, 60–63 CrossRef CAS.
- E. R. Travis and R. M. Wightman, Annu. Rev. Biophys. Biomol. Struct., 1998, 27, 77–103 CrossRef CAS.
- R. G. W. Staal, E. V. Mosharov and D. Sulzer, Nat. Neurosci., 2004, 7, 341 CrossRef CAS.
- A. Albillos, G. Dernick, H. Horstmann, W. Almers, G. A. de Toledo and M. Lindau, Nature, 1997, 389, 509 CrossRef CAS.
- Z. Zhou, S. Misler and R. H. Chow, Biophys. J., 1996, 70, 1543–1552 CrossRef CAS.
- D. Sulzer and E. N. Pothos, Rev. Neurosci., 2000, 11, 159–212 Search PubMed.
- M. E. Graham, R. J. Fisher and R. D. Burgoyne, Biochimie, 2000, 82, 469–479 CrossRef CAS.
- J. D. Machado, A. Morales, J. F. Gomez and R. Borges, Mol. Pharmacol., 2001, 60, 514–520 CAS.
- M. E. Graham and R. D. Burgoyne, J. Neurosci., 2000, 20, 1281–1289 CAS.
- C. T. Wang, R. Grishanin, C. A. Earles, P. Y. Chang, T. F. Martin, E. R. Chapman and M. B. Jackson, Science, 2001, 294, 1111–1115 CrossRef CAS.
- D. Di Carlo and L. P. Lee, Anal. Chem., 2006, 78, 7918–7925 CrossRef.
- P. Chen, B. Xu, N. Tokranova, X. Feng, J. Castracane and K. D. Gillis, Anal. Chem., 2003, 75, 518–524 CrossRef CAS.
- A. F. Dias, G. Dernick, V. Valero, M. G. Yong, C. D. James, H. G. Craighead and M. Lindau, Nanotechnology, 2002, 13, 285–289 CrossRef CAS.
- I. Hafez, K. Kisler, K. Berberian, G. Dernick, V. Valero, M. G. Yong, H. G. Craighead and M. Lindau, Proc. Natl. Acad. Sci. U. S. A., 2005, 102, 13879–13884 CrossRef.
- V. Parpura, Anal. Chem., 2005, 77, 681–686 CrossRef.
- X. H. Sun and K. D. Gillis, Anal. Chem., 2006, 78, 2521–2525 CrossRef CAS.
- C. Amatore, S. Arbault, Y. Chen, C. Crozatier, F. Lemaitre and Y. Verchier, Angew. Chem., Int. Ed., 2006, 45, 4000–4003 CrossRef CAS.
- H. F. Cui, J. S. Ye, Y. Chen, S. C. Chong, X. Liu, T. M. Lim and F. S. Sheu, Sens. Actuators, B, 2006, 115, 634–641 CrossRef.
- R. Y. Tsien and R. S. Zucker, Biophys. J., 1986, 50, 843–853 CrossRef CAS.
- J. H. Kaplan and G. C. Ellis-Davies, Proc. Natl. Acad. Sci. U. S. A., 1988, 85, 6571–6575 CAS.
- J. B. Sorensen, Pflugers Arch., 2004, 448, 347–362 CAS.
- E. Neher and R. S. Zucker, Neuron, 1993, 10, 21–30 CrossRef CAS.
- Y. Yang, T. J. Craig, X. Chen, L. F. Ciufo, M. Takahashi, A. Morgan and K. D. Gillis, J. Gen. Physiol., 2007, 129, 233–244 CrossRef CAS.
- W. L. Deng, T. Ohgi, H. Nejo and D. Fujita, Jpn J. Appl. Phys., Part 1, 2001, 40, 3364–3369 CrossRef CAS.
- Y. Yang and K. D. Gillis, J. Gen. Physiol., 2004, 124, 641–651 CrossRef CAS.
- T. Voets, Neuron, 2000, 28, 537–545 CrossRef CAS.
- G. Grynkiewicz, M. Poenie and R. Y. Tsien, J. Biol. Chem., 1985, 260, 3440–3450 CAS.
- K. T. Kawagoe, J. A. Jankowski and R. M. Wightman, Anal. Chem., 1991, 63, 1589–1594 CrossRef CAS.
- T. Xu, M. Naraghi, H. Kang and E. Neher, Biophys. J., 1997, 73, 532–545 CrossRef CAS.
- R. Y. Tsien, Nature, 1981, 290, 527–528 CrossRef CAS.
- M. Haller, C. Heinemann, R. H. Chow, R. Heidelberger and E. Neher, Biophys. J., 1998, 74, 2100–2113 CrossRef CAS.
- T. C. Sudhof, Annu. Rev. Neurosci., 2004, 27, 509–547 CrossRef.
- M. A. Bittner and R. W. Holz, J. Biol.Chem., 1992, 267, 16219–16225 CAS.
- L. von Ruden and E. Neher, Science, 1993, 262, 1061–1065 CrossRef.
- T. Voets, Neuron, 2000, 28, 537–545 CrossRef CAS.
- M. E. Becquerel, Hebd. Seances Acad. Sci., 1839, 9, 561–567 Search PubMed.
- A. J. Bard and M. A. Fox, Acc. Chem. Res., 1995, 28, 141–145 CrossRef CAS.
Footnotes |
| † The HTML version of this article has been enhanced with colour images. |
| ‡ Electronic supplementary information (ESI) available: Process for fabrication of an ITO electrochemical microelectrode array, Fig. S1. See DOI: 10.1039/b715308m |
| This journal is © The Royal Society of Chemistry 2008 |