Analysis of crystalline phases in airborne particulate matter by two-dimensional X-ray diffraction (XRD2)
E.
Bontempi
*a,
D.
Benedetti
a,
A.
Zacco
a,
E.
Pantos
b,
S.
Boniotti
a,
C.
Saletti
a,
P.
Apostoli
c and
L. E.
Depero
a
aLaboratorio di Chimica per le Tecnologie, Università degli Studi di Brescia, Italy. E-mail: elza.bontempi@ing.unibs.it
bDaresbury SRS Laboratory, UK
cDipartimento di Medicina Sperimentale ed Applicata, Università degli Studi di Brescia, Italy
First published on 7th December 2007
Abstract
In this work, the potentiality of two-dimensional X-ray diffraction (XRD2) to characterise aerosol particles collected on commercial glass filters is presented. Indeed, even if routine analysis usually requires only mass determination, and rarely chemical composition, phase determination is fundamental to recognize the primary or secondary origin of the particulate matter and thus to determine the main sources of the pollution and to model contamination events. The experiments were performed at Daresbury Synchrotron (UK) Laboratory on 14.1 Beamline. The analysis of filters collected in Tuscany (Italy) is discussed with particular attention to the presence of arsenic sulfide. The first results of these experiments are very promising, showing the presence of unexpected compounds in the particulate matter of the investigated area.
1. Introduction
Air pollution is an increasing problem in metropolitan areas throughout the world, and large efforts are devoted to understand the origin and to evaluate the diffusion of pollutants. Besides gaseous constituents as nitrogen oxides, sulfur dioxide, and ozone, the particulate matter becomes more and more a factor of concern in air pollution events.1 It principally impacts on human health by triggering several respiratory diseases.2 Besides, environmental effects, low visibility and haze are often related with it. The particulate matter is a complex and varying mixture of small and very small particles, with chemical composition depending on origins and time of being airborne.3 For understanding and modelling, it is critical to distinguish between “primary pollutants”, originated by a specific source, and “secondary pollutants”, formed by a reaction of primary pollutants in the atmosphere.Analyses required by air quality standards often require only the determination of the mass, and possibly the elemental composition of the particulate matter.
Common techniques for the evaluation of chemical elements in atmospheric aerosols are X-ray fluorescence spectrometry (XRF),3,4 inductively coupled plasma emission spectroscopy (ICP),5atomic absorption spectroscopy (AAS)6 and particle induced X-ray emission (PIXE) techniques.
However, to guess the origin of the particulate matter, solely the element composition is not sufficient and phase analysis is necessary to identify the pollution sources and to distinguish between primary and secondary origins. In addition, metallic elements can exist in many different chemical species, and the toxicity is related to the precise nature of the toxic chemical species.
Thus, phase analysis is preliminary to understanding reactivity, transport and removal of atmospheric chemical species and, finally, to model pollution events. In addition, even if any chemical property with poisonous effects has clearly not been identified yet, a possible role of chemical and phase compositions in the toxicity of particulate matter has been suggested.7 For example, in a recent paper8 the difference in the bioreactivity of different metals as a function of their oxidation state is discussed: it was shown that the valence is a key parameter, whereas secondary components (i.e., chlorides, sulfates, nitrates) do not affect metal bioreactivity.
Recently, morphology of the particles has been considered to foresee phase composition and possibly the origin of contaminants.9 However, X-ray diffraction (XRD) should be the first candidate for identifying crystalline phases.10,11 One of the main advantages of XRD analysis is that sample preparation is not necessary and, therefore, inaccuracy arising from extraction procedures is avoided. Another benefit of XRD analysis is that it is not destructive, and thus filters can be used for complementary analyses.
The minor use of XRD in particulate matter studies is mainly because of the low quantity of material on commercial filters, which is not usually sufficient for conventional analysis. Indeed, a small amount of material provides very weak diffraction peaks, while filters usually exhibits a high background in the region where the attended crystalline phases have the most intense reflections. To avoid the background, silver filters can be used.12 Alternatively, the sample must be obtained by treating the filter by different methods, such as dissolution,13 mechanical extraction14,15 or firing.
In view of these possible difficulties in the analysis, “The Compendium of Methods for the Determination of Inorganic Compounds in Ambient Air” provided by the EPA Agency (US Environmental Protection Agency) does not yet suggest XRD as a routine technique in filter analysis.
The aim of this work is to show the potentialities of two-dimensional X-ray diffraction (XRD2) to characterise aerosol particles collected in commonly used filters for routine mass determination. Indeed, by means of XRD2, a large part of the reciprocal space is detected, thus allowing to identify even a small quantity of materials. Phase identification can be done by integration over properly selected angles thus optimising intensity and statistics. This allows the analysis of a small quantity of crystalline phases when only few spots can be detected in the 2D pattern:16 starting from the spot positions (i.e. the interplanar distances), phase identification can be guessed with the help of a crystallographic database.17
To our knowledge, this is the first paper applying XRD2 for phase analysis of particulate matter on commercial glass filters.
2. Experimental
Filters were placed in Principe of Piemonte (Tuscany, Italy) locality.Bidimensional X-ray diffraction experiments were performed on 14.1 Beamline (PX and Fibre Diffraction) at Daresbury Synchrotron (UK) Laboratories.
Analyses have been performed on 200 × 200 µm area with a wavelength of 1.488 Å; the acquisition time was 30 s for each measurement. For each filter, measurements were done in three different positions.
The 2D diffraction images were evaluated by means of Diffrac Plus by Rigaku. This software allows one to obtain peak positions on selected area and permits the integration the 2D image to obtain the corresponding 1D XRD pattern.
3. Results
Fig. 1, 2 and 3 show XRD2 patterns of samples 1, 2, and 3, respectively. Magnifications of some XRD2 images are also reported to enhance isolated spots. For an ideal powder, in the 2D images the diffraction rings (Debye rings) appear continuous. This is because the small grains are oriented in all directions. If the microstructure is quite complex, as for example a phase is formed by quite large crystallites, the rings can appear as highly spotty and discontinuous in their intensities. In the case of the presence of only a small amount of crystallites, only some isolated diffraction spots can be found in the 2D images.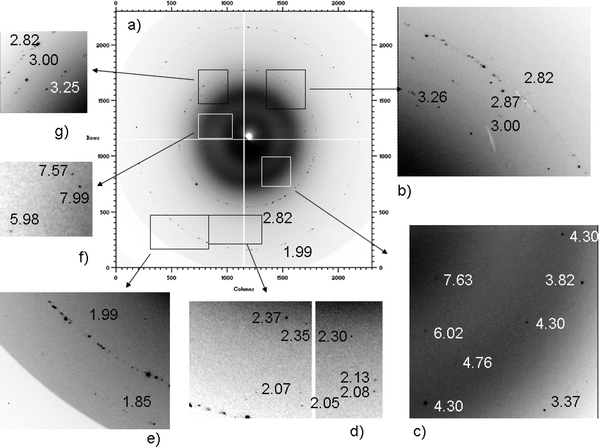 | ||
| Fig. 1 2D diffraction images collected for sample 1, with magnification of different areas. | ||
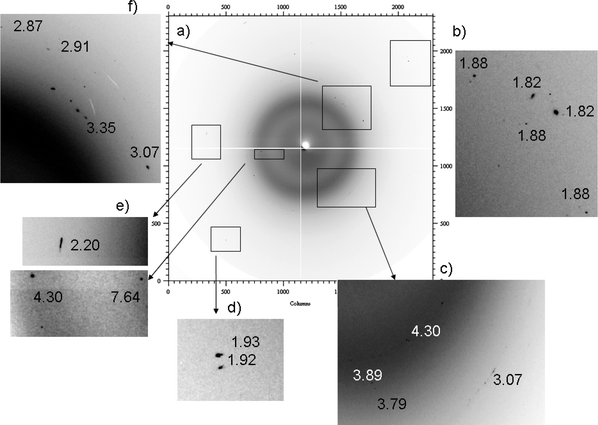 | ||
| Fig. 2 2D diffraction images collected for sample 2, with magnification of different areas. | ||
 | ||
| Fig. 3 2D diffraction images collected for sample 3, with magnification of different areas. | ||
In Fig. 1a, two well defined spotty Debye rings (corresponding to d = 2.82 and 1.99 Å) can be distinguished. They can be attributed to the most intense peaks of sodium chloride. Also, the spots at d = 3.25–3.26 Å in Fig. 1b and 1g can be attributed to the same phase. The two most intense rings of sodium chloride are spotty, but well defined, then the corresponding 1D XRD pattern, obtained by the integration of all 2D images, clearly shows the presence of this phase.
However, the direct analysis of the two-dimensional images allows the identification of several additional spots (Fig. 1b–d, 1f–g). Considering the 1D XRD pattern, only NaCl peaks appear and the strong contribution of the amorphous substrate completely masks other reflections.
Since the spots at about 3.00 and 1.85 Å define similar discontinuous rings, they were tentatively attributed to the same phase, while the other spots should be ascribed to different phase(s). These d values correspond to the most intense reflections of calcite.17 The presence of this phase is expected in the particulate matter since it originates from buildings or from Saharan dust.18
The spots at 7.63, 7.57, 4.30 and 2.87 Å (Fig. 1b and c–f) correspond to the most intense reflections of gypsum, while other spots detected in sample 1 may suggest the presence of clay, iron compounds, and low temperature quartz (see Table 1).
| Sample 1 | |||||||||||||||
| CaSO4·2H2O | (Reference code: 00-033-0311) | ||||||||||||||
| 7.63 | (7.63); | 7.57 | (7.63); | 4.30 | (4.28); | 4.28 | (4.28); | 3.76 | (3.80); | 3.05 | (3.06); | 2.87 | (2.87); | 2.68 | (2.68); |
| 2.49 | (2.49); | 2.22 | (2.22); | 2.10 | (2.09); | 2.07 | (2.07); | 1.91 | (1.90); | 1.90 | (1.90); | 1.89 | (1.90); | 1.88 | (1.88). |
| NaCl | (Reference code: 00-005-0628) | ||||||||||||||
| 3.27 | (3.26); | 3.26 | (3.26); | 3.25 | (3.26); | 2.82 | (2.82); | 1.99 | (1.99). | ||||||
| SiO2 | (Reference code: 01-083-0539) | ||||||||||||||
| 4.27 | (4.26); | 4.25 | (4.26); | 3.35 | (3.35); | 3.33 | (3.35); | 2.45 | (2.46); | 2.29 | (2.28); | 2.26 | (2.24); | 2.12 | (2.13); |
| 1.99 | (1.98); | 1.82 | (1.82); | 1.66 | (1.67). | ||||||||||
| Montmorillonite | (Reference code: 00-029-1499) | ||||||||||||||
| 21.53 | (21.50). | ||||||||||||||
| FeOCl | (Reference code: 00-024-1005) | ||||||||||||||
| 7.99 | (8.00); | 3.44 | (3.42); | 2.55 | (2.53); | 2.37 | (2.36); | 2.35 | (2.36); | 1.89 | (1.89); | 1.82 | (1.81); | 1.66 | (1.64). |
| Fe2(SO4)3 | (Reference code: 00-033-0679) | ||||||||||||||
| 6.02 | (6.01); | 4.40 | (4.38); | 4.09 | (4.12); | 3.66 | (3.70); | 3.59 | (3.60); | 3.00 | (3.00); | 2.98 | (3.00); | 2.72 | (2.75); |
| 2.42 | (2.43); | 2.40 | (2.43); | 2.37 | (2.38); | 2.26 | (2.26); | 2.12 | (2.11); | 1.85 | (1.86); | 1.73 | (1.71); | 1.70 | (1.71). |
| Mg4Al2(OH)12CO3·H2O | (Reference code: 00-051-1528; 00-051-1525*) | ||||||||||||||
| 7.62 | (7.63); | 7.57 | (7.57*); | 3.76 | (3.78, 3.78*); | 2.63 | (2.62*); | 2.59 | (2.60, 2.57*); | 2.55 | (2.53*); | 2.49 | (2.50); | ||
| 2.35 | (2.34); | 2.33 | (2.34); | 2.29 | (2.28*); | 1.99 | (1.99); | 1.93 | (1.93*); | 1.82 | (1.83); | 1.73 | (1.72*). | ||
| Ca(Mn,Fe)Si2O6 | (Reference code: 00-033-0292) | ||||||||||||||
| 3.73 | (3.73); | 3.59 | (3.61); | 3.44 | (3.44); | 3.25 | (3.24); | 3.01 | (3.02); | 2.91 | (2.91) | 2.87 | (2.89); | 2.26 | (2.25); |
| 2.12 | (2.14). | ||||||||||||||
| As2S3 | (Reference code: 00-053-0530) | ||||||||||||||
| 7.47 | (7.47); | 5.98 | (5.98); | 5.00 | (5.07); | 4.76 | (4.78); | 4.40 | (4.44); | 3.91 | (3.98); | 3.87 | (3.85); | 3.82 | (3.85); |
| 3.76 | (3.73); | 3.66 | (3.68, 3.67); | 3.25 | (3.25); | 3.22 | (3.23); | 3.05 | (3.08, 3.05); | 3.00 | (2.99); | 2.94 | (2.90); | ||
| 2.91 | (2.90); | 2.87 | (2.85); | 2.82 | (2.81, 2.78) | 2.72 | (2.76); | 2.55 | (2.54, 2.53); | 2.49 | (2.49, 2.48); | ||||
| 2.40 | (2.39); | 2.37 | (2.37); | 2.35 | (2.36, 2.34); | 2.30 | (2.32); | 2.13 | (2.14); | 2.10 | (2.10); | ||||
| 2.07 | (2.08, 2.07, 2.06, 2.05, 2.03); | 1.99 | (1.98); | 1.95 | (1.96, 1.95); | 1.93 | (1.934, 1.926); | 1.91 | (1.91); | ||||||
| 1.90 | (1.90); | 1.89 | (1.89); | 1.85 | (1.84, 1.87); | 1.82 | (1.82); | 1.73 | (1.74, 1.76). | ||||||
| 7.73°; | 7.54°; | 6.06°; | 4.97°; | 4.88°; | 4.58°; | 4.33°; | 4.22°; | 4.04°; | 3.47°; | 3.37°. | |||||
| Sample 2 | |||||||||||||||
| CaSO4·2H2O | (Reference code: 00-033-0311) | ||||||||||||||
| 7.64 | (7.63); | 4.30 | (4.28); | 4.28 | (4.28); | 3.79 | (3.80); | 3.07 | (3.06); | 3.04 | (3.06); | 2.87 | (2.87); | 2.84 | (2.87); |
| 2.70 | (2.68); | 2.68 | (2.68); | 2.53 | (2.53); | 2.49 | (2.49); | 2.22 | (2.22); | 2.20 | (2.22); | 2.09 | (2.09); | 1.93 | (1.90); |
| 1.88 | (1.88); | 1.85 | (1.88); | 1.80 | (1.81). | ||||||||||
| SiO2 | (Reference code: 01-083-0539) | ||||||||||||||
| 4.25 | (4.26); | 3.35 | (3.35); | 2.46 | (2.46); | 2.28 | (2.28); | 2.24 | (2.24); | 2.13 | (2.13); | 1.82 | (1.82). | ||
| Ca(Mn,Fe)Si2O6 | (Reference code: 00-033-0292) | ||||||||||||||
| 3.49 | (3.44); | 3.24 | (3.24); | 3.04 | (3.02); | 2.91 | (2.91); | 2.87 | (2.89); | 2.24 | (2.25). | ||||
| Mg4Al2(OH)12CO3·H2O | (Reference code: 00-051-1528; 00-051-1525*) | ||||||||||||||
| 7.64 | (7.63); | 7.55 | (7.57*); | 3.79 | (3.78, 3.78*); | 2.57 | (2.60, 2.57*); | 2.49 | (2.50); | 2.28 | (2.28*); | 1.93 | (1.93*); | ||
| 1.83 | (1.83). | ||||||||||||||
| CaCO3 | (Reference code: 00-005-0586) | ||||||||||||||
| 3.04 | (3.03). | ||||||||||||||
| 4.05°; | 3.89°; | 3.85°; | 3.82°; | 3.32°; | 3.20°; | 2.98°. | |||||||||
| Sample 3 | |||||||||||||||
| CaSO4·2H2O | (Reference code: 00-033-0311) | ||||||||||||||
| 7.65 | (7.63); | 7.63 | (7.63); | 4.31 | (4.28); | 4.28 | (4.28); | 3.79 | (3.80); | 3.07 | (3.06); | 3.06 | (3.06); | 3.04 | (3.06); |
| 2.88 | (2.87); | 2.87 | (2.87); | 2.84 | (2.87); | 2.68 | (2.68); | 2.48 | (2.49); | 2.22 | (2.22); | 2.08 | (2.09); | 2.05 | (2.07); |
| 1.90 | (1.90); | 1.88 | (1.88). | ||||||||||||
| NaCl | (Reference code: 00-005-0628) | ||||||||||||||
| 3.27 | (3.26); | 3.25 | (3.26); | 2.82 | (2.82); | 1.99 | (1.99); | 1.96 | (1.99). | ||||||
| SiO2 | (Reference code: 01-083-0539) | ||||||||||||||
| 4.26 | (4.26); | 3.33 | (3.35); | 2.48 | (2.46); | 2.28 | (2.28); | 1.82 | (1.82). | ||||||
| Mg4Al2(OH)12CO3·H2O | (Reference code: 00-051-1528; 00-051-1525*) | ||||||||||||||
| 7.65 | (7.63); | 7.60 | (7.57*); | 3.79 | (3.78, 3.78*); | 3.75 | (3.78, 3.78*); | 2.58 | (2.60, 2.57*); | 2.48 | (2.50); | ||||
| 2.30 | (2.34, 2.28*); | 2.18 | (2.17); | 1.99 | (1.99); | 1.93 | (1.93*); | 1.82 | (1.83); | 1.71 | (1.72*). | ||||
| CaCO3 | (Reference code: 00-005-0586) | ||||||||||||||
| 3.04 | (3.03). | ||||||||||||||
| 7.69°; | 7.50°; | 7.48°; | 7.45°; | 6.04°; | 3.68°; | 3.14°. | |||||||||
In Fig. 1, magnifications of several spots corresponding to the different d spacings (5.98, 4.76, 3.82, 3.25, 3.00, 2.87, 2.82, 2.37, 2.35, 2.30, 2.12, 2.07, 2.05, 1.99, and 1.85 Å) can be attributed to As2S3. Actually, considering the other images collected for the same sample, all the reflections of this phase have been identified.
The spots at 7.64, 4.30, 3.79, 3.07, 2.87, 2.20, 1.93 and 1.88 Å shown in Fig. 2b–f correspond to the gypsum reflections. This phase was identified also in sample 1. Similar results were also obtained for sample 3.
In Table 1, the experimental d spacings are summarised together with the identified crystalline phases, for each sample, considering all together the collected images. Only few spots were not attributed, and in this case supplementary information would be necessary for a reasonable phase attribution.
4. Discussion
Quartz, calcite and gypsum have already been identified by XRD analysis in coarse airborne particulate matter collected by cascade impact sampling.11Quartz particles and clay may be due to the soil contribution, that are suspended in the atmosphere by wind action.
It is well known19 that exposure to quartz can lead to a variety of pulmonary diseases, including silicosis and cancer, depending on the origin of the silica sample or its contact with other chemicals/minerals that can alter the silicon oxide surface.20
Iron compounds are of anthropogenic origin and are due to metallurgical industry.
Gypsum, and, generally speaking, sulfate phases are possibly formed by gas-phase reactions21 and thus are secondary pollution.
Sodium chloride can be considered a typical component of sea spray. Indeed, along the coastal regions seawater is generally found in the atmosphere. Clearly, coastal areas will be the most affected, but sea salt is also found at inland locations.
The most interesting result of this analysis is the identification of As2S3. The presence of arsenic in the air poses a threat to human health due to its toxicity. Recent research has demonstrated that chronic exposures to As significantly increases the risk of skin and other cancers.22
However, arsenic can exist in many chemical forms, and these vary widely in toxicity. It is well recognised that inorganic species are more readily absorbed than the organic ones. In addition, trivalent arsenicals are more toxic than the corresponding pentavalent forms because of greater cellular uptake, much greater ability to bind to sulfhydryl sites of proteins and the greater tendency to form free radicals.23 On the other hand, due to the low solubility of the arsenic containing minerals, the toxic effects of arsenic are time dependent.24 A very recent review paper24 discussing As compounds contaminating water and air, describes in details the metabolic pathways of arsenic, and its biological modes of action.
From these literature works, we can deduce that the possibility to detect arsenic phases in order to understand its toxicity and design effective remedial actions25 is a very promising result.
In spite of several papers reporting the problem of As detection in water26 and soil, only few papers deal with As detection in air.27–29
However, it is well known that Tuscany is one of the most As naturally contaminated areas in Italy,30,31 but the already performed studies concern soil, fluvial sediments and vegetation.
Conclusion
This paper shows that two-dimensional X-ray diffraction (XRD2) can play a role in aerosol studies as a complementary tool to more conventional analysis, in particular, when non-destructive techniques are required. Indeed, XRD2 considerably increases the chance to obtain phase information, because even a few crystallites, unlikely detectable by conventional XRD, can be identified. The main interesting result of this analysis is the presence of an unexpected phase in the air. As a consequence of this research, the additional monitoring of As chemical species in the air appears mandatory for areas that already have contaminated water and soil.Thus, despite the difficulty of obtaining quantitative information, the results obtained by XRD2 are challenging. Improvements of data collection and analysis (achievable through the newest laboratory instruments), as well as the evaluation of possible quantitative information by means of 2D detectors,32 are in progress.
To this purpose, a specific sample loader will be designed to automatically map filters.
Acknowledgements
We are grateful to Prof. Tognotti for kindly providing the samples and for useful discussions. We acknowledge the University of Brescia for the grants supporting Dario Benedetti and Annalisa Zacco.References
- H. J. Lee, Y. Yohsida, B. J. Turpin, P. K. Hopke, R. L. Poirot, P. J. Lioy, J. C. Oxley and J. Air, Waste Manage., 2002, 55, 1186–1205.
- K. M. Mortimer, L. M. Neas, D. W. Dockery, S. Redline and I. B. Tager, Eur. Respir. J., 2002, 19, 699–705 CrossRef CAS.
- M. Schmeling, Spectrochim. Acta, Part B, 2004, 59, 1165–1171 CrossRef.
- K. Moloi, A. Viksna, E. Selin Lindgren and P. Standzenieks, X-Ray Spectrom., 2002, 31, 27 CrossRef CAS.
- N. A. H. Janssen, D. F. Van Manson, K. Van Der Jagt, H. Harssema and G. Hoek, Atmos. Environ., 1997, 31(8), 1185 CrossRef CAS.
- N. Kubilay, S. Yemenicioglu and A. C. Saydam, Mar. Pollut. Bull., 1995, 30(7), 475 CrossRef CAS.
- C. Boman, A. Nordin, D. Boström and M. Öhman, Energy Fuel, 2004, 18, 338–348 CrossRef CAS.
- L. Merolla and R. J. Richards, Exp. Lung Res., 2005, 31(7), 671–683 CrossRef CAS.
- C. M. Romo-Kröger, Powder Technol., 2006, 161, 235–241 CrossRef.
- V. Szilagyi and Z. Hartyani, Microchem. J., 2005, 79, 37–41 CrossRef CAS.
- V. Esteve, J. Rius, L. E. Ochando and J. M. Amigò, Atmos. Environ., 1997, 31, 3963–3967 CrossRef CAS.
- M. Leinen, J. M. Prospero, E. Arnold and M. Blank, J. Geophys. Res., [Atmos.], 1994, 99(D10), 21017–21023 CrossRef.
- W. T. Sturges, R. Harrison and L. A. Barrie, Semi-quantitative X-ray diffraction analysis of size fractionated atmospheric particles, Atmos. Environ., 1988, 23(5), 1083–1098.
- J. Merefield, I. Stone, J. Roberts, J. Jones and J. Barron, Airborne particulate characterization for environmental regulation in Issues in environmental geology: A British perspective, ed. M. R. Bennet and P. Doyle, The Geological Society, 1998, pp. 277–289 Search PubMed.
- E. T. Gómez, T. Sanfeliu and J. Rius and Jordán, Water, Air, Soil Pollut., 2005, 167, 311–330 CrossRef CAS.
- E. Bontempi, M. Gelfi and L. E. Depero, in Research Advances in Chemistry of Materials, ed. R. M. Mohan, Global Research Network, 2003, 21 Search PubMed.
- The International Centre for Diffraction Data (ICDD) Database 2005.
- S. Glavas, Atmos. Environ., 1988, 22, 1050–1511.
- V. Vallyathan, J. F. Mega, X. Shi and N. R. Dalal, Enhanced generation of free radicals from phagocytes induced by mineral dusts, Am. J. Respir. Cell Mol. Biol., 1992, 6, 404–413 Search PubMed.
- K. Donaldson and P. J. A. Borm, The quartz hazard: a variable entity, Ann. Occup. Hyg., 1998, 42, 287–294 CAS.
- Kao and Friedlander, Aereosol Sci. Technol., 1994, 21, 283–293 Search PubMed.
- Agency for Toxic Substances and Disease Registry (ATSDR). Toxicological Profile for Arsenic (Draft). US Public Health Service, US Department of Health and Human Services, Atlanta, GA. 1998.
- K. T. Kitchin and K. Wallace, Toxicol. Appl. Pharmacol., 2005, 206, 66–72 CrossRef CAS.
- S. Tapio and B. Grosche, Mut. Res., 2006, 612, 215–246 Search PubMed.
- J. C. Ng, Environ. Chem., 2005, 2, 146 CrossRef CAS.
- P. T. K. Trang, M. Berg, P. H. Viet, N. Van Mui and J. R. Van Der Meer, Environ. Sci. Technol., 1 Oct 2005, 39(19), 7625–7630 Search PubMed.
- A. B. Schreuder, T. V. Larson, L. Sheppard and C. S. Claiborn, Int. J. Occup. Environ. Health, Apr–Jun 2006, 12(2), 147–153 Search PubMed.
- J. D. Herner, P. G. Green and M. J. Kleeman, Environ. Sci. Technol., 2006, 40, 1925 CrossRef CAS.
- B. K. Mandal and K. T. Suzuki, Talanta, 2002, 58, 201–235 CrossRef CAS.
- F. Baroni, A. Boscagli, L. A. Di Lella, G. Protano and F. Riccobono, J. Geochem. Explor., 2004, 81, 1–14 CrossRef CAS.
- N. Madhavan and V. Subramanian, Curr. Sci., 25 March 2000, 78(6), 702 Search PubMed.
- G. Ning and R. L. Flemming, J. Appl. Crystallogr., 2005, 38, 757–759 CrossRef CAS.
| This journal is © The Royal Society of Chemistry 2008 |