The quality of fiber counts using improved slides with relocatable fields†
Thomas W. S.
Pang
a and
Martin
Harper
b
aRyerson University, School of Public and Occupational Health, Room 249A350, Victoria St., Toronto, ON M5B 2K3, Canada
bNational Institute for Occupational Safety and Health, Exposure Assessment Branch, Health Effects Laboratory Division, 1095 Willowdale Rd. MS-3030, Morgantown, WV 26505, USA
First published on 31st October 2007
Abstract
A parameter based on discrepancies between reported fibers and verified fibers of relocatable slides is shown to be effective in monitoring the quality of airborne fiber counts. Analysts report only the fibers in each field examined. The verified fibers were determined by two experienced analysts, and are here considered as a “true” value. Most of the verified fibers were confirmed by the reported fibers, and the disputed fibers or fiber counting errors were all located and accounted for. In this study, reference (REF) slides were manufactured from proficiency analytical test (PAT) filter samples from the American Industrial Hygiene Association containing chrysotile or amosite. The slides were made using coverglasses bearing a grid pattern to allow accurate re-examinations. These coverglasses are an improved version of those used in previous studies. Seventy-four out of 85 amosite results and 51 out of 60 chrysotile results of REF slides were within their PAT proficiency ranges. When all reported fibers were normalized against their respective verified fibers, the average fiber count was over-estimated for amosite by 38.3% and under-estimated for chrysotile by 30.4%. The error from counting short fibers (sizing-extra) was 82.6% of the extra fibers and accounted for the 38% over-estimation of amosite fibers. For chrysotile fibers, sizing-extra errors were 74.0% of the extra fibers, but by far the larger errors were oversight-missing errors, which were 96.7% of the missing fibers and accounted for the 30% under-estimation of the chrysotile fibers. The discrepancies were found to be linearly related to counting errors as had been noted in a previous study, giving further weight to a proposed score, calculated from the discrepancy parameter (∑D+ + |∑D–|)/VFtotal, for evaluating the proficiencies of analysts. If a proficiency score = 60 is selected, 48 out of 85 amosite results and 17 out of 60 chrysotile results satisfied this criterion in this study. The number of fiber counting errors in this study was larger than could be expected by PAT proficiency criteria. It may be useful to complement existing proficiency test programs with these REF slides. At the end of each proficiency testing round, detailed reports of discrepancies can be provided to participants so that they can improve on their skills in searching and sizing fibers and minimize their counting errors. In addition, the internal quality control program of each laboratory could include counting REF slides regularly by all analysts with control charts of (∑D+/VFtotal), (∑D–/VFtotal), (∑D+ + |∑D–|)/VFtotal and RFtotal/VFtotal maintained to monitor errors, proficiencies and intercounter variations. Ten percent of relocatable slides of routine samples could also be recounted to monitor intracounter variation.
Introduction
The quality of fiber counting is one of the areas of concern highlighted in the NIOSH Roadmap for Asbestos Research.1 Fiber counting is normally performed using phase-contrast light microscopy, which is more mobile, faster, and cheaper than electron microscopy. Fiber counting requires the microscopist to classify objects visible under the microscope according to defined criteria. It has the drawback that not all objects are recognized and classified equally by all microscopists. Even when most of the objects present on a slide are fibers (e.g. American Industrial Hygiene Association (AIHA) asbestos proficiency analytical testing (PAT) samples), there are common errors of missing fine fibers and inaccurate measurement, and thus classification, of others. Since the publication of the phase contrast microscopy method,2–4asbestos fiber exposure data have been accumulated from counting fibers by viewing samples through ordinary coverglasses. The viewing field area selected was defined by the Walton–Beckett circular graticule, which has a diameter of 100 µm.In order for the AIHA asbestos PAT to be as realistic as possible, they are generated from filter-sampling of an asbestos aerosol, either chrysotile or amosite. The filters are distributed to participants, who analyze a small portion of each filter. The analyst calculates the density of fibers per area of filter. There is variation of loading between filters, and of loading across each filter, which adds greatly to the total variation. Thus, using the consensus mean fiber density across all filters gives rise to a very large standard deviation. The standard deviation at times can become so large that it needs to be artificially limited so as to appear rational. The current AIHA asbestos PAT program thus has two drawbacks: a wide range of variation in the reported “true” value, and an inability to determine the real recognition error rate of the analyst, or the source of the errors, and hence it cannot provide feedback to assist in improvement.
Several previous studies of the quality of asbestos fiber counting5,6 have used relocatable reference (REF) slides, which allow accurate re-examination of selected fields of view. In the prior studies involving REF slides, they were prepared with gridded coverglasses that imprinted square relocatable fields on to cleared filter wedges. Although the viewing fields were well defined, the variation of the coating, from 2.5 to 5.0 nm thick, may have affected the fiber images. Because of the effects of the metal coating on the fiber images, widespread adoption of these REF slides may first have required a test of equivalency in order to compare fiber counts obtained from viewing through the gridded coverglasses to those using ordinary coverglasses. Hence, a new gridded coverglass has been designed to overcome the above problem. It consists of two grids of circular viewing fields of 100 µm in diameter and without a metal coating. In each grid, as shown in Fig. 1, there are 14 columns of viewing fields denoted by the alphabet from A to N. Within each column, there are 10 viewing fields denoted by numbers from 1 to 10. Thus, each viewing field is identified. By placing the Walton–Beckett graticule within each viewing field, one proceeds to count the fibers by phase contrast microscopy. Using these new gridded coverglasses, new REF slides were prepared from AIHA amosite and chrysotile asbestos PAT samples, and these were distributed to participants drawn from laboratories currently enrolled in the IHLAP asbestos PAT or in the Asbestos Analytics Registry (AAR) proficiency testing (PT) programs. Laboratories and microscopists were solicited by the AIHA to be volunteer participants. The identities of the participants and their specific results have not been reported to the AIHA or to NIOSH. The purpose of the present study is to evaluate the effectiveness of these new REF slides and to determine whether it is possible to more accurately assess the proficiency of analysts by means of the discrepancy parameter developed in a recent study of Canadian microscopists.7 Two experienced analysts were used to determine the “verified” fibers in the viewing fields of the relocatable slides. Most of the verified fibers were confirmed by the reported fibers, resulting in the average ratio of reported fibers to verified fibers being 1.01 for amosite fibers and 0.776 for chrysotile fibers. The disputed fibers were all located and accounted for, indicating the errors were due to the analysts under test.
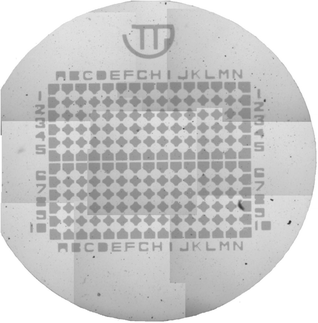 | ||
| Fig. 1 Phase contrast micrograph showing a grid of relocatable fields, photographed originally at 65×. | ||
For each viewing field,
| VF = RF – E + M or RF = VF + E – M |
In a field with RF ≥ VF, RF = RF+, VF = VF+
| D+ = RF+ – VF+ = E+ – M+ = E+ – δ+ |
In a field with RF < VF, RF = RF–, VF = VF–
| D– = RF– – VF– = E– – M– = δ– – M– |
It has been shown that when all designated fields of the slide are summed,7
| RFtotal = VFtotal + Etotal – Mtotal | (1) |
| ∑D+ = Etotal – δtotal | (2) |
| ∑D– = δtotal – Mtotal | (3) |
| ∑D+ + |∑D–| = Etotal + Mtotal – 2δtotal | (4) |
The underestimation of errors by the discrepancies, δtotal, is related to the extra fibers and missing fibers occurring simultaneously in the same fields. If δtotal is relatively small and stable, and with the sum of absolute discrepancies, (∑D+ + |∑D–|), being linearly related to (Etotal + Mtotal) as in eqn (4), then that equation may provide a simplified and cost effective basis assessing the quality of fiber counts on the reference slides and thus the proficiency of analysts. The analysts are only required to report the fibers in each field examined.
Materials and methods
Forty-seven amosite and 33 chrysotile slides were prepared with filters from the AIHA’s PAT program,8 using the dimethyl formamide–Euparal technique.9 The slides had been previously examined by phase contrast microscopy according to NIOSH 7400 “A” counting rules by two experienced analysts and the fibers and their positions were recorded. The slides were then re-examined. Using the fiber records as a reference, the fibers and their positions were relocated and verified. The slides were distributed to analysts in 2006. Each slide was accompanied by the following information: (1) a set of instructions to locate the viewing fields; (2) a list of pre-designated fields to be examined; (3) an example showing the positions and the fibers of the first selected field; and (4) a set of recording sheets for the positions of the fibers in each field. Fig. 2 shows a chrysotile fiber crossing the boundary of a circular viewing field (counted as half a fiber under the “A” rules). | ||
| Fig. 2 Phase contrast micrograph showing a chrysotile fiber crossing the boundary of a circular viewing field, photographed originally at 400×. | ||
Slide examination
Each analyst was required to check the resolution of the microscope according to NIOSH method 74002 before commencing fiber enumeration at 400× and to use the Walton–Beckett graticule to size fibers. The fiber positions were also recorded. “A” counting rules were used. However, in order to help distinguish those missing fibers due to errors in sizing or oversight, analysts were also asked to record and label those fibers that were measured and rejected for being less than 5 µm in length, which would not be done per the published method. It should also be noted that the “A” rules do not have an upper limit on fiber width. This is not a significant issue with the PAT samples, which contain only asbestos, where the majority of fibers will be less than 3 µm in width, but it could be an issue with real-world samples and different counting rules.Results and discussion
Eighty-five amosite fiber counts and 60 chrysotile fiber counts were reported. They were compared with the PAT reference data and their respective verified fibers. Reported fibers and their positions were also evaluated against their respective verified fibers. The errors were catalogued and those fibers that were rejected as less than 5 µm were also compared with the verified fibers. Any verified fibers that were not recorded by the analyst were considered as missing due to oversight. Discrepancies between reported fibers and verified fibers were also calculated.Evaluation of total fiber counts
Tables 1 and 2† show the slide designations, PAT reference values and proficiency ranges, verified fiber counts per number of fields, and fiber densities of amosite and chrysotile slides, as determined at 400×. The verified fiber densities of amosite and chrysotile slides compare well within the PAT proficiency ranges, with the exception that the chrysotile slides #15, #17 and #18 were above the respective upper proficiency ranges. As the PAT proficiency range is set artificially at 20%, for low fiber loadings of 100 f mm–2, the variation may be higher, such that the verified fiber densities of slides #15, #17 and #18 exceed the PAT range.Table 3† shows reported fiber count densities (fibers mm–2) of amosite slides in addition to the number of reported fibers and the ratios to the respective verified values. Seventy-four out of 85 amosite reported fiber counts are within the PAT fiber count density proficiency ranges given in Table 1.† The fiber counts of 10 analysts, #12, #21, #42, #44, #46, #55, #59, #64, #65 and #85 are above their respective upper proficiency range limits and the fiber count of analyst #30 is below the lower proficiency range limit. The ratios of reported fibers : verified fibers (RFtotal : VFtotal) range from 0.714 to 3.785, with a mean of 1.383±0.447. This indicates that the analysts had overestimated amosite fibers by an average of 38.3%. While it is common practice to compare ratios on a logarithmic scale, VFtotal had only small variance, so the use of arithmetic means and standard deviations is justified.
Table 4† shows reported fiber counts of chrysotile slides and the ratios to their respective verified values. Fifty-one out of 60 reported results are within the PAT proficiency ranges given in Table 2.† The fiber counts of #8 and #25 are above their respective upper proficiency ranges and the fiber counts of 7 analysts, #15, #16, #17, #40, #41, #56, and #57, are lower than their respective upper proficiency ranges. The ratios of reported fibers : verified fibers (RFtotal : VFtotal) ranges from 0.128 to 1.290, with a mean of 0.696±0.306. This indicates that the analysts had underestimated chrysotile fibers by an average of 30.4%. Again, VFtotal had only small variance so the use of arithmetic means and standard deviations is justified.
Verified fibers as “true” fibers
In a previous study,6 6 analysts from 6 laboratories analyzed 4 REF slides of amosite fibers, 4 slides of chrysotile fibers and 4 slides of man-made mineral fibers. After comparing fiber records, all disputed fibers were relocated by phase contrast microscopy at 400× magnification. The 6 analysts were able to come to a consensus on each fiber. The fiber counts in that study from the laboratory which determined the “verified” fibers in this study agreed very well with the consensus fiber counts. In the current study, as in the previous Canadian proficiency test study,7 reported fiber records were compared to the verified fibers and disputed fibers were relocated and evaluated. The errors were easily identified, and only in a few instances had the original verified fiber counts had to be adjusted. Therefore, the verified fibers may be considered as consensus fibers or “true” fibers. If necessary, the verified fibers can be analyzed again by other experienced analysts for additional confirmation.Fiber counting errors of amosite slides
Each fiber and its position recorded by analysts were compared with the verified fibers. The REF slides were also re-examined to confirm the fiber counting errors. The errors were expressed in terms of number of fibers and categorized as to cause: sizing, oversight, identification, and recording. Table 5† shows the summaries of errors in analyzing the amosite slides. All errors were normalized by their respective verified fibers. The total number of errors was 0.524 (0.375 due to sizing-extra, 0.020 due to sizing-missing, 0.058 due to oversight-extra, 0.046 due to oversight-missing, 0.004 due to identification-extra, 0.002 due to identification-missing, 0.017 due to recording-extra, and 0.001 due to recording-missing).Consequently, the amosite fibers were over-estimated because of the significant number of extra fibers counted due to sizing errors.
Fiber counting errors of chrysotile slides
Table 6† shows the summaries of errors in analyzing the chrysotile slides. All errors were normalized by their respective verified fibers. The total number of errors was 0.612 (0.114 due to sizing-extra, 0.010 due to sizing-missing, 0.032 due to oversight-extra, 0.443 due to oversight-missing, 0.006 due to identification-extra, 0.002 due to identification-missing, 0.002 due to recording-extra, and 0.002 due to recording-missing). Consequently, the chrysotile fibers were under-estimated because of the significant number of missing fibers due to oversight.Fiber counting variation due to graticule placement
The placement of a Walton–Beckett graticule within the circular field may affect whether fibers are counted or excluded. This may add to the number of oversight-extra and oversight-missing errors. In this study, the average oversight errors of amosite fibers are 0.104 or 19.8% of the total counting errors. The average oversight errors of chrysotile fibers are 0.475 or 77.6% of the total counting errors. In the previous study,1 the field area was defined by a metal coating and the Walton–Beckett graticule would not have any effects on inclusion or exclusion of fibers. The average oversight errors of amosite fibers were 0.071 or 26.0% of the total counting errors of 0.273. The average oversight errors of chrysotile fibers were 0.321 or 74.3% of the total counting errors of 0.432. The small differences of oversight errors relative to the total errors in the two studies indicate that the placement of the Walton–Beckett graticule within the circular viewing field does not seem to add or subtract to the total counting errors.Discrepancies between reported fibers and verified fibers
The positive and negative discrepancies were determined by comparing reported fibers to verified fibers in each field. Tables 7 and 8† list summaries of positive discrepancies, negative discrepancies, and extra and missing fibers in examining the reference slides. For amosite fibers, the total positive discrepancy ranged from 0.030 to 2.785 with a mean of 0.432. The total negative discrepancies ranged from 0 to –0.254 with a mean of –0.047. The average δtotal was 0.022±0.022. For chrysotile fibers, the total positive discrepancy ranged from 0.005 to 0.824 with a mean of 0.107. The total negative discrepancies ranged from –0.004 to –0.936 with a mean of –0.411. The average δtotal was 0.047±0.036.Fig. 3 shows the relationships of eqns (2) and (3) to the positive discrepancies, extra fibers, negative discrepancies and missing fibers. All values are normalized against their respective verified fibers. For amosite fibers, Fig. 3a shows the plots of eqn (2) with δtotal = 0.022, positive discrepancies and extra fibers. Fig. 3b shows the plots of eqn (3) with δtotal = 0.022, negative discrepancies and missing fibers. Similarly, Fig. 3c and Fig. 3d are for chrysotile fibers with δtotal = 0.047. The δtotal values obtained in the present study show excellent agreement with the δtotal for amosite fibers (0.022±0.015) and δtotal for chrysotile fibers (0.045±0.034) of the previous study.1 It is also possible to compare the log-scale mean and standard deviation values of the two data sets with similarly good agreement: chrysotile (present study) –1.521 ± 0.579 vs. –1.521±0.506 (previous study); amosite (present study) –1.997±0.776 vs. –1.950±0.769 (previous study).
 | ||
| Fig. 3 Relatioships of normalized extra fibers, missing fibers, positive discrepancies and negative discrepancies of fiber counts of amosite and chrysotile slides to eqns (2) and (3) with δtotal = 0.022 for amosite fibers and δtotal = 0.047 for chrysotile fibers. | ||
For each type of asbestos, the excellent fit of the positive discrepancies and extra fibers, and the negative discrepancies and missing fibers to their respective linear equations, shows that the δtotal values of the analysts are relatively small and comparable with each other. Consequently, the sum of absolute discrepancies provides a direct measure of total extra and missing fibers, as shown in eqn (4).
Fig. 4 shows the plots of positive and negative discrepancies against major counting errors in examining the REF slides. All values are normalized against their respective verified fibers. For amosite fibers, Fig. 4a shows positive discrepancies having good correlation with size-extra errors (R = 0.97) and poor correlation with oversight-extra errors. Fig. 4b shows negative discrepancies having good correlations with the sum of size-missing and oversight-missing errors with (R = 0.94) and poor correlation with either subcategory. These two plots indicate that for amosite fibers, positive discrepancies are due to the size-extra errors, and negative discrepancies are due to size-missing and oversight-missing errors. For the chrysotile fibers, Fig. 4c shows positive discrepancies having good correlation with size-extra errors (R = 0.96) and poor co-relation with oversight-extra errors. Fig. 4d shows negative discrepancies having good linear correlation oversight-missing errors (R = 0.98) and poor correlation with size-missing errors. These two plots suggest that positive discrepancies are due to size-extra errors, and negative discrepancies are due to oversight-missing errors. Hence, the sum of absolute discrepancies can be used to assess the quality of fiber counts of these reference slides and the proficiency of analysts. The positive and negative discrepancies can each provide indications of the types of fiber counting errors.
 | ||
| Fig. 4 Relationships of normalized discrepancies of amosite and chrysotile fiber counts and their major counting errors. | ||
Although the relocatable REF slides in the previous study were prepared using the older gridded coverglasses and they were analyzed by a different group of analysts, the present study and the previous study7 show many similarities. The same major counting errors were committed, even though there were significantly more counting errors in this study (note that in the Canadian Proficiency Test program, relocatable slides have been in use for some time, while this is the first exposure of most of the AIHA participants; a learning curve was anticipated). The under-estimations of errors by discrepancies, δtotal, in each study agree very well with each other, which is to say that there were relatively few extra fibers or missing fibers occurring simultaneously in the same fields. (Note that for samples with a density of about 250 fibers per mm2 the average number of fibers counted per counting field i.e. in the 100 µm diameter graticule, is 2. Many of the samples used in this study have densities of the order of 100 to 400 fibres mm–2, so the average number of fibers per field is low enough that it is perhaps not surprising that there were relatively few missing fibers and extra fibers occurring on the same fields.) The discrepancies show similar linear relationships with extra fibers, missing fibers and counting errors. Hence, the same proficiency criterion could be used to evaluate and compare the quality of fiber counts of the 2 studies. The criterion of (∑D+ + |∑D–|)/VFtotal ≤ 0.40 is equivalent to a score of 60 according to the following equation.

Proficiency evaluation
The ratio of RFtotal : VFtotal can be shown to give erroneous assessment of the quality of a fiber count, even when Etotal and Mtotal are not available. For example, in Table 8†, the chrysotile results of analyst #59 show that ∑D+/VFtotal = 0.381 and ∑D–/VFtotal = –0.292. The RFtotal : VFtotal was given as 1.088, which does not reflect the actual proficiency of the analyst, where there were 67.3 discrepancies per 100 verified fibers.When the proficiency score of 60 is selected, there were 37 failures out of 85 amosite results, as shown in Table 7.† With these results excluded, the average ratio of reported fibers : verified fibers is 1.113, with an intercounter variation of 0.144. The over-estimation of amosite fibers is reduced to 0.113. Table 8† shows that there are 43 failures out of 60 chrysotile results. With these results excluded, the average ratio of reported fibers : verified fibers is 0.832, with an intercounter variation of 0.096. The underestimation of chrysotile fibers is reduced to 0.168. When those results with scores less than 60 are removed, the remaining ratios of RFtotal : VFtotal of amosite and chrysotile slides lie within the range of 0.60 to 1.40. The REF samples could serve as a diagnostic tool to help analysts or laboratories that are not achieving counts consistent with the reference values in PT schemes.
The present study has a significant number of analysts failing to meet the criterion of (∑D+ + |∑D–|)/VFtotal ≤ 0.40, or the score of 60, in counting amosite and chrysotile fibers. It may be useful to complement existing PT programs with REF slides. At the end of each PT round, detailed reports of discrepancies can be provided to participants so that they can improve on their skills in searching and sizing fibers and minimize their counting errors. In addition, the internal quality control program of each laboratory could include counting REF slides regularly by all analysts and control charts of (∑D+/VFtotal), (∑D–/VFtotal), (∑D+ + |∑D–|)/VFtotal and RFtotal : VFtotal could be maintained to monitor their errors, proficiencies and intercounter variations. Ten percent of relocatable slides of routine samples could also recounted to monitor their intracounter variation.7
Conclusion
A study has been carried out to investigate the use of new relocatable-grid reference (REF) slides in determining the quality of asbestos fiber counting using volunteer laboratories and microscopists participating in the AIHA IHLAP PAT program and AAR. The overall types and proportions of errors found were similar to those found in a previous study, even though that study used an older version of the REF slides and a different study population. However, the overall number of errors in the present population is large, with a number of laboratories or microscopists failing to reach the suggested index for an acceptable standard. However, it must be noted that this is often true in the initial rounds of PT studies. Nevertheless, a greater degree of assurance of quality would be desirable, and could probably be achieved by more routine use of these REF slides.Disclaimer
The findings and conclusions in this report are those of the author(s) and do not necessarily represent the views of the National Institute for Occupational Safety and Health.Appendix
Derivation of eqns (2), (3) and (4)
In a field with a D+,| RF = RF+, VF = VF+, E = E+, M = M+, RF+ ≥ VF+, |
| D+ = RF+ – VF+ = E+ –M+ = E+ – δ+ |
Similarly, in a field with a D–,
| D– = RF– – VF– = E– – M– = δ– – M– |
Also, D– is set at 0 for those fields with RF ≥ VF and D+ is set at 0 for those fields with RF < VF.
Summing all designated fields of the slide,
| Etotal = ∑E+ + ∑E–, Mtotal = ∑M+ + ∑M–, VFtotal = ∑VF+ + ∑VF–, RFtotal = ∑RF+ + ∑RF–, δtotal = ∑δ+ + ∑δ– |
| ∑D+ = ∑RF+ – ∑VF+ = ∑E+ – ∑M+ = ∑E+ – ∑δ+ (since RF ≥ VF) = (Etotal – ∑E–) – ∑δ+ (since Etotal = ∑E+ + ∑E–) = (Etotal – Σδ–)– Σδ+. Since E– = δ– for negative discrepancies, ∑D+ = Etotal – δtotal | (2) |
| ∑D– = ∑RF–– ∑VF– = ∑E– – ∑M– = ∑δ– – ∑M– (since RF < VF) = ∑δ– – (Mtotal –∑M+) (since Mtotal = ∑M+ + ∑M–) = ∑δ– – (Mtotal – ∑δ+). Since M+ = δ+ for positive discrepancies, ∑D– = δtotal – Mtotal | (3) |
| |∑D– | = Mtotal – δtotal |
| ∑D+ + |∑D– | = Etotal + Mtotal – 2δtotal | (4) |
Acknowledgements
The authors would like to thank the American Industrial Hygiene Association and all the analysts who contributed to this study, and also Joe Fernback (NIOSH/DART) and Alan Jones (Institute of Occupational Medicine, Scotland) for their review of this manuscript before journal submission. Funding of this study is provided by the Center for Disease Control and Prevention, National Institute for Occupational Safety and Health (Contract No. 212-2004M-09635).References
- P. Middendorf, R. Zumwalde and R. Castellan, Asbestos and Other Mineral Fibers: A Roadmap for Scientific Research (DRAFT), National Institute for Occupational Safety and Health (NIOSH) Docket No. NIOSH-099 ,http://www.cdc.gov/niosh/review/public/099/ Search PubMed.
- J. Carter, D. Taylor and P. A. Baron, Fibers, Method 7400, Revision #3: 4/15/89, in Manual of Analytical Methods, ed. P. M. Eller, DHHS (NIOSH) Pub. No. 84–100, Cincinnnati, OH, 3rd edn, 1984 Search PubMed.
- Health and Safety Executive (HSE), Asbestos Fibres in Air: Light Microscope Methods for Use with Control of Asbestos at Work Regulations, (HSE MDHS 39/3), London, HSE, 1990 Search PubMed.
- World Health Organization (WHO), Determination of Airborne Fiber Number Concentrations, A Recommended Method, by Phase-Contrast Optical Microscopy (Membrane Filter Method), Geneva, WHO, 1997 Search PubMed.
- T. W. S. Pang, Precision and accuracy of asbestos fiber counting by phase contrast microscopy, Am. Ind. Hyg. Assoc. J., 2000, 61, 529–538 CrossRef CAS.
- M. Harper and A. Bartolucci, Preparation and examination of proposed consensus reference standards for fiber-counting, Am. Ind. Hyg. Assoc. J., 2003, 64, 283–287.
- T. W. S. Pang, A new parameter to evaluate the quality of fiber count data of slides of relocatable fields, J. Occup. Environ. Hyg., 2007, 4, 129–144 Search PubMed.
- C. A. Esche, J. H. Groff, P. C. Schlecht and S. A. Shulman, Laboratory Evaluation and Performance Reports for the Proficiency Analytical Testing (PAT) and Environmental Lead Proficiency Analytical Testing (ELPAT) Programs (DHHS [NIOSH] Publication no. 95–104), Cincinnati, OH, US Department of Health and Human Services, Public Health Service, National Institute for Occupational Safety and Health, 1994 Search PubMed.
- J. M. M. LeGuen and S. Galvin, Clearing and mounting techniques for the evaluation of asbestos fibers by the membrane filter method, Ann. Occup. Hyg., 1981, 28, 273–280 CrossRef.
Footnote |
| † Electronic supplementary information (ESI) available: All tabular information, Tables 1–8. See DOI: 10.1039/b712323j |
| This journal is © The Royal Society of Chemistry 2008 |