Enzyme catalysed biofuel cells
M. J.
Cooney
*a,
V.
Svoboda
a,
C.
Lau
a,
G.
Martin
a and
S. D.
Minteer
*b
aHawaii Natural Energy Institute, University of Hawaii-Manoa, Honolulu, HI, USA. E-mail: mcooney@hawaii.edu
bDepartment of Chemistry, Saint Louis University, St. Louis, MO, USA. E-mail: minteers@slu.edu; Tel: +1-314-977-3624
First published on 19th August 2008
Abstract
Biofuel cells are energy conversion devices that use biocatalysts to convert chemical energy to electrical energy. Over the last decade, research in this area has intensified, especially in the area of direct electron transfer between enzymes and electrodes. This review details the fundamentals of enzymatic biofuel cells and reviews characterization techniques that can be used to evaluate and optimize biofuel cells. The review details the advantages and disadvantages of mediated and direct bioelectrocatalysis at electrodes for biofuel cells. It also compares and contrasts different enzyme immobilization techniques and different electrode structures.
 M. J. Cooney M. J. Cooney | Dr Michael J. Cooney is an Associate Researcher at the Hawaii Natural Energy Institute at the University of Hawaii-Manoa. He came to the University of Hawaii-Manoa in 2001 after being a lecturer at Murdoch University (Australia) from 1997–2000. Dr Cooney is a chemical engineer with expertise in biofilms, biodiesel and biohydrogen production from algae, and biofuel cells. He received his MS and PhD in Chemical Engineering at the University of California-Davis in 1988 and 1992 after receiving his bachelor's degree in chemical engineering at the University of California at San Diego in 1986. |
 S. D. Minteer S. D. Minteer | Dr Shelley D. Minteer received her BS in Chemistry at Western Illinois University in 1995. She then went to the University of Iowa to work on her PhD in Analytical Chemistry. After graduating in 2000, she joined the faculty of the Department of Chemistry at Saint Louis University as an Assistant Professor. At Saint Louis University, her research has focused on the development of biosensor and biofuel cell electrodes. She was promoted to Associate Professor of Chemistry at Saint Louis University in 2005 and Full Professor of Chemistry in 2008. |
1. Introduction to biofuel cells
Biofuel cells are a type of energy conversion device that use biocatalysts (either complete living cells or enzymes) to convert the chemical energy of a fuel into electrical energy. The typical fuels employed in biofuel cells have been glucose, methanol, ethanol, and lactate, but a wide variety of fuels could be used, because living cells have metabolic pathways for oxidizing a wide variety of substrates, including many alcohols, fatty acids, and carbohydrates. Biofuel cells are usually classified on the basis of the type of biocatalyst employed. There are three types of biocatalyst used in biofuel cells: microbes, organelles, and enzymes. Each type of fuel cell has advantages and disadvantages, but the bulk of this review will focus on enzymatic biofuel cells.The first biofuel cell was demonstrated by Potter in 1912.1 This fuel cell used yeast cells at the anode to oxidize glucose. This microbial fuel cell demonstration spawned early interest in biofuel cells, but it wasn't until Kimble's work in the 1960s that people proposed using isolated enzymes at electrode surfaces for energy conversion. In 1964, Kimble and co-workers constructed three different enzymatic bioanodes (one with glucose oxidase, one with amino acid oxidase, and one with alcohol dehydrogenase) and compared three different biofuel cells fabricated from those bioanodes. They were able to generate positive open circuit potentials for the two oxidases in complete biofuel cells2 and so this work started the research area that today we call “enzymatic biofuel cells”.
Over the last 40 years, researchers have been simultaneously developing both microbial and enzymatic fuel cells. Microbial fuel cells have been developed that possess lifetimes of up to five years and many microbial fuel cells can completely oxidize their fuel (typically, lactate or glucose, but some microbial fuel cells employ animal waste and waste water as fuel, while still others scavenge carbohydrates from sandy soils in the ocean and rivers), but have been limited by low current and power densities.3–5 On the other hand, enzymatic fuel cells have been shown to have higher current and power densities, but have been limited by incomplete oxidation of fuel and lower active lifetime. The majority of enzymatic fuel cells in literature employ a single enzyme (i.e. glucose oxidase) to do a one-step/two-electron oxidation of the fuel, but most fuels require multiple enzymes to completely oxidize the fuel to carbon dioxide and to harness all of the energy density of the fuel. Enzymatic fuel cells have also struggled with the problem that enzymes are proteins and proteins have fragile three-dimensional structures that must be maintained for catalytic activity. Although some oxidoreductases (i.e. glucose oxidases for bioanodes, and peroxidases and multi-copper oxidases for the biocathode) have good stability in solution, most dehydrogenase-based biofuel cell enzymes in solution lose their three-dimensional structure or denature in a period of eight hours to three days depending on the stability of the enzyme. Researchers today are focusing on increasing the lifetime and energy density via the employment of enzyme cascades which increase the degree of oxidation of the fuel of enzymatic biofuel cells, improving electron transfer pathways, and novel immobilization methods for increasing the stability of the enzyme at the electrode surface.6
Mediated vs. direct electron transfer
Most oxidoreductase enzymes that have been commonly used in biofuel cells have not been shown to promote the transfer electrons directly between the enzyme and the electrode surface. In this case, many low molecular weight redox active compounds and redox polymers have been incorporated to mediate this electron transfer. This approach is termed mediated electron transfer (MET) and requires that this mediator molecule or polymer participate directly in the catalytic reaction by reacting directly with the enzyme or its cofactor to become oxidized or reduced and then transferring the electrons to/from the electrode surface. Characteristic requirements of mediator species include stability and selectivity of both oxidized and reduced forms of the species and the redox chemistry must be reversible, requiring low overpotential.A major paradigm shift arose from a research focus in the 1970s and 1980s that documented several proteins which are themselves capable of direct electron transfer (DET) via the active site of the protein.7–9 DET occurs through the enzymes or proteins ability to act as a “molecular transducer” that converts a chemical signal directly to an electrical one through the transfer of charge to a stable redox species, which is in turn capable of transferring this charge to another molecule or electrode surface.10 Although there has been a focus on DET for over 20 years, it wasn't until the beginning of this century that researchers started employing direct electron transfer systems at the anode and cathode of biofuel cells.11–16 Current and power densities are traditionally lower for DET systems than MET systems, but they eliminate issues associated with the mediator stability, selectivity, and mass transport at the electrode. Both MET and DET systems will be reviewed in this paper.
2. Mediated electron transfer
Introduction to mediation
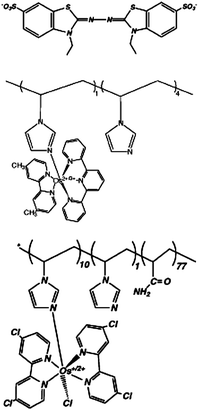
Mediators are redox species with reversible electrochemistry that can transfer electrons between the coenzyme/cofactor of an oxidoreductase enzyme and the electrode (current collector). An example of a mediated electron transfer process at a bioelectrode is shown in Scheme 1. Mediators are usually broken into subclasses of metal-based mediators and organic mediators and further classified as immobilized or solution. Table 1 and Table 2 show common mediators for the anode and cathode.17 ABTS is one of the most common mediators that does not fit into the families of metal-based mediators or azine mediators. ABTS, 2,2′-azinobis-(2-ethylbenzothiazoline-6-sulfate), is a common mediator that is used at the cathode of enzymatic biofuel cells. It has been shown to mediated oxygen reduction with the laccases.18 This mediator (and its derivatives that have been synthesized by Palmore and co-workers) have been widely used for both enzymatic and microbial fuel cell cathodes, but recently Palmore and co-workers have also found strategies for polymerizing these mediators into stable redox polymers that can be used for an air-breathing biocathode as well as traditional biocathodes that consumed dissolved oxygen from buffer solution.19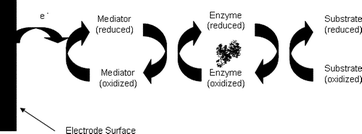 | ||
| Scheme 1 Schematic of a mediated electron transfer-based bioelectrode. | ||
| Compound | Structure | Redox potential/Va | O2 reduction rate/A cm−2a,b | |
|---|---|---|---|---|
| a Potential vs. SHE. b High-surface-area carbon supports in O2-saturated buffer. c Catalysed by bilirubin oxidase in the presence of chloride. d Catalysed by fungal laccase, chloride absent. e Moderate stirring by bubbled gas. f Strong stirring by rotating disk electrode at 4 krpm. | ||||
| 1 | 2,2′-Azinobis(3-ethylbenzothiazoline-6-sulfonate) (ABTS) |

|
0.66, pH 4; 0.72, pH 7 | 5 × 10⁻⁴ (0.43 V, pH 7 phosphate)c,e |
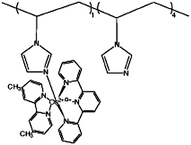
| 2 | Poly{N-vinylimidazole[Os(terpyridine)(4,4′-dimethyl-2,2′-bipyridine)]2+/3+} |
|
0.79, pH 5 | 1 × 10⁻² (0.62 V, pH 5 citrate)d,f |
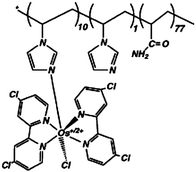
| 3 | Poly{N-vinylimidazole[Os(4,4′-dichloro-2,2′-bipyridine)2Cl]+/2+-co-acrylamide} |
|
0.58, pH 7.4 | 9 × 10⁻³ (0.55 V, pH 7 phosphate)c,f |
| Compound | Structure | Redox potential/V | O2 reduction rate/A cm−2a,b | |
|---|---|---|---|---|
| a Potential vs. SHE. b Glucose concentration 15 mM, 37 °C. c PBS = phosphate buffer solution, typically 20 mM phosphate buffer with 0.1 M NaCl. | ||||
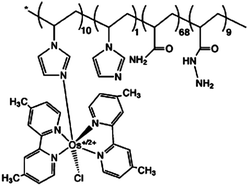
| 4 | Poly{N-vinylimidazole[Os(4,4′-dimethyl-2,2′-bipyridine)2Cl]+/2+-c0-acrylamide} |
|
0.32, pH 5; 0.17, pH 7.2 | 2 × 10⁻⁴ (0.5 V, pH 5 citrate) |
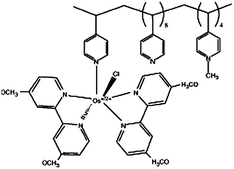
| 5 | Poly{N-vinylimidazole[Os(4,4′-dimethoxy-2,2′-bipyridine)2Cl]+/2+} |
|
0.15, pH 7.4 | 6.5 × 10⁻⁴ (0.37 V, pH 7.4 PBSc) |
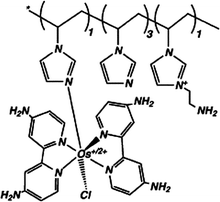
| 6 | Poly{N-vinylimidazole[Os(4,4′-diamino-2,2′-bipyridine)2Cl]+/2+} |
|
0.06, pH 7.4 | 1.7 × 10⁻⁴ (0.22 V, pH 7.4 PBS) |
| 7 | Poly{N-vinylimidazole[Os(N,N′-dialkylated-2,2′-biimidazole)3]2+/3+} |
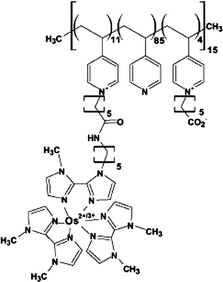
|
0.02, pH 7.2 | 1.1 × 10⁻³ (0.22 V, pH 7.4 PBS); 3.2 × 10⁻⁴ (0.22 V, pH 5 citrate) |
Metal-based mediators
The two most common metal-based mediators are ferrocene-based mediators and osmium complexes. The most common class of mediators in biofuel cells literature are osmium complexes. There are a variety of osmium complexes in the literature and the structure of the complex can tailor the potential and stability of the complex.20–22 Many of these complexes are tethered to polymer backbones to form redox polymers that can be used for electron transfer and/or enzyme immobilization.23 They have been used at both the anode and the cathode of biofuel cells with great success, as is shown in Table 1 and Table 2. The redox potential can be tailored by changing the substituents on the ligands of the complex. The second most common mediators are ferrocene-based mediators. 1,1′-Dicarboxyferrocene,24 ferrocenecarboxylic acid,25,26 and ferrocenemethanol27 have all been used as mediators in bioelectrodes. Ferrocene complexes are a logical choice, because they are thought of as the classical reversible redox couple, although many are not electrochemically reversible. Atanassov and co-workers have used nickelocene as well for mediating electron transfer at a bioelectrode.28 From a strictly structural perspective, it would be assumed that metallocenes and metallocarboranes would be most stable, but the stability of the metallocene is a function of the metallocene and its oxidation state. It is important to note that metallocenes are less easy to tailor redox potentials for than the osmium complexes.Azine mediators
In the case of NAD-dependent dehydrogenases, the enzymes transfer two electrons and one proton to the oxidized form of the cofactor NAD+ and produce, in the process, the reduced form of the cofactor NADH. The formal redox potential of NADH enzyme cofactor is −0.52 V (sat. Ag/AgCl, pH 7), however, its oxidation on a glassy carbon electrode (in the absence of a mediator) requires an overpotential of approximately 1.1 V.29 This well known fact limits the use of NAD-dependent enzymes, in non-mediated systems, for biological fuel cells applications. The discovery that the NADH cofactor could be oxidized at much lower overpotential using azine mediators changed the applicability of NAD-dependent enzymes in such power sources.The basic chemical structure of azine mediators is represented in Fig. 1, where X becomes S for phenothiazines, O for phenoxazines, and N for phenazines. The main mediators of the phenothiazine group are methylene blue, methylene green, azur A, toluidine blue, and thionine. The phenoxazine group includes brilliant cresyl blue, meldola blue, oxazine 170, and nile blue A, while the phenazine group is represented by neutral red, phenazine methosulfate, and riboflavin. The azine mediators have various formal redox potentials and various electrocatalytic reaction rates towards cofactor oxidation. In a systematic analysis of the mediation performance towards oxidation of NADH, Chi and Dong (1996) determined that phenoxazines and phenothiazines demonstrated the best catalytic activity and selectivity, while avoiding electrode fouling, and yielded relatively higher stability as compared to the other azines,31 but did not test it over the thousands of turnovers required for biological fuel cell application. Not all azines, however, are effective mediators. For instance, Torstenssen and Gorton (1981) found phenazine methosulfate to be sensitive to light.32 Azine mediators' oxygen sensitivity is an important characteristic to be examined; however, an in-depth study of this sensitivity has yet to be found in the literature.
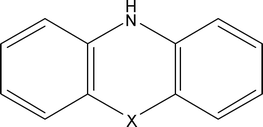 | ||
| Fig. 1 Basic chemical structure of azine mediators. | ||
In general, electrodes modified with azine mediators oxidize NADH cofactor at significantly lower overpotential. It has also been shown experimentally that a slight variation in their chemical structure can influence their electrocatalytic performance. Although not all of the mechanisms are fully understood, an additional electron acceptor group integrated into their aromatic ring substituents facilitates higher electrocatalytic activity. In the case of methylene green, for example, the addition of a nitro group at the 4-position in the aromatic ring, as opposed to methylene blue, has been shown to increase the formal redox potential by 95 mV and increase electrocatalytic activity towards NADH oxidation 2.3 times.31 By contrast, additional ring substitutions with alkyl groups, like in toluidine blue, brilliant cresyl blue or neutral red reduces the electrocatalytic activity.33
| NADH + MG+ ⇄ [NADH·MG+] → NAD+ + MGH |
Chi and Dong (1996) verified the Michaelis–Menten kinetic model of NADH oxidation on a graphite electrode with adsorbed methylene green, and calculated the kinetics constant KM to be 0.88 mmol dm−3.31 Gorton et al. (1985) proposed a more detailed description of the NADH oxidation where M represents the oxidized mediator.38 In this mechanism the formation of complex (I) is followed by a charge transfer in the complex that forms complex (II), wherein the mediator forms anion radical via an electron acceptor group (i.e. which is enhanced by the discussed additional nitro group in the case of methylene green as opposed to methylene blue). The donor group then decreases the complex (II) stability, which then dissociates and enables further reaction steps shown in the scheme.
| [NADH˙+·M˙−] + H2O → NAD˙ + M˙− + H3O+ |
| M˙−+H3O+ → MH˙ + H2O |
| NADH + MH˙ → NAD˙ + MH2 |
| NAD˙ → NAD+ + e− |
| MH2 → M + 2H+ + 2e− |
| NADH → NAD+ + H+ + 2e− |
According to Chi and Dong (1996), azine mediators might show two anodic peaks, of which the peak at the higher anodic potential might correspond to a direct NADH oxidation on the electrode while the peak at the lower anodic potential corresponds to the mediator based NADH oxidation.31 Although the electrocatalysis is more effective in acidic solution, it is required in a neutral solution due to a low stability of NADH at low pH. For some mediators increasing pH above pH 7.0 is problematic, because the direct “non-mediated” NADH oxidation on the electrode might dominate. Chi proposed the following reasons of such phenomenon: (1) proton involvement in the process, (2) poor mediator stability in alkaline solution, (3) re-orientation of adsorbed mediator with pH, and (4) additional but more complex processes. Electrocatalytic activity of azine mediator modified electrodes towards cofactor NADPH is not supposed to vary from cofactor NADH, because phosphorus in NADPH chemical structure is far from the active site. Gorton et al. (1984) reported practically the same cyclic voltammograms of NADH and NADPH oxidation on meldola blue modified graphite electrode.34
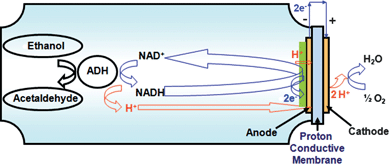 | ||
| Fig. 2 The general scheme of NADH oxidized by an electrode modified with an electropolymerized mediator. | ||
The most common and simple immobilization technique is direct adsorption of the mediator onto the electrode. However, such immobilized mediators generally lack long term stability. For example, Torstensson and Gorton (1981) reported that an adsorbed phenazine methosulfate mediator lost 60% of its activity in two hours when placed in a stirred buffer solution.32 Another approach is the chemical attachment of the mediator to the electrode. Degrand and Miller (1980), for example, synthesized a polymer with hydroquinone functionalities through reaction of dopamine hydrobromide with poly(methacryloyl chloride); a vitreous carbon electrode was then modified with the polymer via a dipping process followed by air-drying.42 The surface coverage of the quinone functionalities, however, was 0.23 nmol cm−2, ten times lower than adsorption and polymerization-based immobilization techniques yielded (data not shown), and the stability of such modification might be also problematic. Because of these limitations, immobilization of azine mediators on electrodes via electropolymerization promises the most practical method for good control and selective modification of electrodes.
The chemical structure of azine mediators influences the ability of the mediators to be electropolymerized. Azines possessing one primary and one tertiary amino group bear the same electropolymerization properties as those azines with only one tertiary amino group, and they cannot be polymerized from strong acidic solution, but must be electropolymerized from neutral or basic aqueous solutions through cyclic voltammetry. Albery et al. (1980) demonstrated that thionine, a very special phenothiazine with two primary amino group ring substituents, could be electropolymerized from an acidic solution through anodic oxidation.43 Lyons et al. (1986) demonstrated successful electropolymerization of methylene blue (two tertiary amino groups) and neutral red (one primary and one tertiary amino group) by anodic oxidation from neutral aqueous solutions.44 Karyakin et al. (1999), in a detail studied electropolymerization of azines, and reported that the growth of electropolymerized methylene blue increased with increasing pH up to a basic solution.45 In their cyclic voltammograms, they showed that the irreversible oxidation of azines with only tertiary amino group substituents (i.e. methylene blue or methylene green) appeared “only” at higher anodic polarization in comparison with other azines. They also concluded that during methylene green electropolymerization the redox potential was shifted by 100 mV in the anodic direction (as compared to methylene blue) due to the additional nitro group of methylene green, which serves as a great electron acceptor. Karyakin et al. (1999) further concluded that a lack of two tertiary amino groups (i.e. meldola blue), which delocalizes the positive charge, reduces the ability of azines to be electropolymerized.45 Mao and Yamamoto (2000) showed electropolymerization of meldola blue from neutral solution via cyclic voltammetry, although the resulting surface coverage in 60 CV cycles was 0.194–0.361 nmol cm−2, which is about ten times lower than that realized for polymerized methylene blue in only 10 CV cycles (data not shown).39 Oxygen heteroatom(s) in the aromatic system of phenoxazines stabilizes the positive charge in the monomer, which shifts the formal redox potential in the cathodic direction, i.e. for oxazine 170 by more than 150 mV, and irreversible oxidation was measured at low polarization of +0.5 V (1 M, Ag/AgCl). Structural differences between toluidine blue, azur A, and brilliant cresyl blue have minimal effect on its electropolymerization and redox potential. The phenazine neutral red has lower redox potential to the others, and the potential of the electropolymerized film and the monomer solution is similar, primarily, because of its structure in which the second heteroatom is also trivalent nitrogen.
Karyakin et al. (1999) compared electrocatalytic rates of electropolymerized azines through RDE analyses and pre-selected the following electropolymerized azine mediators based on the formal redox potential and stability33: toluidine blue, brilliant cresyl blue, azur A, methylene blue, and methylene green. Evaluating the formal redox potential, and the electrocatalytic activity, they also found methylene green to be one of the better electrocatalysts for NADH cofactor among the azines, especially when the mediator is in a polymer form. Despite this wide spread acceptance, there remains a paucity of published reports discussing how the electropolymerization conditions influence the mediators' electrocatalytic activity. To that end, Svoboda et al. (2007) reported an ellipsometric study of an electropolymerized methylene green film grown on a platinum electrode, and defined the polymer film thickness dependence upon the number of cyclic voltammetry deposition cycles.46 In particular, they found 16 CV cycles produced a 36 nm thick polymer film that was homogenous on a microscopic scale and controllable in steps of approximately 2 nm. Their results well demonstrated that electropolymerization through cyclic voltammetry permits super-fine and selective control of the electrode modification. The reproducibility of this approach was further verified when the procedure was duplicated across several laboratories using a standardized modular stack cell.47 In a more in-depth study, Svoboda and Liaw (2008) observed the methylene green electropolymerization process in-situ using a synchronous ellipsometric and quartz crystal microbalance measurement. In this work the authors demonstrated the complexity of the methylene green electropolymerization, showing that electrostatic adsorption, desorption, and series of electrochemical reactions with various limiting mechanisms were involved.48
3. Direct electron transfer
The phenomenon of accelerated electrode processes using proteins in “direct” contact with a conductor element was first observed in the late 1970s for cytochrome c9 on indium oxide7 and mercury51 electrodes, and for the blue copper containing oxidase (laccase).8,52 Later in the 1980s, the direct electron transfer (DET) concept rose to prominence when several enzymes, (e.g. glucose oxidase53) were shown to directly transfer electrons from the enzyme active site to the electrode surface in the absence of mediators. The number of publications about DET accessible redox proteins has dramatically increased (see, for example, the reviews in ref. 10, 52 and 54–60).Direct electron transfer can generally be described as the establishment of a “complex”, formed by the presence of electrocatalytically active enzyme on the electrode/electrolyte interface, that transfers electrical charge (i.e., electrons) from a chemical substrate to a stable redox species which then transfers the charge to another molecule or electrode surface.10,61 In the DET mechanism, the “enzymatic transformation” and the “electrode reaction” cannot be considered as separate reactions, with the electron considered as a “second substrate” that is directly and catalytically transferred from active site to the electrode.10 As described by Marcus,62,63 DET, as an electron tunneling mechanism, depends upon the enzyme structure, specifically the location of the redox center within the protein (usually deep within the protein shell), the enzyme orientation, and finally, exponentially on the electron transfer distance. That being said, an efficient electron flux between redox protein and electrode is only achieved if (i) the active center is close to the protein surface, (ii) the enzyme is oriented with this active site towards the electrode, (iii) the enzyme deforms without activity lost, and (iv) an electron pathway is introduced by a second redox center or by modification.55
Enzyme structures that promote direct electron transfer
There are various types of weak or strong protein–electrode interaction that can be tailored for DET by adapting either the protein or the electrode structure. A short overview about enzyme and electrode structures that promote DET is given below, as well as some examples for DET enzymes usable for biofuel cell applications. Some enzymes are able to directly interact with an electrode, because of short electron tunneling distances. The majority of these are small redox proteins that have metallocenters (e.g. heme, copper or iron–sulfur clusters) in their active site, close to the protein surface.64 So far there is only a small number of DET enzymes known to have only an organic cofactor (flavin adenine dinucleotide (FAD), pyrroloquinoline quinone (PQQ)),64 because the active center is deeply bound in the protein shell causing steric hindrance for DET.10,65Gorton and coworkers64,66 have demonstrated efficient DET for many heme containing redox proteins, including, cytochrome c7 or bifunctional heme-enzymes (i.e., cellobiose dehydrogenase, D-fructose dehydrogenase, and alcohol dehydrogenase).64 Since the heme active site may often be exposed despite being surrounded by peptides,64 the enzyme orientation on the electrode is important for electron tunneling processes. For example, the redox protein cytochrome c has a partially exposed heme group and shows a strong electrochemical signal.7 The most promising analytical effort for DET has been the coupling of cytochrome c with other redox enzymes. Bifunctional heme enzymes combine an organic cofactor which is linked by electron transfer pathway with a heme group.64 The heme group achieves an electron transport from the FAD (e.g. in cellobiose oxidase)67 or PQQ (e.g. in D-fructose dehydrogenase or alcohol dehydrogenase) towards the electrode, as demonstrated on carbon and various metal electrodes.14,64,68
Many of the copper-containing redox enzymes show efficient DET with common electrode materials (carbon, gold, platinum, etc.).58 This is interesting in the context that they are multicopper enzymes (such as ascorbate oxidase, bilirubin oxidase or laccase) which contain all three copper types and therefore complementary copper docking sites that transfer electrons from one site (e.g. electrode contact) to the other side (e.g. substrate reaction).58,69 The direct electron transfer of laccase on carbon electrodes70 and bilirubin oxidase on carbon electrodes71 as well as of laccase and bilirubin oxidase on functionalized MWCNTs has also been shown recently.
Electrode structures that promote direct electron transfer
DET of dissolved enzymes on metal surfaces has been mostly unsuccessful, owing to slow diffusion of large biomolecules and because of significant steric hindrance of the active centers. More, proteins are often denatured by high working potentials at the electrode surface. Successful DET reactions require interactions between electrode surfaces and enzymes that result in a stable protein film, ideally a monolayer. Many efforts have been made to modify electrode surfaces with “promotors”,60 as tailored bridges between electrode and enzyme, that provide transient interaction sites for the proteins without blocking them.60 Lateral interactions between these “promoters” result in self assembled monolayers (SAMs) that result in the desired protein orientation. The structures of those SAMs require an electrode surface binding functional group (usually a molecular structure with a nitrogen, sulfur or phosphorus molecule) that promotes electron transfer by alternating π-electrons and a second functional head group for oriented attachment of the redox protein. In an optimal configuration, the sensor signal is created by the majority of enzymes rather than at random distribution where only a few enzymes contribute the signal.72 In the pioneering work of Hill et al.,73,74 organic adsorbates on gold electrodes were used to stabilize and immobilize small redox proteins, like cytochrome c, through the formation of hydrogen bonds or salt bridges. For example the electrocatalytic reduction of H2O2 by cytochrome c, which shows an anisotropic charge distribution on the protein surface, could be significantly improved if their orientation towards the monolayer surface was “forced” by covalent binding to the SAMs.72 Studies by Armstrong et al.55,60 and Bowden et al.75 also suggested that the orientation of the protein's (i.e. cytochrome c’s) prosthetic group towards the electrode surface increased the rate of DET. If necessary, the electron transfer distance can be tailored by changing the SAM alkyl chain length. Novel methods involving binding co-factors to those alkyls (to assemble enzyme monolayers via direct reconstitution of the apo-protein) have been reported for PQQ/FAD-SAM76,77 or gold nanoparticle/FAD-SAM78 units with reconstituted glucose oxidase. Although a positive effect has been shown for other enzymes, such as plastocyanin or ferredoxins by binding basic SAMs, a negative effect of blocking protein interaction sides by SAMs has often been reported.60,72An alternative but challenging way to contact the enzyme to the electrode is through the use of conductive polymers. As reviewed by several authors,76,79–83 the theory is that the conductive polymers such as polypyrrole,8,84,85 polyaniline, polyacetylene etc., provide electrical conductivity through the provision of an extended backbone of conjugated π-electrons. The technique of entrapping biomolecules into a conductive matrix through the direct electrodeposition of the polymer onto the electrode surface (in the presence of enzyme) has been applied extensively, particularly in biosensing applications. Other conductive matrixes for enzyme entrapment describe the use of sol–gel composites with graphite particles86 or conductive carbon inks.87 However, low sensitivity and low DET rates caused problems for those systems and limited their application.
Rapid and reversible DET can also be achieved by direct contact of enzymes to electrode surfaces. Such interactions require electrostatic compatibility between the electrode and protein shell, which depends upon the solution pH and ionic strength.74 For example pyrolytic graphite surfaces, especially highly oriented edge plane pyrolytic graphite, have various C![[double bond, length as m-dash]](https://www.rsc.org/images/entities/char_e001.gif) O, C–OH and COOH functionality, including hydrophilic and ionic character that show DET with cytochrome c,74 ferredoxin74 or glucose oxidase.88 Glassy carbon electrodes have a similar chemical surface characteristic, so that a quasi-reversible electrochemistry of cytochrome c is possible.74
O, C–OH and COOH functionality, including hydrophilic and ionic character that show DET with cytochrome c,74 ferredoxin74 or glucose oxidase.88 Glassy carbon electrodes have a similar chemical surface characteristic, so that a quasi-reversible electrochemistry of cytochrome c is possible.74
Modifying electrodes with carbon nanotubes (CNTs) shows enhanced electrocatalytic properties. The open ends of CNTs can be considered similar to the structure of a plane graphite edge, with demonstrated activity towards hydrogen peroxide, NADH or dopamine.89 With respect to their bioelectrochemical activity, and their small size, they provide a way for close contact between the enzyme redox center and the electrode surface. To date several approaches have been extensively studied to immobilize enzymes on CNTs. These include covalent binding,90 physical adsorption11,91 or entrapment.92 However successful DET has only been demonstrated in a few cases that used redox proteins with redox centers close to the protein surface, including cytochrome c, azurin,89 and finally glucose oxidase,11,91 whose center is deeply embedded in the protein.
Enzyme-electrode systems for biofuel cell application8,93,94
Compared to microbial fuel cells, the power output from enzyme fuel cells is more efficient; the substrate specific nature of enzymes can also eliminate the need for a membrane separator in a running cell.6 Unfortunately single enzyme systems can only partially oxidize the fuel and (unless immobilized in specialized manner) have limited lifetimes (typically 7–10 days) due to their fragile nature.20,95 Additionally, since most biofuel cells utilize mediators to shuttle electrons between the oxidized fuel to the electrode, mediator lifetimes and diffusion rates also limit overall efficiency. Consequently, the most significant advances in enzymatic biofuel cell research are likely the development of bio-cathodes and bio-anodes that work on DET. Consider, for example, the construction of a glucose biofuel cell using electrically contacted GOx for the anodic oxidation of glucose and a complementary cathodic oxygen reduction by laccase or cytochrome c–cytochrome oxidase.77 Despite this importance, the first mediator free bio-electrodes only appeared in literature in 2002 despite the fact that DET has been extensively studied for several enzymes (largely in biosensor applications) since 1970. In particular, with bio-cathodes for the reduction of oxygen using laccase6 and bilirubin oxidase,96,97 and bio-anodes for oxidation of glucose by glucose oxidase (GOx),98 for oxidation of fructose,14 and for oxidation of hydrogen by hydrogenase.99 Finally, the end goal for enzymatic biofuel cells is to introduce enzyme cascades for a complete biofuel oxidation (ethanol, lactate, pyruvate, glucose) into carbon dioxide based on natural examples of enzymatic cycles and pathway in living systems (i.e. Krebs cycle, glycolysis).64. Electrode structures
2D versus 3D surfaces
The majority of electrochemical cells were initially designed for the cathodic removal of metals from aqueous solutions, although a smaller portion were applied to applications that included the generation of inorganic species, organic synthesis and chloralkali processing.100 The importance of dimensionality in the design of their electrodes though, was already appreciated before enzyme immobilized electrodes became prominent. Enriquez-Granados et al. (1983), for example, described an electrolytic silver recovery cell using three-dimensional electrodes operated under galvanostatic and potentiostatic conditions. In this work the influence of the most important hydrodynamic (electrolyte flow rate and residence time) and electrochemical (current intensity and electrode potential) parameters on the concentration–time relationship and current efficiency were presented.101 The concept of mathematical modeling to describe the behavior of three-dimensional electrodes operating under limiting current conditions also surfaced.102 In principle, these contributions looked at the effect of electrolyte resistivity, hydrodynamic, and cell geometrical parameters on the distribution of the electrolyte potential and overpotential inside the structure.With respect to enzyme electrodes, the early work in biosensors focused on thin two-dimensional electrode films in large part because biosensors, either amperometric ones that operate under an applied potential or potentiometric ones that measured an induce potential, do not need to optimize power production. Rather, they must be selective, reproducible, sensitive, and possess good signal to noise ratio, so that the concentration of the target species can be determined with current or voltage.103 Consequently, the immobilization matrices developed for biosensors were mostly comprised of thin films optimized with respect to (1) electron transfer pathways (e.g., conductive polymers) as measured by cyclic voltammetry,104 (2) retention of enzyme, cofactor, and chemical mediator,41 (3) stability of signal response with time,105 (4) response time and sensitivity,106 (5) selectivity, and (6) the linear increase in signal response with concentration of the measured compound.105 The immobilization matrices were generally fabricated to a defined thickness and in a manner that entrapped and retained an adequate amount of active enzyme, such that the signal response was both reproducible and linearly proportional to the concentration of the target reactant being measured. In most cases the enzyme was accessible only at the film–liquid interface.
While suitable for biosensor development, this design has become recognized as inadequate for power production, a process that requires functional manipulation of the underlying pore structure in order to optimize enzyme loading and spatial distribution of catalyst relative to mass transfer of the reactant to the enzyme active sites. For example, in 1991107 the concept of three-dimensional films was applied to the fabrication of thick film biosensors. Later, the carbon paste methodology for fabricating three-dimensional electrodes was advanced with the introduction of the concept of wiring enzymes to three-dimensional hydrogels of various designs. These systems were (and continue to be) used to support either mediated (e.g., polycationic108) or direct (e.g., osmium containing109) electron transfer. More recently, the use of biocompatible biopolymers such as chitosan have been used to create three dimensional scaffolds that possess a bimodal pore structure: a macropore structure on the order of 30 μm in diameter for fluid transport and a lawn of amphilic mesopores of 10 to 12 nanometres lining the walls of the larger pores into which the enzymes can be entrapped and stabilized (Fig. 3A).110 When compared to air dried thin film electrodes made from the same starting material, the scaffold “version” was shown to increase power density (Fig. 3B). The same system has also been used to create a similar macroporous scaffold, but one possessing a lawn of carbon nanotubes lining the walls of the larger pores, rather than mesopores, to which enzymes can be absorbed or covalently attached (Fig. 3C & D).111 This type of three-dimensional macroporous scaffold structure yielded a much greater active surface area per unit electrode volume, which is a key feature in the development of enzyme electrodes that require improved power density. This last feature was also well documented in a landmark paper that developed three dimensional electrodes by growing carbon nanotubes onto a pre-existing macroporous carbon support.11 This approach demonstrated the ability to efficiently promote DET reactions within a highly porous media, and truly established the concept of designing porous three dimensional electrodes as a standard in the design of enzyme catalysed electrodes. This is particularly significant because until recently, the application of three dimensional architecture, however obviously applicable to enzyme catalysed fuel cells, was confined almost exclusively to more traditional fuel cells.
 | ||
| Fig. 3 Various forms of chitosan scaffolds. A: Typical chitosan scaffold, scale bar 50 μm; B: power curves from glucose dehydrogenase immobilized in chitosan film (lowest), and chitosan scaffolds (higher); C: chitosan–MWCNT scaffolds, scale bar 10 μm; D: chitosan–MWCNT scaffolds, scale bar 1 μm. (MWCNT = multi-walled carbon nanotubes). | ||
Mass transport
Three dimensional electrodes are only valuable if their design supports efficient mass transport. The presence of adequate mass transport permits one to balance the overall effective surface area against porosity, thus ensuring that the maximum number of catalytic sites are available without suffering the blockage of fuel transport, which will occur if the pore size is too small to affect flux of redox species. Moore et al. (2005) employed tetraalkylammonium bromides to alter the micellar structure of Nafion® membranes in order to form more stable Nafion® membranes with larger pore structures,112 but these pore structures still resulted in electrodes that were transport limited. In a related study, Klotzbach et al. (2006) focused on comparing the mass transport and ion-exchange properties of two hydrophobically modified micellar polymers, chitosan and Nafion. It was shown that hydrophobically modified micellar polymers alter the transport properties of redox species to the electrode surface as a function of the size and charge of the redox species.113In the context of flow-through electrodes, however, good mass transport of the liquid phase redox species or substrates through a pore structure, however, is only the first step; once the substrate has diffused to the enzyme surface, it must also cross an additional boundary layer that can also retard mass transfer. The same can be said for the redox species (e.g., NAD+ or NADH) in mediated systems such as those using dehydrogenase enzymes. In these cases, it is important to establish the rate limiting steps in the transfer of electrons from the substrate to the electrode surface and to determine the relevant mass transport and enzyme kinetic rates. Without these values being properly known, optimal design of three dimensional electrode structures cannot be achieved. To this end, process modeling can play an important role because they allow comparison of experimental data against model predictions. Specifically the performance of the electrode is affected both by enzyme kinetics and mass transfer to and throughout the electrode architecture, and that these effects need to be separated during evaluation of the enzymatic electrode when it is placed in a flow-through cell system. In an important first step, Johnston and coworkers (2006) addressed this issue by developing a simple and in situ method to estimate the total activity immobilized enzyme in the absence of mass transfer effects.114 Using a simplified diffusion model, the authors calculated a combined mass transfer parameter including an effective diffusion coefficient that modeled the reactant concentration at the enzyme surface using bulk concentrations, which were then measured in situ by spectrophotometric detection or ex situ by HPLC analysis. This method was used to investigate the performance of two alcohol dehydrogenase electrodes, respectively, based on direct adsorption and entrapment within a conductive polymer. The mass transfer characteristics of the electrodes were estimated by comparison of experimental data against model predictions of system performance in the presence of continuous flow. A combined mass transfer parameter is calculated and the enzyme kinetic parameters were evaluated. One of the key outcomes of the work was that it provided a mechanism to measure the total activity of enzyme immobilized on an electrode with the effects of mass transfer separated. It also provided a lumped mass transfer parameter (M) which combines the contributions of molecular diffusion coefficient, effective surface area, diffusion length, and pore structure on mass transfer through the film. Using this, it could be shown that direct adsorption provided 26 times the activity versus the method of direct entrapment and better mass transfer characteristics. Correlation of these results to scanning electron micrographs suggested that the entrapment method lacked the expected diffusive pathways and most likely expelled enzyme during growth of the film, a result that was in contrast with a bulk of literature on the entrapment method that had never examined the enzyme kinetics in the absence of mass transfer effects.
5. Characterization techniques
The importance of geometry, experimental standardization, and quantization the statistical reproducibility
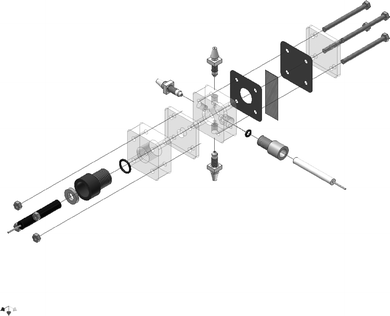
In a recent paper, a standardized testing platform for biological fuel cell research was proposed by Svoboda et al. (2008).47 The apparatus, shown in Fig. 4, is a modular stack cell with defined geometry and dimensions, whilst retaining flexibility in configurations for various electrochemical studies, thereby permitting controlled conditions that avoid ambiguities related to experimental parameters that are often critical but not consistently controlled.The controlled parameters included electrolyte concentration and its volume in the cell, separation distance between electrodes and their position (which significantly affects the electrolyte resistance and shape of the electric field and its distribution). The authors noted that these terms are often overlooked, leading to difficulty in reproducing, comparing and interpreting experimental data among experiments or laboratories. The authors further selected model experiments in which a glassy carbon electrode was modified with methylene green polymer film through electropolymerization across laboratories and reproducibility was evaluated.47 Three levels of statistical evaluation were established to evaluate reproducibility and to indicate sources of irreproducibility with regards to inconsistencies in chemicals, geometry, or electrodes. Using these evaluations, the authors were able to duplicate many complex measurements across several laboratories, and to highlight fundamental causes for lack of reproducibility.
Electrochemical
Electrochemical characterization tools are used extensively at evaluating single bioanodes and biocathodes as well as complete biofuel cells. There are a number of electrochemical methods employed, but voltammetry and polarization curves are the two main techniques to evaluate half-cells (single anodes or cathodes) and complete cells.Spectrophotometric
In the context of biofuel cells, the spectrophotometric detection of enzyme reaction products allow one to quantitate the total amount of bound enzyme that remains active. The measurement can be as simple as placing the immobilized enzyme at the bottom of a cuvette and then monitoring the absorbance change as the appropriate co-factors and substrates are added to the buffer solution above.117 The measurement can also incorporate flow-through systems in which the co-factor and substrates are pumped past the electrode surface and the effluent passes through a flow-through cuvette (Fig. 5).114 While valuable, this measurement does not, however, provide information regarding the amount of either (1) bound enzyme which is electrochemically active, i.e., actively exchanging charge with the electrode support, or (2) reduced mediator that is able to diffuse to and be oxidized at the anode. Only electrochemical measurements (e.g., dynamic potentiometry, DC polarization, and electrochemical impedence spectroscopy) can provide insight into the quantity of electrons transferred. This distinction is important because a biofuel cell can only be as good as its ability to transfer electrons from the substrate to the electrode surface, regardless of how much active enzyme has been immobilized. It is in bridging this gap that spectrophotometry can be a valuable characterization tool.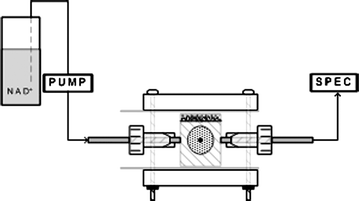 | ||
| Fig. 5 Flow through of substrate and co-factor through an electrochemical half-cell and across an enzyme immobilized electrode surface. | ||
In the case of direct electron transfer, the absence of charge transfer mediators, redox enzyme must form a close physical attachment to the electrode support in order for direct bioelectrocatalysis to occur, and not all enzymes will be suitably placed for such transfer. Hence, when one combines measurements of enzyme capable of charge transfer (DC polarization) with determination of total enzyme loading (spectrophotometric enzyme determination), one is able to determine the efficiency of charge transfer between enzyme and support. Using DC polarization and spectrophotometric detection of methyl viologen, the mediator by product of H2 oxidation by hydrogenase enzyme, Johnston et al. (2005) calculated a charge transfer efficiency of 28 for enzyme immobilized by physical absorption to a packed carbon substrate.115 While not the first such measurement of electrochemical efficiency of bound enzyme,118 it was one of the first to couple the measurement to spectrophotometric detection of co-metabolites, and served to underscore the power of coupling spectrophotometric detection of co-metabolites or redox reaction by-products with electrochemical detection of redox electrode performance.
Fluorescence and microscopy
Within the context of biosensor and biofuel cell development, enzyme immobilization has several important goals: (1) to extend of the enzyme's active lifetime,119 (2) to increase enzyme activity,120 (3) to avoid catalyst loss in flow systems, and (4) to increase enzyme loading.121 That being said, it is noteworthy to consider the contribution that fluorescence measurements can make towards understanding the nature of the enzyme-immobilization material interactions and how they can affect enzyme loading, distribution, stability and lifetime. For example, by monitoring the change in lifetime or the change in the quantum yield of a probe, the use of modified fluorophores has been used in the development of calcium and blood glucose sensors.122,123 pH sensitive fluorophores, such as hydroxycoumarin, have also been used to determine the local pH in lipids and micelles,124 and the intrinsic fluorescence associated with protein tryptophan residues has been used to investigate their local environment.125 Understanding the nature and dynamics of these interactions has improved our understanding of how enzyme–polymer interactions affect the immobilization process.Measuring the fluorescence polarization of a probe can therefore yield information about the system's chemical microenvironment. For example, there exists a variety of commercially available fluorophores that vary in terms of their sensitivity to pH (e.g. the SNARF problems) or degree of hydrophobicity or hydrophilicity (e.g. nile red). Konash et al. (2006) used fluorescence to characterize the interaction between charged Eastman AQ55 and alcohol dehydrogenase. Using Alexa 488 tagged to the enzyme, they predicted that the interaction was largely ionic, that the placement of a charged fluorophore on an enzyme would not alter the enzyme's natural distribution pattern, and the distribution of alcohol dehydrogenase in drying Eastman AQ55 films was largely limited to cylindrical columns that formed as the polymer dried (Fig. 6).126 The authors surmised that as the Eastman AQ55 dried, the water separated from the polymer phase, taking with it the tagged enzymes. Recently, we have used the fluorescent properties of the fluorophore 1,8-anilinonapthalene (ANS) to visually and spectrophotometrically verify the chemical modification of chitosan polymer with hydrophobic side groups (Fig. 7). In the image, the emission spectra of chitosan polymer that was both unmodified and modified with butyl and octyl alkane side chains is presented. Clearly only the chitosan that was modified with hydrophobic side chains shows a visible emission intensity, verifying that the polymer has been made more hydrophobic. Also indicated, is a blue shift in the fluorescence from 520 to ∼475nm is as expected for more ANS in more hydrophobic environments, and that the shift is even more pronounced for the octyl (as opposed to butyl) modified chitosan. Images taken from a laser scanning confocal microscope using the probe nile red has been used by the authors to demonstrate this blue shift in scaffolds made from the unmodified and modified chitosan (data not shown).
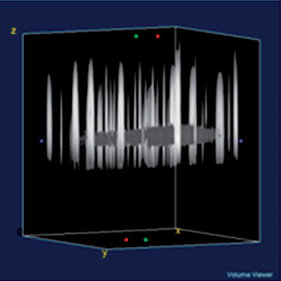 | ||
| Fig. 6 3D spatial distribution of Alexa 488 labeled alcohol dehydrogenase in air dried Eastman AQ55 films. | ||
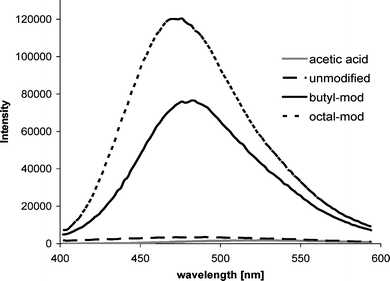 | ||
| Fig. 7 Emission spectrum of 50μL of ANS added to 1 mL of acetic acid, unmodified chitosan, butyl-modified chitosan, and octal-modified chitosan. | ||
In the context of characterizing immobilization polymers, it has also proven useful to look at fluorescence techniques such as steady state polarization. As reviewed by Jameson and Croney (2003), polarization provides information on the rotational motility of a fluorescent molecule.127 A free fluorophore in buffer will have a characteristic rotational rate associated with the lifetime and rotational relaxation time of the probe. When the free fluorophore solution is titrated with a polymer, a change in the steady state polarization will indicate a “rotation inhibiting” interaction occurring between the polymer and the probe. In our work, we have used this fact to demonstrate an interaction between chitosan (a cationic polymer), and fluorescein (an anionic fluorophore) (Fig. 8). At a ratio of 40 μM of chitosan : 10 nM of fluorescein, the probe is completely bound. This is useful is describing the ability of probe to interact with a polymer.
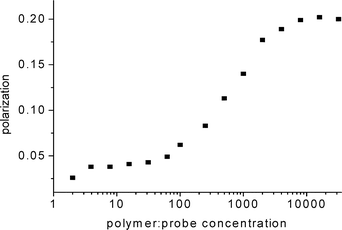 | ||
| Fig. 8 Polarization as a function of probe : polymer concentration, specifically fluorescein in the presence of chitosan polymer(aq). | ||
The visualization of a three-dimensional polymer scaffold geometry can be investigated using fluorescence. In our lab we have stained chitosan polymer scaffolds with fluorescein to image their three-dimensional structure using laser scanning confocal microscopy. Fig. 9 shows an image of the pore structure of a chitosan scaffold stained with fluorescein as a function of height through the scaffold. This useful technique permits the non-invasive viewing of 3D pore structure of materials used to make porous electrodes.
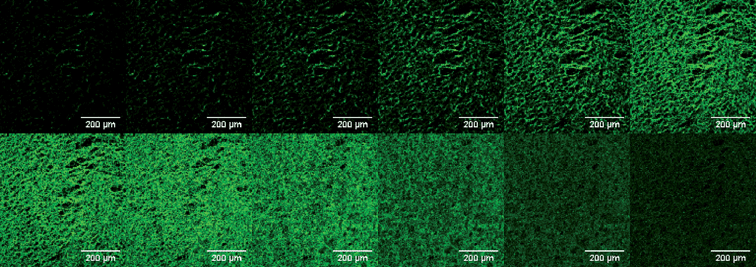 | ||
| Fig. 9 Confocal laser scanning microscope slices (1 μm in z direction) of a freeze-dried chitosan scaffold stained with fluorescein. | ||
The application of fluorescence techniques to more complex systems is also well documented. Time-resolved fluorescence techniques such as anisotropy decay and fluorescence lifetime decay have been extensively used in both biophysical and biochemical research, and there are several books128 and reviews127,129 on the topic of steady-state and time resolved fluorescence techniques. For the sake of brevity, we will make mention of a select few studies pertaining to polymer and enzyme characterization. Significant work has also been done using fluorophores to characterize macromolecular dynamics in polymers.130–133 For example, by chemically modifying the polymer chain, introducing pyrene derivative to the end structures, Winnik measured a change in the fluorescence emission spectra. The author claimed that this measured change could be used to infer the cyclization of polymer chains.132
In the field of enzyme immobilization, the interaction between the enzyme of question and its immobilization environment is also of interest. As shown in the few examples, above, the uses of fluorescence provides a unique tool for probing these environments in situ, as was established early on in the study of Laurence (1952) who studied enzyme-fluorophore complexes to characterize enzyme dynamics.134–136 Jameson and Hazzlett137 stated that if a probe is attached to an enzyme, and the tagged enzyme solution is placed in an environment to be investigated, the fluorophore can be used as a reporter to examine the interaction of the enzyme with its environment. More sophisticated methods such as fluorescence correlation spectroscopy (FCS), originally developed by Magde et. al.,138 permit one to measure the fluctuations in fluorescence within a small defined volume (<1 fL). Using raster imaging correlation spectroscopy (RICS), measurements of a labeled enzyme in varying environments has also been used to determine the diffusion coefficient of an enzyme, the state of aggregation of the protein, as well as local concentrations.139–141 The use of fluorescence resonance energy transfer (FRET), also known as Förster resonance energy transfer,142 has also been used to determine the distance between molecules. This technique, widely used in biochemistry and cell biology, relies on the transfer of excitation energy from a fluorescence donor to receptor.143 The measured decrease in the fluorescence quantum yield and lifetime of the donor molecule, and the subsequent increase in the acceptor molecule allow for a “measurement” of distance within a system. The obvious future application in a multi-enzyme fuel cell would be to use this technique to determine the relative spacing between multiple enzymes. Banta and coworkers, for example, have used FRET efficiencies to estimate the average spacing of fluorescent proteins within hydrogels using measurement of FRET efficiencies.144 More specifically, they have used this technique to independently tune the strength of the gels and the average spacing of the fluorophores within the gel.
Early methods of pore structure analysis were necessarily model based.145 Perhaps the first used were the Langmuir and BET isotherms which related the amount of adsorbate on an adsorbent, as a function of pressure (if gas) or concentration (if liquid). By the early 1960s, the BET method was the standard against which researchers compared alternative methods to compute pore distribution curves from desorption isotherms (largely using nitrogen).146 In perhaps one of the earliest reported investigation on pore structure of gas diffusion electrodes, Darby (1965) used four different models to analysis porous gas-diffusion electrodes, using the resulting current density-polarization characteristics as the data to which model predictions would be predicted.145 Various polarization curves were measured and these results were used to show, for a given generalized reaction mechanism, that the resulting slopes and intercepts of the linear region, as well as limiting currents, depended upon the assumed degree of coupling between diffusion and reaction mechanisms. This approach, like others that used other measurements (for example, the frequency response characteristics of flow of gas through porous media), was based on model prediction. A pore structure would be assumed and the manner in which it affected a measurable parameter, in this case polarization curves and limiting currents, would be modeled and plotted. By the late 1960s, it became accepted that these methods were, at best, based on idealized models for the pore shapes. Most assumed that the pores were cylindrical, some used the parallel plate pore model, but the extent to which valid inferences could be drawn from the structure curves based on such idealizations started to be questioned, and the requisite model modifications evolved.
Because the experimentally verified model approach has its limitations, the need for physical measurements emerged. As early as 1952, the BET theory, widely used in surface science for the calculation of surface areas of solids by physical adsorption of gas molecules,147 was used to measure the surface area of silica gels of differing average pore radius and volume.148 More, the adsorption and desorption isotherms of nitrogen, as well as alternatives that employed capillary condensation to regard the region in which the adsorption and desorption isotherms differ from each other, were also used for determination of the pore structures of adsorbents, catalysts, and other porous solids.149 On the basis of analysis of adsorption and capillary phenomena occurring in adsorbent pores, a rational classification of pore varieties in terms of the basic structural terms used today (macroporous, transitional-pore (i.e., mesoporous), and microporous) evolved.150
Specialized analytical instrumentation has also played a significant role in pore structure analysis. In the early 1960s, a simple flow method was developed for the determination of adsorption isotherms of high surface area solids with nitrogen that controlled the pressure drop across a fine capillary in such a way that the flow rate was measurably independent of back pressure.151 Comparisons of surface areas using silica-alumina samples as a reference showed excellent agreement; areas from pore size distributions obtained by BET calculations. These initial works lead to increased use of pressure driven flow into pores as a mechanism to estimate pore size and pore size distribution has increased dramatically. In particular, the non-wetting fluid mercury has been the fluid of choice; in this regard, although it has fallen out of favor recently due to strict environmental regulations. In principle, the fluid is forced to enter into the pores by application of a stepwise controlled increase in pressure. With each increase in pressure, more mercury penetrates and this is assumed to equate to the pore volume filled with mercury at that pressure. The distribution of pore size as well as the total porosity, bulk and apparent density and the specific pore volume can be obtained by the relationship between the pressure necessary for penetration (the pore dimension) and the volume of penetrated mercury (pore volume), and the Washburn equation, which directly relates the penetration pressure to the pore access size. In recent years, advances in micro-instrumentation has led to the commercialization of flow porosimeters.152 These instruments, which avoid the use of mercury, operate essentially like the original gas flow methods in the 1960s but have been adapted for liquids and essentially designed to characterize pore structure in the direction of the fluid flow.153 Unlike traditional mercury porosimetry, the fluid is applied on only one side of the sample, and the pressure increased stepwise until the fluid flows through the pores. Models are then used to estimate characteristics such as the limiting pore diameter and the percentage of blind pores (i.e., pores that are not open at both ends and therefore do not allow fluid flow). If the sample is compressible then in all likelihood the sample measurement is not realistic and the samples are also destroyed in the process, negating any further analysis.
Non invasive techniques have also been proposed. Razouk et al. (1967) used X-ray analysis and differential thermal analysis to measure the surface area and pore structure of mixed hydroxides and oxides of magnesium and iron.154 With the advances in software analysis, X-ray technology has advanced remarkably, in terms of internal 3D pore structure analysis, providing a unique ability to non-invasively image the internal pore boundaries of samples, and to estimate the degree of interconnectivity between pores.155 Largely developed for the non-destructive micro-computed tomographic imaging of scaffold–bone interaction in vivo,156 its application to analysis of carbon granules pore structure has been reported.157 As noted in this study, it is important to note that the non-invasive imaging techniques can reveal a much different pore structure than can be measured using the pressure intrusion technique. In their work, Farber et al. (2003) compared the pore size distributions determined from tomographic images against mercury porosimetry and found that mercury intrusion measured the pore neck size distribution, while the tomography measured the true size distribution of pores ca. 4 μm or larger (the instrument resolution). Optical imaging has also been used as a non-invasive technique. Huber and Gaugler (1948) used electron photomicrographs to show that protective oxide coatings produced electrolytically on aluminum possessed a pore structure closely similar to that of an ideal “columnar mixture” of Wiener, and used this data to attempt to compute the pore volume using Wiener's theory.158 We were unable to find another presentation on microscopic analysis of pore structure (the great bulk of literature appears dedicated to biology applications) until the work by Piekarczyk and Pampuch in 1976 who investigated the relative merits of optical microscopic methods in study of the pore structure of some ceramic materials (mainly graphite).159 Perhaps more noteworthy they compared their results against “intrusion” type methods such as apparent and true density measurements as well as mercury high-pressure porosimetry. This was an important comparison because they made the key link between correlating pore size distribution estimated from a single cross sectional image versus a method that penetrated the entire material. They also discussed a very early application of image based software analysis using computers to help pore analysis with the computer, an approach that is routinely used (by the authors) today (Fig. 10).111,160 Finally, an impressive new addition to software assisted optical imaging is three dimensional laser scanning confocal microscopy. This technique bridges the gap between traditional scanning electron microscopy, which delivers high resolution surface images in 2D, and the confocal laser scanning microscope, which can obtain a series of stacked 2D images that are superimposed into a 3D image using software (Fig. 11).
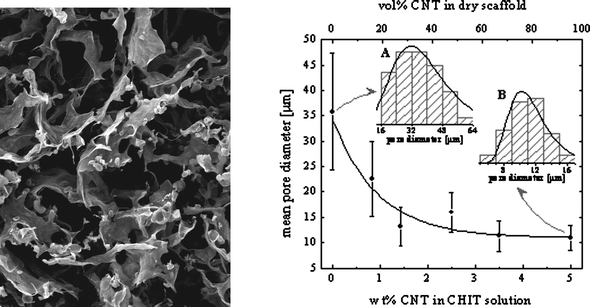 | ||
| Fig. 10 SEM image of a conductive chitosan–carbon nanotube composite used an electrode material (A) and the corresponding pore size distribution analysis calculated through software assisted pore size analysis (B). | ||
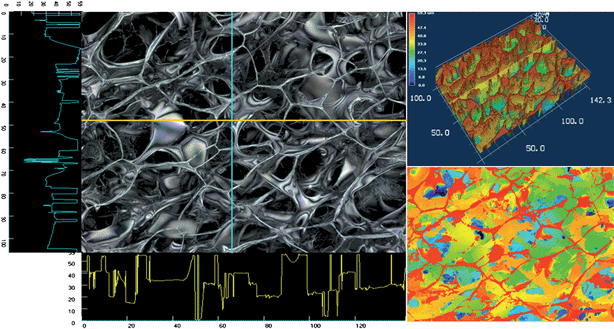 | ||
| Fig. 11 Three dimensional laser scanning images of a porous chitosan scaffold taken with the Keyence 3D laser scanning microscope. | ||
Despite activity in this field since the early 1950s, there remains no single characterization method for pore structure analysis. And all of the methods, however accurate or limited, will measure very specific features of a pore, and will lead to inaccurate conclusions if the basis of the measurement techniques, and its limitations, are not clearly understood by the user. In many cases, multiple measurement techniques will be required to extensively characterize the pore structure.
6. Enzyme lifetime and retention
There are typically five strategies for immobilizing enzymes at electrode surfaces: adsorption, microencapsulation, entrapment, crosslinking, and covalent binding. Each technique affects the enzyme lifetime, retention, and enzyme catalytic activity differently as a function of the effects of the technique on the chemical and physical microenvironment of the enzyme.Adsorption is generally considered the mildest of enzyme immobilization techniques, whereby the enzyme is allowed to adsorb directly on the electrode surface. The adsorption process typically leaves the enzyme in a similar chemical (buffer) environment, but the adsorption process can decrease the enzyme's ability to move and therefore undergo catalysis. Adsorption is a weak intermolecular interaction that tends to lead to enzyme leaching problems with time and sometimes the adsorption on bare metal electrodes results in the denaturing of the enzyme.
Covalent binding is similar to adsorption in that it is used for monolayer coverage of enzyme on an electrode surface, but the covalent bond between the enzyme and the electrode increases the retention of the enzyme, so enzyme leaching is not a problem. However, the chemical binding of enzyme to electrode frequently leads to a decrease in enzyme stability and activity due to the chemistry altering the three-dimensional structure or limiting the enzyme's ability for the internal movement required to catalyse the reactions.
Crosslinking the enzyme to the electrode with a crosslinker such as glutaraldehyde or EDC typically increases the enzyme stability by forcibly restricting the enzyme to its natural three-dimensional structure, but typically this kind of “forced” restriction decreases enzyme activity, because it decreases the ability of the enzyme to move between reactant and product configurations.
Entrapment is the process of mixing enzyme into a polymer whereby the polymer will physically inhibit the diffusion of enzyme from the electrode, thereby, decreasing but typically not eliminating enzyme leaching from the electrode. Depending on the polymer, activity can be maintained and stability can be increased several-fold.
Microencapsulation is an immobilization technique whereby the enzymes are incorporated into three-dimensionally constrained aggregates. In the 1970s, the research discipline of micellar enzymology emerged.161,162 This research area showed that the use of micelles for enzyme encapsulation could increase the activity of enzymes compared to water or buffer (this is commonly refered to as “superactivity” and has been demonstrated for a variety of enzymes including peroxidase (100-fold increase kcat162) and laccase (60-fold increase in kcat163)—two oxidoreductases used in biofuel cells). Micelles have also been shown to increase long term stability, temperature stability, and pH stability. Researchers have spent 30 years studying how size, hydrophobicity, ionic properties, counterions, and solvents affect activity and stability. It wasn't until this decade that researchers started using micellar polymers to immobilize enzymes at electrode surfaces.113, 120 Although leaching can be decreased and enzyme stability and activity can be increased by microencapsulation in micellar polymers, mass transport through the polymer is slow, so current densities are typically limited by the diffusion of substrates within the micellar polymer.
What chemical factors improve enzyme lifetime
Micellar enzymology typically separates enzymes into two classes: hydrophilic enzymes that tend to operate and orientate in aqueous, hydrophilic regions and surface-active enzymes that tend to interact with micellar interfaces possessing both hydrophobic and hydrophilic regions.164 Clearly, the chemical factors resulting in increased enzyme stability are different for each class of enzymes. For hydrophilic enzymes, it has been shown that micelles can be ideal systems because they resemble the microenvironment found in cells (micropools of water lined by an amphiphile).165,166 Research has shown that if the size of the protein and the size of the waterpool (micellar structure) are similar, then the structure and microenvironment should resemble the environment of the cytosol better than a buffered aqueous environment.167 Surface-active enzymes that typically interact with membranes find an optimal microenvironment in a micelle when the hydrophobic-hydrophilic balance is similar to the cellular membrane the enzyme typically associates with in vivo.168 In this case, the size, length, and geometry of the amphiphile, the pH environment, and the degree of counterion binding (ionic properties) can all affect the stability and activity of the enzyme.What physical factors improve enzyme lifetime
The physical factors affecting enzyme activity and lifetime are typically the number of bonds between enzyme and electrode, inter-enzyme bonds, and intra-enzyme bonds, along with the nature of the bonds (covalent vs. non-covalent) and the degree of confinement of the enzyme.169 Three-dimensional confinement in sol-gels has been shown to increase enzyme stability 50–100 times.170 Intramolecular and intermolecular crosslinking, covalent bonding, and physical adsorption decrease the degrees of freedom of the enzyme to denature and therefore increasing long term stability and thermostability.171 However, this approach often decreases enzyme activity, because this confinement decreases the ability of the enzyme to have conformational changes during the catalytic reaction.In examining enzyme immobilization techniques employed in biofuel cells in literature, three strategies are most prevalent. Covalent linking of enzyme to electrode surfaces,116,172 entrapment in sol–gels and hydrogels (frequently in “wired” schematics where mediated electron transfer is built into the polymer modified electrode),170,173–175 and microencapsulation in micellar polymers.113,120 There are advantages and disadvantages to each type of enzyme immobilization. Covalent linking to electrode surfaces, for example, limits current density due to the obvious limitation of only a monolayer coverage of enzyme. This may be sufficient for sensing applications, but will probably not be sufficient for power generation. These researchers propose developing polymers with bi-modal pore distribution that will allow for microencapsulation of the enzyme in micellar structures while also allowing for large macropores like those found in sol–gels and hydrogels, thus profiting from facile mass transport.
References
- M. C. Potter, Proc. R. Soc. London, Ser. B, 1912, 84, 260 CAS.
- A. T. Yahiro, S. M. Lee and D. O. Kimble, Biochim. Biophys. Acta, 1964, 88, 375 CrossRef CAS.
- B. Logan, B. Min, J. Kim, J. Heilmann, S. Ohand H. Liu, 78th Technical Exhibition & Conference, Water Environment Federation, Alexandria, VA, 2005, p. 93 Search PubMed.
- Y. F. Choo, J. Lee, I. S. Chang and B. H. Kim, J. Microbiol. Biotechnol., 2006, 16, 1481 CAS.
- D. R. Lovely, Microbe, 2006, 1, 323 Search PubMed.
- S. D. Minteer, B. Y. Liaw and M. J. Cooney, Curr. Opin. Biotechnol., 2007, 18, 228 CrossRef CAS.
- P. Yeh and T. Kuwana, Chem. Lett., 1977, 6, 1145 CrossRef.
- I. V. Berezin, V. A. Bogdanovskaya, S. D. Varfolomeev, M. R. Tarasevich and A. I. Yaropolov, Dokl. Akad. Nauk USSR, 1978, 240, 615 CAS.
- M. J. Eddowes and H. A. O. Hill, J. Chem. Soc., Chem. Commun., 1977, 1977, 771 Search PubMed.
- A. L. Ghindilis, P. Atanasov and E. Wilkins, Electroanalysis, 1997, 9, 661 CAS.
- D. Ivnitski, B. Branch, P. Atanassov and C. Apblett, Electrochem. Commun., 2006, 8, 1204 CrossRef CAS.
- R. Duma and S. D. Minteer, Polym. Mater. Sci. Eng., 2006, 94, 592 CAS.
- F. Tasca, L. Gorton, W. Harreither, D. Haltrich, R. Ludwig and G. Noll, J. Phys. Chem. C, 2008, 112, 9956 CrossRef CAS.
- Y. Kamitaka, S. Tsujimura, N. Setoyama, T. Kajino and K. Kano, Phys. Chem. Chem. Phys., 2007, 9, 1793 RSC.
- J. Okuda, T. Yamazaki, M. Fukasawa, N. Kakehi and K. Sode, Anal. Lett., 2007, 40, 431 CrossRef CAS.
- Y. Yan, W. Zheng, L. Su and L. Mao, Adv. Mater., 2006, 18, 2639 CrossRef CAS.
- S. Calabrese-Barton, J. Gallaway and P. Atanassov, Chem. Rev., 2004, 104, 4867 CrossRef CAS.
- G. T. R. Palmore and H.-H. Kim, J. Electroanal. Chem., 1999, 464, 110 CrossRef CAS.
- J. Fei and G. T. R. Palmore, Proceedings of the Organic Chemical Division, American Chemical Society, Washington DC, 2005 Search PubMed.
- S. C. Barton, J. Gallaway and P. Atanassov, Chem. Rev., 2004, 104, 4867 CrossRef CAS.
- F. Barriere, Y. Ferry, D. Rochefort and D. Leech, Electrochem. Commun., 2004, 6, 237 CrossRef.
- S. Tsujimura, K. Kano and T. Ikeda, Chem. Lett., 2002, 10, 1022 CrossRef.
- A. Heller, Curr. Opin. Chem. Biol., 2006, 10, 664 CrossRef CAS.
- Y. Liu and S. Dong, Biosens. Bioelectron., 2007, 23, 593 CrossRef CAS.
- E. Nazaruk and R. Bilewicz, Bioelectrochemistry, 2007, 71, 8 CrossRef CAS.
- S. Liu, Y. Yin and C. Cai, Chin. J. Chem., 2007, 25, 439 CrossRef CAS.
- Z. Zhu, M. Wang, A. Gautam, J. Nazor, C. Morneu, R. Prodanovic and U. Schwaneberg, Biotechnol. J., 2007, 2, 241 Search PubMed.
- P. Atanassov, F. Colon and V. Rajendran, ‘Glucose–air enzymatic fuel cell’, in Proceedings of the Colloid Chemistry Division, American Chemical Society, Washington DC, 2004, p. 207 Search PubMed.
- J. Moiroux and P. J. Elving, Anal. Chem., 1978, 50, 1056 CrossRef CAS.
- J. Kulys, G. Gleixner, W. Schuhmann and H. L. Schmidt, Electroanalysis, 1993, 5, 201 CrossRef CAS.
- Q.-J. Chi and S.-J. Dong, J. Mol. Catal. A: Chem., 1996, 105, 193 CrossRef CAS.
- A. Torstensson and L. Gorton, J. Electroanal. Chem. Interfacial Electrochem., 1981, 130, 199 CAS.
- A. A. Karyakin, E. E. Karyakina, W. Schuhmann and H.-L. Schmidt, Electroanalysis, 1999, 11, 553 CrossRef CAS.
- L. T. Gorton, A., H. Jaegfeldt and G. Johansson, J. Electroanal. Chem. Interfacial Electrochem., 1984, 161, 103 CrossRef CAS.
- F. Ni, H. Feng, L. Gorton and T. M. Cotton, Langmuir, 1990, 6, 66 CrossRef CAS.
- Q. Chi and S. Dong, Anal. Chim. Acta, 1994, 285, 125 CrossRef CAS.
- C. Lei and J. Deng, Anal. Chem., 1996, 68, 3344 CrossRef CAS.
- L. Gorton, G. Johansson and A. Torstensson, J. Electroanal. Chem. Interfacial Electrochem., 1985, 196, 81 CrossRef CAS.
- L. Mao and K. Yamamoto, Talanta, 2000, 51, 187 CrossRef CAS.
- L. B. Wingard Jr, TrAC, Trends Anal. Chem., 1984, 3, 235 CrossRef.
- H. L. Schmidt, F. Gutberlet and W. Schuhmann, Sens. Actuators, B, 1993, 13, 366 CrossRef CAS.
- C. Degrand and L. L. Miller, J. Am. Chem. Soc., 1980, 102, 5728 CrossRef CAS.
- W. J. Albery, A. W. Foulds, K. J. Hall, A. R. Hillman, R. G. Egdell and A. F. Orchard, J. Electrochem. Soc., 1980, 127, 654 CAS.
- M. E. G. Lyons, H. G. Fay, C. Mitchell and D. E. McCormack, Anal. Chem. Symp. Ser., 1986, 25, 285 Search PubMed.
- A. A. Karyakin, E. E. Karyakina and H. L. Schmidt, Electroanalysis, 1999, 11, 149 CrossRef CAS.
- V. Svoboda, M. J. Cooney, C. Rippolz and B. Y. Liaw, J. Electrochem. Soc., 2007, 154, D113 CrossRef CAS.
- V. Svoboda, M. Cooney, B. Y. Liaw, S. Minteer, E. Piles, D. Lehnert, S. C. Barton, R. Rincon and P. Atanassov, Electroanalysis, 2008, 20, 1099–1109 CrossRef.
- V. Svoboda and B. Y. Liaw, J. Pure Appl. Chem., 2008 Search PubMed , in press.
- G. T. R. Palmore, H. Bertschy, S. H. Bergens and G. M. Whitesides, J. Electroanal. Chem., 1998, 443, 155 CrossRef CAS.
- M. K. Islam, T. Ohashi, T. Yasukawa, H. Shiku, M. Nishizawa, J. Kosuge, N. Fukasaku and T. Matsue, Chem. Sens., 2004, 20, 744 Search PubMed.
- K. Niki, T. Yagi, H. Inokuchi and K. Kimura, J. Am. Chem. Soc., 1979, 101, 3335 CrossRef CAS.
- S. D. Varfolomeev, I. N. Kurochkin and A. I. Yaropolov, Biosens. Bioelectron., 1996, 11, 863 CrossRef CAS.
- Y. Degani and A. Heller, J. Am. Chem. Soc., 1989, 111, 2357 CrossRef CAS.
- T. Ikeda, ‘Direct Redox Communication between Enzymes and Electrodes’, in Frontiers in Biosensors I, ed. F. W. Scheller, F. Schubert and J. Fedrowitz, Basel, Switzerland, 1997, p. 243 Search PubMed.
- F. A. Armstrong, H. A. O. Hill and N. J. Walton, Acc. Chem. Res., 1988, 21, 407 CrossRef CAS.
- H. A. O. Hill and N. I. Hunt, Methods Enzymol., 1993, 227, 501 CAS.
- H. A. O. Hill and I. J. Higgins, Philos. Trans. R. Soc. London, Ser. A, 1981, 302, 267 CrossRef CAS.
- S. Shleev, J. Tkac, A. Christenson, T. Ruzgas, A. I. Yaropolov, J. W. Whittaker and L. Gorton, Biosens. Bioelectron., 2005, 20, 2517 CrossRef CAS.
- L. Gorton, Electroanalysis, 1995, 7, 23 CAS.
- F. A. Armstrong and G. S. Wilson, Electrochim. Acta, 2000, 45, 2623 CrossRef CAS.
- A. L. Ghindilis, Biochem. Soc. Trans., 2000, 28, 84 CAS.
- R. A. Marcus, Rev. Mod. Phys., 1993, 65, 599 CrossRef CAS.
- R. A. Marcus and N. Sutin, Biochim. Biophys. Acta, 1985, 811, 265 CAS.
- L. Gorton, A. Lindgren, T. Larsson, F. D. Munteanu, T. Ruzgas and I. Gazaryan, Anal. Chim. Acta, 1999, 400, 91 CrossRef CAS.
- L. Gorton, G. Jonsson-Pettersson, E. Csoregi, K. Johansson, E. Dominguezt and G. Marko-Varga, Analyst, 1992, 117, 1235 RSC.
- A. Christenson, N. Dimcheva, E. E. Ferapontova, L. Gorton, T. Ruzgas, L. Stoica, S. Shleev, A. I. Yaropolov, D. Haltrich, R. N. F. Thorneley and S. D. Aust, Electroanalysis, 2004, 16, 1074 CrossRef CAS.
- L. Stoica, R. Ludwig, D. Haltrich and L. Gorton, Anal. Chem., 2006, 78, 393 CrossRef CAS.
- T. Ikeda, F. Matsushita and M. Senda, Biosens. Bioelectron., 1991, 6, 299 CrossRef CAS.
- W. Zheng, Q. Li, L. Su, Y. Yan, J. Zhang and L. Mao, Electroanalysis, 2006, 18, 587 CrossRef CAS.
- D. Ivnitski and P. Atanassov, Electroanalysis, 2007, 19, 2307 CrossRef CAS.
- S. Shleev, A. El Kasmi, T. Ruzgas and L. Gorton, Electrochem. Commun., 2004, 6, 934–939 CrossRef CAS.
- K. Habermuller, M. Mosbach and W. Schuhmann, Fresenius’ J. Anal. Chem., 2000, 366, 560 CrossRef.
- P. M. Allen, H. Allen, O. Hill and N. J. Walton, J. Electroanal. Chem., 1984, 178, 69 CrossRef CAS.
- J. E. Frew and H. A. O. Hill, Eur. J. Biochem., 1988, 172, 261 CAS.
- M. Collinson, E. F. Bowden and M. J. Tarlov, Langmuir, 1992, 8, 1247 CrossRef CAS.
- I. Willner, V. Heleg-Shabtai, R. Blonder, E. Katz, G. Tao, A. F. Buckmann and A. Heller, J. Am. Chem. Soc., 1996, 118, 10321 CrossRef CAS.
- I. Willner, Science, 2002, 298, 2407 CrossRef CAS.
- Y. Xiao, F. Patolsky, E. Katz, J. F. Hainfeld and I. Willner, Science, 2003, 299, 1877 CrossRef CAS.
- M. Gerard, A. Chaubey and B. D. Malhotra, Biosens. Bioelectron., 2002, 17, 345 CrossRef CAS.
- A. Heller, Acc. Chem. Res., 1990, 23, 128 CrossRef CAS.
- W. Schuhmann, Microchim. Acta, 1995, 121, 1 CAS.
- Y. Degani and A. Heller, J. Am. Chem. Soc., 1988, 110, 2615 CrossRef CAS.
- W. Schuhmann, T. J. Ohara, H. L. Schmidt and A. Heller, J. Am. Chem. Soc., 1991, 113, 1394 CrossRef CAS.
- A. Ramanavicius, K. Habermuller, E. Csoeregi, V. Laurinavicius and W. Schumann, Anal. Chem., 1999, 71, 3581 CrossRef CAS.
- C. G. J. Koopal, B. de Ruiter and R. J. M. Nolte, J. Chem. Soc., Chem. Commun., 1991, 23, 1691 Search PubMed.
- L. Coche-Guerente, S. Cosnier and P. Labbe, Chem. Mater., 1997, 9, 1348 CrossRef.
- C. G. J. Koopal, A. A. C. M. Bos and R. J. M. Nolte, Sens. Actuators, B, 1994, 18, 166 CrossRef CAS.
- G. Wang, N. M. Thai and S.-T. Yau, Electrochem. Commun., 2006, 8, 987 CrossRef CAS.
- J. J. Gooding, R. Wibowo, J. Q. Liu, W. Yang, D. Losic, S. Orbons, F. J. Mearns, J. G. Shapter and D. B. Hibbert, J. Am. Chem. Soc., 2003, 125, 9006 CrossRef CAS.
- Y. Lin, S. Taylor, H. Li, K. A. S. Fernando, L. Qu, W. Wang, L. Gu, B. Zhou and Y.-P. Sun, J. Mater. Chem., 2004, 14, 527 RSC.
- A. Guiseppi-Elie, C. Lei and R. H. Baughman, Nanotechnology, 2002, 13, 559 CrossRef.
- J. Wang and M. Musameh, Anal. Chim. Acta, 2005, 539, 209 CrossRef CAS.
- A. Ramanavicius, A. Kausaite and A. Ramanaviciene, Biosens. Bioelectron., 2005, 20, 1962 CrossRef CAS.
- R. L. Arechederra, B. L. Treu and S. D. Minteer, J. Power Sources, 2007, 173, 156 CrossRef CAS.
- J. Kim, H. Jia and P. Wang, Biotechnol. Adv., 2006, 24, 296 CrossRef CAS.
- R. Duma and S. D. Minteer, Electrochem. Soc. Trans., 2007, 5, 117 Search PubMed.
- N. Mano, H. Kim and A. Heller, J. Phys. Chem. B, 2002, 106, 8842 CrossRef CAS.
- D. Ivnitski, P. Atanassov and C. Apblett, Electroanalysis, 2007, 19, 1562 CrossRef CAS.
- C. Leger, A. K. Jones, S. P. J. Albracht and F. A. Armstrong, J. Phys. Chem. B, 2002, 106, 13058 CrossRef CAS.
- R. J. Marshall and F. C. Walsh, Surf. Technol., 1985, 24, 45 CrossRef CAS.
- M. Enriquez-Granados, G. Valentin and A. Storck, Electrochim. Acta, 1983, 28, 1407 CrossRef CAS.
- A. Storck, M. A. Enriquez-Granados and M. Roger, Electrochim. Acta, 1982, 27, 293 CrossRef CAS.
- P. N. Bartlett and P. R. Birkin, Synth. Met., 1993, 61, 15 CAS.
- W. Schuhmann, Biosens. Bioelectron., 1995, 10, 181 CrossRef CAS.
- M. Trojanowicz, O. Geschke, K. Krawczyk and K. Cammann, Sens. Actuators, B, 1995, 28, 191 CrossRef.
- P. Gros and M. Comtat, Biosens. Bioelectron., 2004, 20, 204 CrossRef CAS.
- U. Bilitewski, P. Rüger and R. D. Schmid, Biosens. Bioelectron., 1991, 6, 369 CrossRef CAS.
- E. J. Calvo, J. Electroanal. Chem., 1994, 369, 279 CrossRef CAS.
- A. R. Vijayakumar, E. Csoregi, A. Heller and L. Gorton, Anal. Chim. Acta, 1996, 327, 223 CrossRef CAS.
- M. J. Cooney, C. Lau, M. Windmeisser, B. Y. Liaw, T. L. Klotzbach and S. D. Minteer, J. Mater. Chem., 2008, 18, 667 RSC.
- C. Lau, M. J. Cooney and P. Atanassov, Langmuir, 2008, 24, 7004–7010 CrossRef CAS , in press.
- C. M. Moore, S. Hackman, T. Brennan and S. D. Minteer, J. Membr. Sci., 2005, 255, 233 CrossRef CAS.
- T. L. Klotzbach, M. M. Watt, Y. Ansari and S. D. Minteer, J. Membr. Sci., 2006, 282, 276 CrossRef CAS.
- W. Johnston, N. Maynard, B. Y. Liaw and M. J. Cooney, Enzyme Microb. Technol., 2006, 39, 131 CrossRef CAS.
- W. Johnston, M. J. Cooney, B. Y. Liaw, R. Sapra and M. W. W. Adams, Enzyme Microb. Technol., 2005, 36, 540 CrossRef CAS.
- E. Katz and I. Willner, J. Am. Chem. Soc., 2003, 125, 6803 CrossRef CAS.
- D. Sun, D. Scott, M. J. Cooney and B. Y. Liaw, Electrochem. Solid-State Lett., 2008, 11(6), B101–B104 CrossRef CAS.
- B. A. Gregg and A. Heller, Anal. Chem., 1990, 62, 258 CrossRef.
- S. C. Savett, J. R. Atkins, C. R. Sides, J. L. Harris, B. H. Thomas, S. E. Creager, W. T. Pennington and D. D. DesMarteau, J. Electrochem. Soc., 2002, 149, A1527 CrossRef CAS.
- C. M. Moore, N. L. Akers, A. D. Hill, Z. C. Johnson and S. D. Minteer, Biomacromolecules, 2004, 5, 1241 CrossRef CAS.
- M. J. Cooney and B. Y. Liaw, ‘In Situ Characterization Techniques for Design and Evaluation of Micro and Nano Enzyme-Catalyzed Power Sources’ in Biomolecular Catalysis, ed. P. S. Wang and J. B. Kim, American Chemical Society, Washington DC, 2006, p. 289–333 Search PubMed.
- O. S. Wolfbeis, Anal. Chem., 2000, 72, 81R CrossRef CAS.
- S. D'Auria and J. R. Lakowicz, Curr. Opin. Biotechnol., 2001, 12, 99 CrossRef CAS.
- L. Rabinovitch-Guilatt, P. Couvreur, S. Benita, G. Lambert, D. Goldstein and C. Dubernet, Phys. Lipids, 2004, 131, 1 Search PubMed.
- F. Hussain, D. J. S. Birch and J. C. Pickup, Anal. Biochem., 2005, 339, 137 CrossRef CAS.
- A. Konash, M. J. Cooney, B. Y. Liaw and D. M. Jameson, J. Mater. Chem., 2006, 16, 4107–4109 RSC.
- D. M. Jameson and J. C. Croney, Comb. Chem. High Throughput Screening, 2003, 6, 167 CAS.
- M. G. Badea, L. Brand, C. H. W. Hirs and N. T. Serge, Methods Enzymol., 1979, 61, 378–425 Search PubMed.
- D. M. Jameson, J. C. Croney, P. D. J. Moens, M. Gerard and P. Ian, Methods Enzymol., 2003, 360, 1–43 CAS.
- S. Albaugh, J. Lan and R. F. Steiner, Biophys. Chem., 1989, 33, 71 CrossRef CAS.
- I. Soutar, C. Jones, D. M. Lucas and L. Swanson, J. Photochem. Photobiol., A, 1996, 102, 87 CrossRef CAS.
- M. A. Winnik, Acc. Chem. Res., 1985, 18, 73 CrossRef CAS.
- M. A. Kane, G. A. Baker, S. Pandey, I. E. P. Maziarz, D. C. Hoth and F. V. Bright, J. Phys. Chem. B, 2000, 104, 8585 CrossRef CAS.
- D. J. R. Laurence, Biochem. J., 1952, 51, 168 CAS.
- W. B. Danliker and V. A. DeSaussure, Immunochemistry, 1970, 7, 799 CrossRef CAS.
- D. M. Jameson and W. H. Sawyer, Methods Enzymol., 1995, 246, 283 CAS.
- D. M. Jameson and T. L. Hazzlett, in Time-Resolved Fluorescence in Biology and Biochemistry, ed. T. G. Dewey, New York, 1991 Search PubMed.
- D. Magde, E. L. Elson and W. W. Webb, Biopolymers, 1974, 13, 29 CrossRef CAS.
- M. A. Digman, C. M. Brown, A. R. Horwitz, W. W. Mantulin and E. Gratton, Biophys. J., 2008, 94, 2819 CAS.
- M. A. Digman, C. M. Brown, P. Sengupta, P. W. Wiseman, A. R. Horwitz and E. Gratton, Biophys. J., 2005, 89, 1317 CrossRef CAS.
- M. A. Digman, P. Sengupta, P. W. Wiseman, C. M. Brown, A. R. Horwitz and E. Gratton, Biophys. J., 2005, 88, L33 CrossRef CAS.
- T. Forster, Ann. Phys., 1948, 2, 55 CAS.
- J. R. Lakowicz, Principles of Fluorescence Spectroscopy, Kluwer Academic, New York, USA, 2nd edn, 1999 Search PubMed.
- I. R. Wheeldon, S. C. Barton and S. Banta, Biomacromolecules, 2007, 8, 2990 CrossRef CAS.
- R. Darby, Adv. Energy Conv., 1965, 5, 43 CrossRef CAS.
- R. B. Anderson, J. Catal., 1964, 3, 50 CrossRef CAS.
- S. Brunauer, P. H. Emmett and E. Teller, J. Am. Chem. Soc., 1938, 60, 309 CrossRef CAS.
- F. E. Bartell and J. E. Bower, J. Colloid Sci., 1952, 7, 80 CrossRef CAS.
- S. Brunauer, R. S. Mikhail and E. E. Bodor, J. Colloid Interface Sci., 1967, 25, 353 CrossRef CAS.
- M. M. Dubinin, Adv. Colloid Interface Sci., 1968, 2, 217 CrossRef CAS.
- K. R. Lange, J. Colloid Sci., 1963, 18, 65 CrossRef CAS.
- A. Jena and K. Gupta, J. Power Sources, 2001, 96.
- J. G. Pharoah, K. Karan and W. Sun, J. Power Sources, 2006, 161, 214 CrossRef CAS.
- R. I. Razouk, R. S. Mikhail and B. S. Girgis, J. Colloid Interface Sci., 1967, 24, 470 CrossRef CAS.
- L. M. Mathieu, T. L. Mueller, P. E. Bourban, D. P. Poioletti, R. Muller and J. A. E. Manson, Biomaterials, 2006, 27, 905 CrossRef CAS.
- G. H. van Lenthe, H. Hagenmuller, M. Bohner, S. J. Hollister and R. L. M. Muller, Biomaterials, 2479, 28 Search PubMed.
- L. Farber, G. Tardos and J. N. Michaels, Powder Technol., 2003, 132, 57 CAS.
- K. Huber and A. Gaugler, J. Colloid Sci., 1948, 3, 197 CrossRef CAS.
- J. Piekarczyk and R. Pampuch, Ceramurgia Int., 1976, 2, 177 CrossRef CAS.
- M. J. Cooney, J. Petermann, C. Lau and S. D. Minteer, Carbohydr. Polym., 2008 Search PubMed.
- K. Martinek, N. L. Klyachko, A. V. Kabanov, Y. L. Khmel'nitskii and A. V. Levashov, Biochim. Biophys. Acta, 1989, 981, 161 CAS.
- K. Martinek, N. L. Klyachko, A. V. Levashov and I. V. Berezin, Dokl. Akad. Nauk. USSR, 1983, 263, 491.
- K. Martinek, A. V. Pshezhetskii, S. Merker, G. S. Pepanyan, N. L. Klyachko and A. V. Levashov, Biokhimiya, 1988, 53, 1013 Search PubMed.
- S. Debnath, A. Dasgupta, R. N. Mitra and P. K. Das, Langmuir, 2006, 2006, 8732 CrossRef.
- J. S. Clegg, J. Cell Biol., 1984, 99, 167s CrossRef CAS.
- Cell-Associated Water, ed. W. Drost-Hansen ,J. S. Drost-Hansen and J. S. Clegg, Academic Press, New York, 1979, pp. 440 Search PubMed.
- J. W. Wojcieszyn, R. A. Schelegel, E. S. Wu and K. A. Jacobson, Proc. Natl. Acad. Sci. U. S. A., 1981, 78, 4407 CrossRef CAS.
- R. Bru, A. Sanchez-Ferrer and F. Garcia-Carmona, Biochem. J., 1995, 310, 721 CAS.
- L. Cao, Curr. Opin. Chem. Biol., 2005, 9, 217 CrossRef CAS.
- D. T. Nguyen, M. Smit, B. Dunn and J. I. Zink, Chem. Mater., 2002, 14, 4300 CrossRef CAS.
- R. Fernandez-Lafuente, C. M. Rosell, V. Rodriguez and J. M. Guisan, Enzyme Microb. Technol., 1995, 17, 517 CrossRef CAS.
- A. Bardea, E. Katz, A. F. Bueckmann and I. Willner, J. Am. Chem. Soc., 1997, 119, 9114 CrossRef CAS.
- J. Lim, P. Malati, F. Bonet and B. Dunn, J. The Electrochem. Soc., 2007, 154, A140 Search PubMed.
- S. Calabrese-Barton, H. Kim, G. Binyamin, Y. Zhang and A. Heller, J. Phys. Chem. B, 2001, 105, 11917 CrossRef CAS.
- N. Mano, V. Soukharev and A. Heller, J. Phys. Chem. B, 2006, 110, 11180 CrossRef CAS.
| This journal is © The Royal Society of Chemistry 2008 |

