Anion binding vs.sulfonamide deprotonation in functionalised ureas†
Claudia
Caltagirone
,
Gareth W.
Bates
,
Philip A.
Gale
* and
Mark E.
Light
School of Chemistry, University of Southampton, Southampton, UK SO17 1BJ. E-mail: philip.gale@soton.ac.uk; Fax: +44 (0)23 8059 6805; Tel: +44 (0)23 8059 3332
First published on 25th October 2007
Abstract
Sulfonamide groups, commonly used as neutral hydrogen bond donors in a wide variety of anion receptors, deprotonate upon addition of certain basic anionic guests in two simple functionalised ureas.
Anion recognition is an area of growing interest in supramolecular chemistry due to its potential environmental, clinical and biological applications.1 Many examples have been reported of anion receptor systems that employ amide ,2 urea3 and both amide and urea groups to complex anionic guests.4Sulfonamide -based receptors for anions are also an important class of anion receptor that have been investigated by a number of groups due to their enhanced acidity relative to analogous secondary amides and hence their potential to form stronger hydrogen bonds with anions.5 However, competing processes, that are not always immediately recognised, can complicate apparently simple anion complexation processes. For example, over the last five years, deprotonation of neutral hydrogen bond donor groups by basic anions such as fluoride and acetate has been reported by ourselves and others in a variety of systems including pyrroles,6amines ,7 amidoureas8 and ureas.9
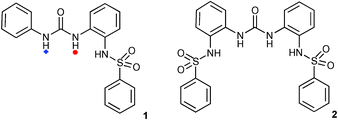
Recently, we began to explore the anion complexation and fluorescence properties of a family of receptors containing urea and dansyl groups as potential fluorescent sensors for anions.10 However, we noticed that NMR titrations of these receptors with fluoride, acetate, dihydrogen phosphate and benzoate all gave identical final shifts of the urea NH groups in DMSO-d6–5% water solution in the presence of excess anion. This evidence led us to explore the possibility that this type of receptor, rather than forming complexes with these anions, may in fact be deprotonating under these conditions and hence forming identical deprotonated species in solution. We therefore synthesised simpler compounds 1 and 2 that contain a urea group and one or two sulfonamide moieties respectively and studied their behaviour in organic solution upon addition of a series of tetrabutylammonium anion salts. We found that the sulfonamide group in these systems is readily deprotonated by a number of different anions.
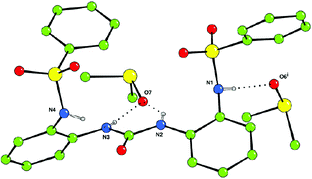
N-(2-(3-Phenylureido)phenyl)benzenesulfonamide (1) and N,N′-(2,2′-carbonylbis(azanediyl)bis(2,1-phenylene))dibenzenesulfonamide (2) were synthesised from 1-(2-aminophenyl)-3-phenylurea and 1,3-bis(2-aminophenyl)urea,11 respectively, and benzene sulfonylchloride (see ESI† ). The structure of receptor 2 was confirmed by single crystal X-ray diffraction of crystals grown by slow evaporation of a DMSO solution of the receptor.‡ (Fig. 1)
 | ||
| Fig. 1 The X-ray crystal structure of the DMSO solvate of 2. Non-acidic hydrogen atoms have been omitted for clarity. (i) x, y + 1/2, z – 1/2. | ||
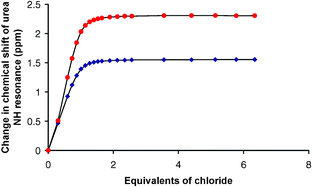
The interactions of receptors 1 and 2 with anions (fluoride, acetate, dihydrogen phosphate, benzoate, chloride, added as their tetrabutylammonium salts) were studied using 1H NMR titration techniques in acetonitrile-d3. In all cases the sulfonamide NH resonance would broaden or disappear during the titration experiments and hence the urea NH proton resonances were followed. Upon addition of chloride, formation of stable 1 : 1 complexes was observed in solution with stability constants Ka of 7550 M–1 and >104 M–1 for receptors 1 and 2, respectively.12 The NMR titration curve of receptor 1 with tetrabutylammonium chloride (Fig. 2) shows downfield shifts of both urea NH groups that then reach a plateau.
 | ||
| Fig. 2 Shifts of the urea NH groups of compound 1 upon addition of tetrabutylammonium chloride in CD3CN. Symbols correspond to the NH groups labelled in the structure of 1. | ||
However upon addition of acetate, a different titration profile was observed (Fig. 3). The urea NH groups shifted downfield on addition of one equivalent of acetate and then shifted upfield as further aliquots of acetate were added. We interpret this behaviour as the first equivalent of acetate binding to the receptor and deshielding the urea NH groups. Further additions of acetate trigger deprotonation and a shift of the urea NH protons upfield. Presumably this shift is also indicative of decomplexation of the bound acetate. Deprotonation driven by HX2– formation in solution has been observed by ourselves and others previously.6,9
 | ||
| Fig. 3 Shifts of the urea NH groups of compound 1 upon addition of tetrabutylammonium acetate in CD3CN. Symbols correspond to the NH groups labelled in the structure of 1. | ||
A similar result is obtained upon addition of fluoride anions with two equivalents of fluoride required to deprotonate the receptor.6 The urea NH adjacent to the sulfonamide (shown as a red circle in Fig. 4) shifts downfield, then upfield and then reaches a plateau upon addition of successive aliquots of fluoride. Presumably this urea NH group can form an intramolecular hydrogen bond to the deprotonated sulfonamide nitrogen atom and is therefore not available to interact with additional added fluoride anions. However the terminal urea NH group is not involved in any putative intramolecular interactions and so is capable of forming a single hydrogen bond to fluoride or HF2– present in solution, and hence this resonance continues to shift downfield after two equivalents of fluoride have been added.
 | ||
| Fig. 4 Shifts of the urea NH groups of compound 1 upon addition of tetrabutylammonium fluoride in CD3CN. Symbols correspond to the NH groups labelled in the structure of 1. | ||
Crystals of the tetrabutylammonium salt of 1–(H+) were grown by slow evaporation of an acetonitrile solution of the receptor in the presence of excess tetrabutylammonium fluoride.§ The structure shown in Fig. 5 reveals anion dimer formation in the solid state with the deprotonated species bridged by two water molecules and illustrates the urea nitrogen atom N2 forming a hydrogen bond to the deprotonated sulfonamide nitrogen N3 (N2⋯N3 = 2.664(5) Å) in the solid state.
 | ||
| Fig. 5 The X-ray crystal structure of the deprotonated sulfonamide 1 forming a dimer via hydrogen bond bridges through two water molecules. (i) –x + 2, –y, –z. Non-acidic hydrogen atoms and tetrabutylammonium counter cation have been omitted for clarity. | ||
Similar solution results were obtained with the bis-sulfonamide 2 but in this case four equivalents of fluoride were required to deprotonate two NH groups in two separate deprotonation processes (see ESI for more information† ). Crystals of doubly deprotonated 2 were obtained by slow evaporation of a CD3CN solution of receptor 2 in the presence of an excess of tetrabutylammonium acetate.¶ The structure (Fig. 6) shows a water molecule bound to the urea group in the dianion with additional intramolecular hydrogen bonding interactions between the urea NH groups and the adjacent deprotonated sulfonamide nitrogen atoms (N1⋯N2 = 2.598(4) Å; N3⋯N4 = 2.556(4) Å). Interestingly, the 1H NMR spectrum obtained by dissolving these crystals in acetonitrile-d3 is identical to the 1H NMR spectrum of the receptor in the presence of excess tetrabutylammonium acetate, further evidence of deprotonation of these systems in solution.
 | ||
| Fig. 6 The X-ray crystal structure of the doubly deprotonated sulfonamide 2 bound to a water molecule. Non-acidic hydrogen atoms, disordered water and tetrabutylammonium counter cations have been omitted for clarity. | ||
However, it was possible to obtain crystals of the less basic benzoate anion bound to receptor 1 by slow evaporation of a DMSO solution of the receptor in the presence of tetrabutylammonium benzoate.|| The structure (shown in Fig. 7) shows the benzoate anion bound to all three NH groups in the receptor (N1⋯O5 = 2.765(4) Å; N2⋯O4 = 2.972(4 ) Å; N3⋯O4 = 2.732(4) Å). However, 1H NMR evidence leads us to conclude that benzoate also triggers deprotonation in solution as we see a similar titration profile to acetate (see ESI† ). In solution an equilibrium will exist between neutral, complexed and deprotonated forms of the receptor and thus isolation of this complex should not be taken as evidence that deprotonation is not occurring in this case.
 | ||
| Fig. 7 The X-ray crystal structure of the benzoate complex of receptor 1. Non-acidic hydrogen atoms and tetrabutylammonium counter cation have been omitted for clarity. | ||
We have shown that basic anions can deprotonate the sulfonamide groups in compounds 1 and 2 in organic solution. In these cases, the deprotonated sulfonamide anion is stabilised by intramolecular hydrogen bonding interactions from the adjacent urea NH group. This work shows that caution should be exercised when interpreting NMR binding data of simple sulfonamide containing anion receptors as deprotonation processes, that may not be easily recognised at first, may compete with anion complexation.
We would like to thank the EPSRC/Crystal Faraday for a studentship (GWB) and the EPSRC together with Professor Mike Hursthouse for access to the crystallographic facilities at the University of Southampton. CC would like to thank Regione Sardegna for a Master & Back grant.
Notes and references
- P. A. Gale, S. E. García-Garrido and J. Garric, Chem. Soc. Rev., 2008 10.1039/b715825d; J. L. Sessler, P. A. Gale and W. S. Cho, in Anion Receptor Chemistry (Monographs in Supramolecular Chemistry), ed. J. F. Stoddart, Royal Society of Chemistry, Cambridge, UK, 2006 Search PubMed.
- (a) S. E. García-Garrido, C. Caltagirone, P. A. Gale and M. E. Light, Chem. Commun., 2007, 1450 RSC; (b) K. Kavallieratos, S. R. de Gala, D. J. Austin and R. H. Crabtree, J. Am. Chem. Soc., 1997, 119, 2325 CrossRef CAS; (c) S. J. Coles, J. G. Frey, P. A. Gale, M. B. Hursthouse, M. E. Light, K. Navakhun and G. L. Thomas, Chem. Commun., 2003, 568 RSC; (d) S. J. Brooks, L. S. Evans, P. A. Gale, M. B. Hursthouse and M. E. Light, Chem. Commun., 2005, 734 RSC; (e) K. Bowman-James, Acc. Chem. Res., 2005, 38, 671 CrossRef CAS; (f) P. D. Beer, M. R. Sambrook and D. Curiel, Chem. Commun., 2006, 2105 RSC; (g) S. O. Kang, D. Powell, V. W. Day and K. Bowman-Jones, Angew. Chem., Int. Ed., 2006, 45, 1921 CrossRef CAS.
- (a) T. Gunnlaugsson, P. E. Kruger, P. Jensen, J. Tierney, H. D. P. Ali and G. M. Hussey, J. Org. Chem., 2005, 70, 10875 CrossRef CAS; (b) C. E. Stanley, N. Clarke, K. M. Anderson, J. A. Elder, J. T. Lenthall and J. W. Steed, Chem. Commun., 2006, 3199 RSC; (c) V. Bryantsev and B. P. Hay, J. Am. Chem. Soc., 2006, 128, 2035 CrossRef CAS.
- (a) G. J. Pernìa, J. D. Kilburn, J. W. Essex, R. J. Mortishire-Smith and M. Rowley, J. Am. Chem. Soc., 1996, 118, 10220 CrossRef CAS; (b) E. Fan, C. Vicent and A. D. Hamilton, New J. Chem., 1997, 21, 81 Search PubMed; (c) B. H. M. Snellink-Rüel, M. M. G. Antonisse, J. F. J. Engbersen, P. Timmerman and D. N. Reinhoudt, Eur. J. Org. Chem., 2000, 165 CrossRef CAS.
- (a) S. Valiyaveettil, J. F. J. Engbersen, W. Verboom and D. N. Reinhoudt, Angew. Chem., Int. Ed. Engl., 1993, 32, 900 CrossRef; (b) K. Kavallieratos, C. M. Bertao and R. H. Crabtree, J. Org. Chem., 1999, 64, 1675 CrossRef CAS; (c) A. J. Ayling, M. N. Pérez-Payàn and A. P. Davis, J. Am. Chem. Soc., 2001, 123, 12716 CrossRef CAS; (d) S. Kondo, T. Suzuki and Y. Yano, Tetrahedron Lett., 2002, 43, 7059 CrossRef CAS; (e) C. Chen and Q. Chen, Tetrahedron Lett., 2004, 45, 3957 CrossRef CAS; (f) S.-i. Kondo, T. Suzuki, T. Toyama and Y. Yano, Bull. Chem. Soc. Jpn., 2005, 78, 1348 CrossRef CAS.
- (a) S. Camiolo, P. A. Gale, M. B. Hursthouse, M. E. Light and A. J. Shi, Chem. Commun., 2002, 758 RSC; (b) P. A. Gale, K. Navakhun, S. Camiolo, M. E. Light and M. B. Hursthouse, J. Am. Chem. Soc., 2002, 124, 11228 CrossRef CAS; (c) S. Camiolo, P. A. Gale, M. B. Hursthouse and M. E. Light, Org. Biomol. Chem., 2003, 1, 741 RSC; (d) P. A. Gale, Acc. Chem. Res., 2006, 39, 465 CrossRef CAS.
- T. Gunnlaugsson, P. E. Kruger, P. Jensen, F. M. Pfeffer and G. M. Hussey, Tetrahedron Lett., 2003, 44, 8909 CrossRef CAS.
- (a) L. S. Evans, P. A. Gale, M. E. Light and R. Quesada, Chem. Commun., 2006, 965 RSC; (b) L. S. Evans, P. A. Gale, M. E. Light and R. Quesada, New J. Chem., 2006, 30, 1019 RSC.
- (a) D. Esteban-Gòmez, L. Fabbrizzi and M. Licchelli, J. Org. Chem., 2005, 70, 5717 CrossRef CAS; (b) D. Esteban-Gòmez, L. Fabbrizzi, M. Licchelli and E. Monzani, Org. Biomol. Chem., 2005, 3, 1495 RSC.
- C. Caltagirone, P. A. Gale and M. E. Light, New Fluorescent Sulfonamide Receptors for Selective Anion Sensing, PSA24, 2nd International Symposium on Macrocyclic and Supramolecular Chemistry, Salice Terme (Pavia), Italy, June 24–28, 2007 Search PubMed.
- S. J. Brooks, P. A. Gale and M. E. Light, Chem. Commun., 2006, 4344 RSC; S. J. Brooks, S. E. García-Garrido, M. E. Light, P. A. Cole and P. A. Gale, Chem.–Eur. J., 2007, 13, 3320 CrossRef.
- M. J. Hynes, J. Chem. Soc., Dalton Trans., 1993, 311 RSC.
Footnotes |
| † Electronic supplementary information (ESI) available: Synthesis details, NMR spectra and 1H NMR titration curves. See DOI: 10.1039/b713431b |
| ‡ Crystal data were collected on a Bruker Nonius KappaCCD with a Mo rotating anode generator; standard procedures were followed. N–H hydrogen atoms were located in the difference map in all the structures and freely refined. Crystal data for compound 2: C29H34N4O7S4, Mr = 678.84, T = 120(2) K, monoclinic, space group P21/c, a = 12.5841(6), b = 15.6088(4), c = 16.5762(7) Å, β = 99.885(2)°, V = 3207.6(2) Å3, ρcalc = 1.406 g cm–3, µ = 0.348 mm–1, Z = 4, reflections collected: 36921, independent reflections: 5656 (Rint = 0.1052), final R indices [I > 2σ(I)]: R1 = 0.0487, wR2 = 0.1072, R indices (all data): R1 = 0.0821. wR2 = 0.1210. |
| § Crystal data for tetrabutylammonium salt of 1–(H+) C35H54N4O4S, Mr = 626.88, T = 120(2) K, monoclinic, space group P21/c, a = 12.0833(4), b = 17.0447(5), c = 18.2143(4) Å, β = 108.808(1)°, V = 3551.04(18) Å3, ρcalc = 1.173 g cm–3, µ = 0.133 mm–1, Z = 4, reflections collected: 70013, independent reflections: 7256 (Rint = 0.2143), final R indices [I > 2σ(I)]: R1 = 0.0808, wR2 = 0.1775, R indices (all data): R1 = 0.1737. wR2 = 0.2223. It is interesting to note that identical crystals could be grown by evaporation of a DMSO solution of the receptor in the presence of excess TBAF. |
| ¶ Crystal data for tetrabutylammonium salt of 2–(2H+): C57H94N6O6S2, Mr = 1023.50, T = 120(2) K, monoclinic, space group P21/n, a = 17.9274(3), b = 14.1111(3), c = 24.2589(4) Å, β = 106.918(1)°, V = 5871.31(19) Å3, ρcalc = 1.158 g cm–3, µ = 0.142 mm–1, Z = 4, reflections collected: 55113, independent reflections: 10342 (Rint = 0.0679), final R indices [I > 2σ(I)]: R1 = 0.0702, wR2 = 0.1283, R indices (all data): R1 = 0.1030, wR2 = 0.1435. Hydrogen atoms of the disordered water could not be located from the difference map and were omitted from the refinement. |
| || Crystal data for the benzoate complex of 1: C42H58N4O5S, Mr = 730.98, T = 120(2) K, monoclinic, space group P21/n, a = 10.0564(5), b = 24.5513(11), c = 16.6808(5)Å, β = 96.544(3)°, V = 4091.6(3) Å3, ρcalc = 1.187 g cm–3, µ = 0.126 mm–1, Z = 4, reflections collected: 35935, independent reflections: 9245 (Rint = 0.0578), final R indices [I > 2σ(I)]: R1 = 0.0876, wR2 = 0.1560, R indices (all data): R1 = 0.1280, wR2 = 0.1280. CCDC 659344–659347. For crystallographic data in CIF or other electronic format see DOI: 10.1039/b713431b |
| This journal is © The Royal Society of Chemistry 2008 |

