Characterization of fibrinogen adsorption onto glass microcapillary surfaces by ELISA
Malinda
Salim
a,
Brian
O'Sullivan
a,
Sally L.
McArthur
b and
Phillip C.
Wright
*a
aDepartment of Chemical and Process Engineering, University of Sheffield, Mappin Street, Sheffield, S1 3JD, UK. E-mail: p.c.wright@sheffield.ac.uk; Fax: +44 (0)114 222 7501; Tel: +44 (0)114 222 7577
bDepartment of Engineering Materials, The Kroto Research Institute, North Campus, The University of Sheffield, Broad Lane, Sheffield, S3 7HQ, UK. E-mail: s.l.mcarthur@sheffield.ac.uk; Fax: +44 (0) 114 222 5943; Tel: +44 (0) 114 222 5513
First published on 27th September 2006
Abstract
Adsorption of biomolecules onto microchannel surfaces remains a critical issue in microfluidic devices. This paper investigates the adsorption of fibrinogen on glass microcapillaries using an immunoassay method (ELISA) and X-ray photoelectron spectroscopy (XPS). Various adsorption conditions such as protein concentrations and incubation times, buffer pH, buffer ionic strengths and effects of flow are presented. ELISA is successfully demonstrated as a facile and robust technique to examine these phenomena. The highest adsorption level occurs near the isoelectric point of fibrinogen (pH 5.0) and low buffer ionic strengths (0–8 mM). Microchannel surface saturation was achieved at a fibrinogen solution concentration of ∼50 µg ml−1. Fibrinogen adsorption under flow was always higher than that seen in static systems. The importance of diffusion phenomena in microchannels on protein adsorption was demonstrated. ELISA experiments using fused silica and PEEK have also confirmed significant adsorption on these mass spectrometer transfer line materials.
Introduction
Microfluidic systems are becoming increasingly important for bioanalytical and biochemical research such as proteomics, genomics, clinical diagnostics and drug discovery.1 Miniaturisation has been applied to many bioassays and biological applications.2 Miniaturisation of analytical devices possesses several advantages over macroscale systems, mainly due to the lower sample consumption and fast analysis time.Non-specific adsorption of biomolecules onto the surfaces of these microdevices has a limiting effect on their efficiency, and therefore cannot be neglected. This uncontrolled adsorption removes biomolecules from solutions, introducing errors in bioassays. Also, for devices using electro-osmotic flow (EOF), adsorption reduces the surface charge, and thus electrokinetic mobility. In chromatographic systems, this leads to longer run times and poorer separation between species.3,4
Factors affecting the adsorption of a biomolecule onto a surface include properties of the protein itself (size, charge, stability and unfolding rate),5 as well as the conditions within the microchannel: protein concentration, pH and ionic strength of the buffer solution, incubation time, flow rates, temperature and surface chemistry.6 An understanding of the fundamental factors that influence protein adsorption in a microfluidic channel is critical, if strategies for controlling protein and biomolecule interaction with devices are to be developed in the future.
One of the greatest challenges when probing protein adsorption in microfluidic devices is the development of simple and robust assays suitable for both detecting and quantifying the biomolecules adsorbed to the device surfaces. The enzyme-linked immunosorbent assay (ELISA) technique is widely used for detecting and quantifying peptides, proteins, antibodies and hormones present in complex solutions. As ELISA requires the biomolecules to be surface immobilised prior to detection, it is an obvious choice of assay for probing adsorption events in microfluidic channels. The assay utilises the principles of protein detection via specific antibody recognition. Conjugation of an enzyme to the detection antibody enables surface immobilised proteins to be detected via enzyme catalysed oxidation of a suitable substrate solution, yielding a detectable coloured product measurable with a spectrophotometer. The absorbance signal observed can be correlated to the amount of protein present. Colorimetric detection methods used in ELISA alleviate many of the autofluorescence, photobleaching and other complexities generally associated with fluorescence detection schemes.
Of course, the ELISA technique relies on the specificity and availability of a suitable antibody. Protein adsorption at interfaces can also be detected via surface chemical characterisation using X-ray photoelectron spectroscopy (XPS). XPS can be used to monitor changes in the atomic concentrations and the chemical environments of the surface elements to depths of 10 nm. Variations in the nitrogen content and peak shifts in the high resolution C 1s core level spectra associated with amine and amide bond states are commonly used to indicate protein adsorption at a surface. Previous studies have shown that on nitrogen-free substrates such as glass, XPS can detect protein adsorption to levels as low as 10 ng cm−2.7
Although there is an extensive body of literature on protein adsorption at surfaces, few investigations of adsorption onto microchannels have been reported.8–11 Lionello et al.9,10 have experimented and modelled the adsorption of fluorescently-labelled immunoglobulin G (IgG) onto poly(ethylene terephthalate) (PET) microchannels under static and dynamic conditions using a laser-induced fluorescence confocal microscope. The authors predicted surface coverage values and ways of loading proteins for immunoassay purposes. Nicolau et al.8 demonstrated adsorption models for microfluidic devices using a ‘generic’ protein, estimating the thickness of protein adsorbed layer under different process parameters such as protein concentrations, ionic strengths and wall surface tensions.
In this present work, we aim to develop a simple and flexible approach to characterise the interplay between protein adsorption at interfaces and diffusion in microchannels. This technique is essentially independent of complex instrumentation and techniques often explored in other studies. Using glass microcapillaries as model surfaces, an improved understanding of how protein adsorbs under various conditions was investigated. Human fibrinogen (MW 340 kDa)12 was chosen as the protein of study due to its role as a major constituent of blood plasma. The effects of varying fibrinogen concentration, incubation time, buffer pH, buffer ionic strength, flow conditions and role of diffusion were experimentally investigated using the ELISA method. The adsorption behaviour of fibrinogen in fused silica and PEEK capillaries was also investigated, as these materials are often used as transfer lines in microfluidic applications. XPS was used to corroborate some of the ELISA results.
Experimental
Chemicals, materials and instrumentation
Fibrinogen from human plasma (∼65% purity, contains ∼15% sodium citrate and ∼20% sodium chloride), polyoxyethylene sorbitan monolaureate (Tween 20), nonfat-dried bovine milk, bovine serum albumin (BSA, ≥98% purity), 2,2′-azino-bis(3-ethylbenzthiazoline-6-sulfonic acid) diammonium (ABTS, ∼98% purity), gelatin from cold water fish skin, 30% (w/w) hydrogen peroxide solution and glass microcapillary pipettes (290 µm id × 125 mm length) were all purchased from Sigma-Aldrich (UK). Goat polyclonal anti-fibrinogen with horseradish peroxidase (HRP) conjugate was purchased from Abcam (UK). 3,5,3′,5′-Tetramethylbenzidine (TMB) was purchased from Perbio Science (UK). Distilled water was deionized (18 mΩ) using a Milli-Q system from Millipore (UK). Fused silica capillaries (100 µm id) were purchased from Presearch (UK). Teflon tubing (880 µm id) and all microfluidic fittings were purchased from Omnifit (UK). Polyetheretherketone (PEEK) tubings were purchased from Dionex (UK). Disposable syringes (1 ml), Nunclon round-bottom polystyrene plates (96-well) and pH meter (Fisherbrand Hydrus 300) were purchased from Fisher Scientific (UK). Glass cover slips (18 mm × 18 mm) were purchased from Agar Scientific (UK). Ultramicroplate reader (EL X808) was from Bio-Tek Instruments, Inc. (USA); the errors are <1% for optical densities below 2.5 and <2% for optical densities up to 3.5. XPS analyses were carried out using a VG CLAM 2 spectrometer (Vacuum Generators, East Grinstead, UK). Syringe pump was purchased from ProSense BV (Model NE-1000, USA). All the other chemicals used for buffer preparation were purchased from Sigma-Aldrich (UK), and used without further purification.Apparatus and setup
Methods
Adsorption at different fibrinogen concentrations. Glass capillaries were rinsed with 150 mM phosphate buffered saline solution (PBS, pH 7.4) and then filled with fibrinogen solutions of various concentrations (1000 µg ml−1, 500 µg ml−1, 100 µg ml−1, 50 µg ml−1, 10 µg ml−1, 5 µg ml−1, 1 µg ml−1and 0.1 µg ml−1) in PBS (150 mM, pH 7.4) using capillary action. Seven glass capillaries were used for each fibrinogen concentration (see Fig. 1). The glass capillaries were covered with Parafilm, incubated for 2 h then rinsed with the PBS buffer. Blocking solution (PBS with 0.05% (v/v) Tween 20 and 5% (w/v) milk) was introduced and incubated for 2 h, followed by further rinsing with PBS buffer. Anti-fibrinogen-HRP conjugate (1:20000 in the blocking solution) was then introduced and incubated for 2 h at room temperature, followed by buffer rinsing. The capillaries were filled with a substrate solution (4 mg ABTS and 10 µl 30% (w/w) hydrogen peroxide in 12 ml citrate buffer, pH 4.0), incubated for 3 min, then flushed with air into a single microplate well. The optical density of the well was read with a microplate reader at 405 nm. Negative control experiments without the addition of fibrinogen were also carried out. Corrected optical densities were obtained by subtracting the negative control absorbances from the experimental values. All the experiments were performed in triplicate with error bars included in the data sets.
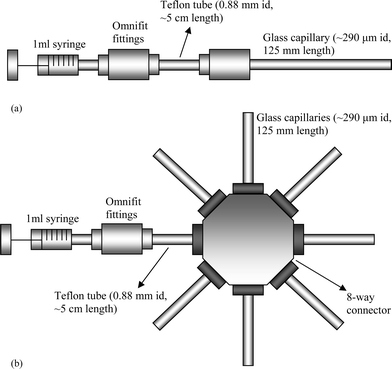 | ||
| Fig. 1 (a) Schematic diagram of the experimental setup used for fibrinogen adsorption in glass capillaries studied under flow conditions. The glass capillary was attached to a 1 ml syringe through the Omnifit tubing and fittings, with protein flow rates controlled by a syringe pump. (b) Schematic diagram of the experimental setup used for the static fibrinogen adsorption studies in glass capillaries. The glass capillaries were connected to a 1 ml syringe through an Ominfit 8-way connector and fittings. Seven capillaries were used in each experimental run to obtain a total volume of ∼56 µl, which was required for the microplate reader data acquisition. | ||
Adsorption at different static fibrinogen incubation times. Fibrinogen solutions (50 µg ml−1) in PBS buffer (150 mM, pH 7.4) were incubated in glass capillaries at room temperature for different time intervals, i.e. 10 s, 30 s, 1 min, 2 min, 4 min, 8 min, 30 min, 1 h and 2 h; then assayed using ELISA, as described above.
Adsorption at different buffer pH conditions. Fibrinogen solutions (1000 µg ml−1) were prepared in a range of 150 mM buffers, with pH values of 2.3, 3.3 (citrate buffer), 5.0, 7.0 (PBS), 9.2, 10.0 and 11.0 (carbonate buffer). Each solution was incubated in glass capillaries for 2 h at room temperature and then assayed using ELISA, as described above.
Adsorption at different buffer ionic strengths. Fibrinogen solutions (1000 µg ml−1) were prepared in a series of PBS buffers, pH 7.4, having the following ionic strengths: 0 mM (distilled water), 1, 8, 15, 82, 150, and 200 mM. Each solution was incubated in glass capillaries for 2 h at room temperature and then assayed using ELISA, as described above.
Sample preparation. Fibrinogen solutions (1000 µg ml−1) were prepared in a range of 150 mM buffers, with pH values of 3.3 (citrate buffer), 5.0, 7.0 (PBS), 9.2 and 10.0 (carbonate buffer). Glass cover slips were cleaned by rinsing and sonicating in distilled water (10 min) and isopropanol (3 × 5 min, using fresh isopropanol each time), followed by air-drying.
The clean cover slips were immersed in the various fibrinogen solutions and incubated at room temperature for 2 h, then washed with the appropriate buffer solution, thoroughly rinsed with distilled water, dried under air-flow and stored in sealed, sterile Petri dishes until XPS analysis could be carried out.
The XPS analyses were carried out using a VG CLAM 2 spectrometer fitted with a non-monochromated Mg Kα X-ray gun, operated at a power of 100 W. Survey spectra were collected at 80 eV and high resolution C 1s spectra at 20 eV. The dwell time per channel was 0.5 s. The channel spacing for the survey scan was 1 eV and high resolution scan acquisition was 0.05 eV. All XPS spectra were recorded at a take off angle of 60° relative to the surface normal. The pressure in the main UHV chamber was maintained below 1 × 10⁻⁸ mbar for all analyses. Data analysis and charge correction were carried out using CasaXPS software Version 2.2.107 with the C 1s component of the aliphatic hydrocarbon set to 285.00 eV as an energy reference. Relative sensitivity factors for the various elements were empirically derived from a range of polymer standards.
Results and discussion
Static protein adsorption in glass capillaries—ELISA
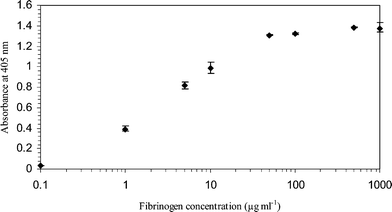 | ||
| Fig. 2 Variations in optical densities of the ELISA product with fibrinogen solution concentrations (1000 µg ml−1, 500 µg ml−1, 100 µg ml−1, 50 µg ml−1, 10 µg ml−1, 5 µg ml−1, 1 µg ml−1 and 0.1 µg ml−1). The fibrinogen solutions were incubated in glass capillaries under static conditions for 2 h at room temperature. All the ELISA experiments were performed in triplicate. Negative control absorbance was 0.05. | ||
The optical density profile in Fig. 3 suggests that fibrinogen adsorbs almost immediately on glass surfaces (approximately 50% of the total adsorption occurs in the first 10 s). A rapid increase occurred in the first 8 min, followed by a more gradual adsorption profile. These results correlate with those seen by Lionello et al.,9 where protein surface concentrations increased as a function of time. Explanations of the protein adsorption-time variation can be made from the diffusion and kinetics transport phenomena. During the initial process of protein adsorption, a large surface area for adsorption was available. Every molecule that hits the surface was assumed to be adsorbed immediately.6 At longer incubation times, the adsorbed molecules increase until a point where the surfaces are partially saturated.
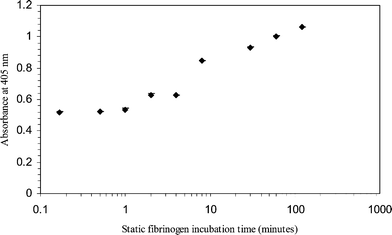 | ||
| Fig. 3 Variations in optical densities of the ELISA product with static fibrinogen solution incubation times. 50 µg ml−1 of fibrinogen solutions (400 ng) were incubated in glass capillaries for different time intervals, i.e. 10 s, 30 s, 1 min, 2 min, 4 min, 8 min, 30 min, 1 h and 2 h. All the ELISA experiments were performed in triplicate. Negative control absorbance was 0.06. | ||
It can also be proposed that during initial contact, protein adsorbs rapidly onto a clean surface but in a random orientation, so the packing of fibrinogen is not at maximum efficiency. At longer contact times, the molecules have sufficient time to re-orientate. This leads to a larger packing efficiency, hence the increase in adsorption. Previous investigations using a quartz crystal microbalance (QCM), and optical waveguide lightmode spectroscopy (OWLS), have shown an increase in fibrinogen adsorbed layer density as a function of time on hydrophilic TiO2 and hydrophobic Teflon-AF.14 The experimental results obtained from our studies on both protein adsorption isotherm and kinetics show a good correlation with models and observations reported from the literature.6,8,9,13,14
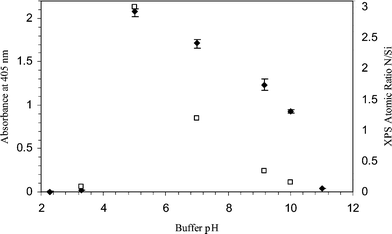 | ||
| Fig. 4 Variations in optical densities of the ELISA product with different buffer pH for ELISA (♦) and XPS (□) analysis. The XPS atomic ratios of nitrogen to silicon which are characteristics of fibrinogen and glass respectively are presented. Fibrinogen solutions (1000 µg ml−1) were prepared in various buffers, i.e. citrate buffer (pH 2.3, pH 3.3), PBS buffer (pH 5.0, pH 7.0) and carbonate buffer (pH 9.2, pH 10.0 and pH 11.0). The fibrinogen solutions were incubated in glass capillaries for 2 h at room temperature under static conditions. All the ELISA experiments were performed in triplicate. Negative control absorbance was 0.06. | ||
In an environment where the pH is higher than 5.5, the protein and surface both have a net negative charge, and we would expect to see adsorption decreasing with higher pH. This is supported by the experimental results (Fig. 4) which illustrate that as the pH conditions of the initial protein adsorption increase towards a pH of 12.0, the optical density of the substrate solution decreases.
At lower pH, we might expect to see electrostatic attraction as the protein becomes positively charged while the surface remains negative. However, the adsorption appears to drop away to negligible levels. One of the issues with using the ELISA technique for detection of biomolecules at interfaces is the specificity of the antibody used to detect the adsorption event. As with most proteins, fibrinogen is designed to operate in physiological environments at a pH of ≈7.4.17 Outside this value, we may see denaturation of the protein. This may result in a loss of antibody-antigen recognition, as the structure of specific epitopes may be damaged, resulting in the antibody being unable to recognise the protein. To some extent this can be overcome by using a polyclonal antibody that is able to detect multiple epitopes on the same protein, but it is a possible cause of a false negative signal in the ELISA.
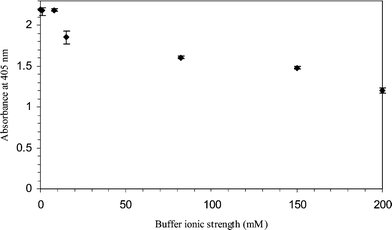 | ||
| Fig. 5 Variations in optical densities of the ELISA product with different buffer ionic strengths. Fibrinogen solutions (1000 µg ml−1) were prepared in pH 7.4 PBS buffer of different molarities, i.e. 200 mM, 150 mM, 82 mM, 15 mM, 8 mM, 1 mM; and distilled water (0 mM). The fibrinogen solutions were incubated in glass capillaries for 2 h at room temperature under static conditions. All the ELISA experiments were performed in triplicate. Negative control absorbance ranges from 0.06–0.075. | ||
At low solution ionic strengths where the screening effects of small ions are negligible, electrostatic interactions play an important role on protein adsorption.19 The shielding of protein and surface charges by increasing the small ions concentrations explains the decrease in optical density at high buffer ionic strengths. Changes in protein structures upon buffer ionic strengths and conformational stability issues may also be an important factor that needs to be taken into consideration.18
Whilst a large volume of literature on non microchannel platforms has been published, the effect of ionic strengths on protein adsorption in microsystems has only been reported by Nicolau et al.8 using a ‘generic’ protein model. Their model predicted the decrease in adsorbed protein film thickness when the buffer ionic strengths were raised. A smaller impact of ionic strengths on protein adsorption as compared to other process parameters was also predicted, which agrees well with our data. Our experimental results fit onto the model developed by Nicolau et al.,8 where an increase in buffer ionic strengths will potentially lower the protein adsorption.
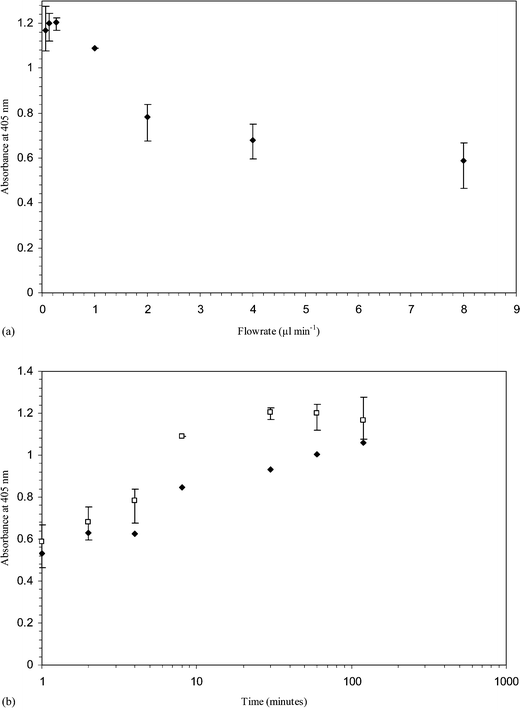 | ||
| Fig. 6 (a) Variations in optical densities of the ELISA product with fibrinogen flow rates (µl min−1). Fibrinogen solutions (50 µg ml−1) were flowed through glass capillaries at different flow rates. The amount of fibrinogen flowing through each capillary was 400 ng. (b) Comparison in fibrinogen adsorption between the dynamic experiment discussed in Fig. 6(a) (□) and static experiment in Fig. 3 (♦). | ||
It is interesting to compare the protein adsorption figures in static and dynamic situations (Fig. 6 (b)). The dynamic experiments were designed so that the surface was exposed to 400 ng fibrinogen in each run. However, when compared with a static experiment where the protein was allowed to rest in the capillary for the same length of time, the dynamic run has a higher rate of adsorption.
Upon static protein adsorption onto surfaces, the depletion of solutions near these surfaces will occur. This concentration gradient drives the diffusion of molecules from the bulk solution.6 At an increased incubation time and due to the relatively fast molecular diffusion in microdimensions, the bulk solution concentrations will also deplete. The dynamic process, however, is constantly bringing fresh solution to the system. Under constant replenishment, the bulk solution concentrations will remain constant, influencing the rate of adsorption. Therefore, at any given time, the rate of adsorption in static conditions is always lower than the dynamic system, as can be seen from Fig. 6. However, we believe that as time was further increased, both the dynamic and static system will eventually reach the same plateau point (the flow rate of protein ≈0, similar to that of static system).
Ortega-Vinuesa et al.20 studied the adsorption comparison of blood proteins between static and dynamic conditions in non microchannel systems. Their studies indicated that lower protein adsorption occurred during non-flow conditions, in line with our current observations. However, the amount of protein adsorbed was reported to be unaffacted by dynamic parameters. In fact, due to the solution depletion phenomena being important in microsystems, Lionello et al.10 proposed two possible ways of renewing the solution and increasing the surface coverage of proteins: sequential fillings of the microsystem and continuous flow.
| Materials | Absorbance at 405 nm | ||
|---|---|---|---|
| Glass capillary | 1.19 ± 0.01 | 1.38 ± 0.01 | 1.28 ± 0.01 |
| Fused silica capillary | 1.08 ± 0.01 | 1.08 ± 0.01 | 1.03 ± 0.01 |
| PEEK tubing | 0.87 ± 0.01 | 1.02 ± 0.01 | 1.06 ± 0.01 |
While a reduction in size from macro to micro dimensions does not usually change the nature of these molecular surface reactions,26 several effects such as the diffusion phenomena and surface to volume ratio become significant. Diffusion, i.e. the movement of particles from a higher to a lower concentration, becomes a dominant transport mechanism upon scaling down and with prolonged incubation times.27 It is therefore not a limiting factor in microscale systems as the protein molecule reaches the surface at a much higher rate than its adsorption. The relationship between average diffusion distance (d), time (t) and diffusion coefficient (D) can be represented as,27
| d2 = 2Dt | (1) |
The time needed for fibrinogen molecules (diffusion coefficient ∼2 × 10⁻⁷ cm2 s−1)28 to diffuse to the surface was calculated to be ∼6 min for a distance of 145 µm, i.e. half of the capillary id.
Conclusions
The effects of process parameters (fibrinogen concentration, incubation time, flow rate, buffer ionic strength and pH) on fibrinogen adsorption onto glass microcapillaries have been demonstrated using an immunoassay method (ELISA). Our results highlight ELISA as a facile technique applicable for probing protein adsorption in microchannels. This relatively simple and explicit technique requires very little complex instrumentation and interpretation. Although the adsorption mechanisms remain unchanged at the microscale, we demonstrate the increased importance of diffusion and high surface area to volume ratio inherent at this scale.The extent of protein adsorption on microfluidic devices can now be predicted from the data attained in this study. This allows us to better understand the process operating boundaries of miniaturised systems. With traditional blocking solutions unable to effectively suppress non-specific adsorption of antibodies on PEEK and fused silica surfaces, future investigations in this area may be beneficial especially towards chip-based immunoassays. The results and understanding gained throughout this study will provide a basis for future research in design and operation of microfluidic devices targeted at separation of complex protein mixtures.
Acknowledgements
The authors would like to sincerely thank the EPSRC for the project funding. PCW also thanks the EPSRC for provision of an Advanced Research Fellowship.References
- K. Huikko, R. Kostiainen and T. Kotiaho, Eur. J. Pharm. Sci., 2003, 20, 149–171 CrossRef CAS.
- J. Khandurina and A. Guttman, J. Chromatogr., A, 2002, 943, 159–183 CrossRef CAS.
- D. Belder and M. Ludwig, Electrophoresis, 2003, 24, 3595–3606 CrossRef CAS.
- H. Watzig, S. Kaupp and M. Graf, Trends Anal. Chem., 2003, 22, 588–604 CrossRef CAS.
- K. C. Dee, R. Bizios and D. A. Puleo, Introduction Tissue-Biomaterial Interactions, John Wiley and Sons Ltd., NJ, 1st edn, 2002, pp. 37–40 Search PubMed.
- Surface and Interfacial Aspects of Biomedical Polymers: Principles of protein adsorption, ed. J. D. Andrade, Plenum Press, New York, 1985, pp. 4–6 Search PubMed.
- M. S. Wagner, S. L. McArthur, M. Shen, T. A. Horbett and D. G. Castner, J. Biomater. Sci., Polym. Ed., 2002, 13, 407–428 CrossRef CAS.
- D. V. Nicolau, Jr, F. Fulga and D. V. Nicolau, Biomed. Microdevices, 2003, 5, 227–233 CrossRef.
- A. Lionello, J. Josserand, H. Jensen and H. H. Girault, Lab Chip, 2005, 5, 254–260 RSC.
- A. Lionello, J. Josserand, H. Jensen and H. H. Girault, Lab Chip, 2005, 5, 1096–1103 RSC.
- J. Jenkins, B. Prabhakarpandian, K. Lenghaus, J. Hickman and S. Sundaram, Anal. Biochem., 2004, 331, 207–215 CrossRef CAS.
- R. W. Paynter and B. D. Ratner, The study of interfacial proteins and biomolecules by X-ray photoelectron spectroscopy, in Surface and Interfacial Aspects of Biomedical Polymers, ed. J. D. Andrade, Plenum Press, New York, 1985, pp. 196 Search PubMed.
- K. Nakanishi, T. Sakiyama and K. Imamura, J. Biosci. Bioeng., 2001, 91, 233–244 Search PubMed.
- J. Voros, Biophys. J., 2004, 87, 553–561 CrossRef.
- D. Forciniti and W. A. Hamilton, J. Colloid Interface Sci., 2005, 285, 458–468 CrossRef CAS.
- W. J. Lokar and W. A. Ducker, Langmuir, 2004, 20, 378–388 CrossRef CAS.
- X. Liu, J. Zhang, L. Song, B. C. Lynn and T. G. Burke, J. Pharm. Biomed. Anal., 2004, 35, 1113–1125 CrossRef CAS.
- J. L. Ortega-Vinuesa, P. Tengvall and I. Lundstrom, Thin Solid Films, 1998, 324, 257–273 CrossRef CAS.
- J. L. Ortega Vinuesa, M. J. GalvezRuiz and R. Hidalgo-Alvarez, Langmuir, 1996, 12, 3211–3220 CrossRef.
- J. L. Ortega-Vinuesa, P. Tengvall, B. Walivaara and I. Lundstrom, Biomaterials, 1998, 19, 251–262 CrossRef CAS.
- S. W. Ha, M. Kirch, F. Birchler, K. L. Eckert, J. Mayer, E. Wintermantel, C. Sittig, I. Pfund-Klingenfuss, M. Textor, N. D. Spencer, M. Guecheva and H. Vonmont, J. Mater. Sci.: Mater. Med., 1997, 8, 683–690 CrossRef CAS.
- B. H. Bijsterbosch, J. Colloid Interface Sci., 1974, 47, 186–198 CrossRef CAS.
- J. D. Andrade, V. Hlady and A. P. Wei, Pure Appl. Chem., 1992, 64, 1777–1781 CrossRef CAS.
- F. Fang and I. Szleifer, Biophys. J., 2001, 80, 2568–2589 CrossRef CAS.
- P. M. Claesson, E. Blomberg, J. C. Froberg, T. Nylander and T. Arnebrant, Adv. Colloid Interface Sci., 1995, 57, 161–227 CrossRef CAS.
- P. S. Dittrich and A. Manz, Nat. Rev. Drug Discovery, 2006, 5, 210–218 CrossRef CAS.
- G. M. Walker, H. C. Zeringue and D. J. Beebe, Lab Chip, 2004, 4, 91–97 RSC.
- V. J. Marder, N. R. Shulman and W. R. Carroll, J. Biol. Chem., 1969, 244, 2111–2119 CAS.
| This journal is © The Royal Society of Chemistry 2007 |