On-chip pumping for pressure mobilization of the focused zones following microchip isoelectric focusing
Christelle Guilloa, James M. Karlinseya and James P. Landers*ab
aDepartment of Chemistry, University of Virginia, McCormick Road, P.O. Box 400319, Charlottesville, VA 22904, USA. E-mail: landers@virginia.edu; Fax: +1-434-243-8852; Tel: +1-434-243-8658
bDepartment of Pathology, University of Virginia Health Science Center, Charlottesville, VA 22908, USA
First published on 17th October 2006
Abstract
Isoelectric focusing (IEF), traditionally accomplished in slab or tube gels, has also been performed extensively in capillary and, more recently, in microchip formats. IEF separations performed in microchips typically use electroosmotic flow (EOF) or chemical treatment to mobilize the focused zones past the detection point. This report describes the development and optimization of a microchip IEF method in a hybrid PDMS–glass device capable of controlling the mobilization of the focused zones past the detector using on-chip diaphragm pumping. The microchip design consisted of a glass fluid layer (separation channels), a PDMS layer and a glass valve layer (pressure connections and valve seats). Pressure mobilization was achieved on-chip using a diaphragm pump consisting of a series of reversible elastomeric valves, where a central diaphragm valve determined the volume of solution displaced while the gate valves on either side imparted directionality. The pumping rate could be adjusted to control the mobilization flow rate by varying the actuation times and pressure applied to the PDMS to actuate the valves. In order to compare the separation obtained using the chip with that obtained in a capillary, a serpentine channel design was used to match the separation length of the capillary, thereby evaluating the effect of diaphragm pumping itself on the overall separation quality. The optimized mIEF method was applied to the separation of labeled amino acids.
Introduction
Isoelectric focusing (IEF) is widely used for the separation of amphoteric species, such as proteins, peptides and amino acids, which are separated on the basis of their isoelectric point (pI)—the pH where the net charge is zero. In addition to its great resolving power, IEF is useful for the analysis of dilute samples, as the separation process is accompanied by a concentrating (focusing) effect. While IEF has traditionally been performed in macroscale slab or tube gel formats, the development of capillary IEF (cIEF) has considerably reduced sample and reagent volumes, and analysis time. More recently, cIEF has been transferred to the microchip format, further reducing sample volumes, cost and analysis time.Much research has targeted the potential of microfluidics for the integration of several processes onto a single device, and the number of reports describing the development and integration of analytical platforms onto microfluidic devices has indeed soared over the past 10 years.1–4 With proteomics analyses traditionally performed in a two-dimensional separation format, the integration of IEF and gel electrophoresis on a microchip has been demonstrated by several groups, where the IEF zones were either electrokinetically injected into the second dimension separation platform5–7 or isolated using valves.8 Microchip IEF (mIEF), as a single separation platform, has also been described by several research groups for the analysis of proteins, using a variety of detection techniques such as LIF,9–11 whole column detection12–14 and, more rarely, UV,15,16 chemiluminescence17 and mass spectrometry.18 More recently, free flow mIEF was also described, where the sample was continuously introduced in the separation channel, allowing higher load capacity and real-time sample profiling.19,20
One characteristic of IEF is that the focused analyte zones must be mobilized past the detection point (unless whole column detection is employed). While hydrodynamic (or pressure) mobilization has been widely applied in the capillary format, EOF or chemical mobilization is most commonly utilized in mIEF. The current report describes a novel approach for accurate mobilization of the focused zones using diaphragm pumping, originally developed by the Mathies group.21,22
While the Quake group was the first to develop PDMS valves for fluidic manipulation (with valves designed in the normally open state),23 the valve design developed a few years later by the Mathies group enabled valving and pumping of fluids using lower actuation pressures. In this system, a hybrid glass–PDMS device is used where diaphragm pumping is achieved using three normally closed elastomeric valves arranged in series. A PDMS membrane is incorporated between two glass layers, one containing fluidic channels and the other valve seats and access channels. The valves open upon application of vacuum, allowing the PDMS to deflect into the valve seat and fluid to be drawn into the valve. Pumping is achieved by opening and closing the valves in series on the millisecond timescale, enabling the fluid to be mobilized from one valve to the next, and eventually to enter the fluidic channel. The flow generated by these valves, while pulsatile in nature, acts effectively to pump fluid towards the other end of the channel and, thereby, mobilizes the IEF zones.
Leveraging the work described by Grover et al.,21 characterization of the flow produced from diaphragm pumping was further investigated for this particular application, taking into account flow resistances in the channels, flow rate linearity along the separation channel and flow rate control during the various steps of the IEF process. Once the experimental conditions were optimized, the mIEF method was applied to the separation of amino acid standards. To our knowledge, this work represents the first example of microchip IEF with pressure-driven on-chip mobilization.
Experimental
Reagents
cIEF gel and ampholyte (pI range 3–10) were obtained from the Beckman cIEF kit (Beckman Coulter, Fullerton, CA, USA). Phosphoric acid, sodium hydroxide, acetic acid, hydrochloric acid, ammonium persulfate, sodium tetraborate, 2-propanol and methanol were purchased from Fisher Scientific (Fairlawn, NJ, USA). L-Lysine, L-histidine, L-tyrosine, polyvinyl alcohol (PVA; 100![[thin space (1/6-em)]](https://www.rsc.org/images/entities/char_2009.gif) 000 molecular weight), 3-(trimethoxysilyl)propyl methacrylate (TMSPM, minimum 98%), fluorescein, and N,N,N′,N′-tetramethylethylenediamine (TEMED) were obtained from Sigma–Aldrich (St. Louis, MO, USA). Potassium cyanide was purchased from Acros Organics (Morris Plains, NJ, USA). All solutions were prepared with nanopure water (Barnstead/Thermolyne, Dubuque, IA, USA). ATTO-TAG™ FQ derivatization reagent (FQ; 3-(2-furoyl)quinoline-2-carboxaldehyde) was purchased from Invitrogen (Carlsbad, CA, USA).
000 molecular weight), 3-(trimethoxysilyl)propyl methacrylate (TMSPM, minimum 98%), fluorescein, and N,N,N′,N′-tetramethylethylenediamine (TEMED) were obtained from Sigma–Aldrich (St. Louis, MO, USA). Potassium cyanide was purchased from Acros Organics (Morris Plains, NJ, USA). All solutions were prepared with nanopure water (Barnstead/Thermolyne, Dubuque, IA, USA). ATTO-TAG™ FQ derivatization reagent (FQ; 3-(2-furoyl)quinoline-2-carboxaldehyde) was purchased from Invitrogen (Carlsbad, CA, USA).Capillary electrophoresis instrumentation
Capillary isoelectrofocusing (cIEF) experiments were performed using a PA/800 MDQ Capillary Electrophoresis (CE) system (Beckman Instruments, Fullerton, CA, USA) fitted with LIF detection (excitation wavelength: 488 nm; emission wavelength: 590 nm). Fused-silica capillary (75 µm i.d. × 365 µm o.d.) was purchased from Polymicro Technologies (Pheonix, AZ, USA). The effective length of the capillary was 20 cm. Data were acquired and analyzed using the 32Karat™ software.Microchip design and fabrication
The hybrid glass–PDMS microdevice used in these experiments mimics the three-layer device described by Grover et al.21 The top and bottom layers are borofloat glass, with channel features etched using standard wet chemical etching.24 The middle layer is a commercially available PDMS membrane (HT-6240, Bisco Silicones, Rogers Corp., Carol Stream, CT, USA) with a thickness of 254 µm. The IEF channel design was patterned into the top layer (Fig. 1A), with an initial width of 50 µm. The separation and anolyte channels were isotropically etched 69 µm and 23 µm deep, respectively. The sample is injected into the separation channel via a discontinuous channel portion where the valves are located, with 0.75 mm wide gaps. Manifold channels and valve seats were patterned into the bottom layer with initial widths of 50 µm and were subsequently etched 50 µm deep. The gate valves had a horizontal diameter of 2 mm and a vertical diameter of 1 mm prior to etching, and the diaphragm valve 3 and 1.5 mm, respectively. Access holes for the top and bottom glass layer were drilled with 1.1 mm “tripple ripple” diamond tipped bits (Abrasive Technology, Lewis Center, OH, USA). After cleaning the patterned side of the fluidic layer with 2-propanol, the chip was assembled by placing the PDMS membrane onto the fluid layer, creating a reversible seal. The patterned side of the manifold layer was then cleaned and brought into contact with the exposed side of the sealed membrane, positioning the valve seats over the gaps in the fluidic channel. The PDMS layer, sandwiched between the two glass layers, acted as a flexible membrane valve. Nanoport reservoirs (Upchurch, Oak Harbor, WA, USA) were placed around the fluidic access holes and bonded to the microdevice using epoxy rings.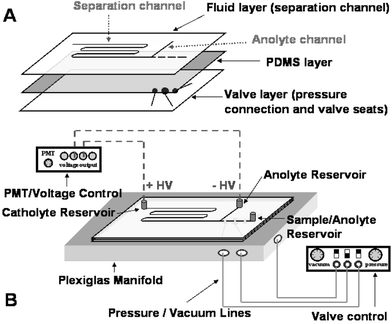 | ||
| Fig. 1 Chip design and experimental set-up. | ||
Experimental set-up and valve actuation
A valve controller was built in-house to control the on-chip pumping. Pressure and vacuum chambers were included to reduce non-pulsatile flow resulting from the external rotary pump, and 1/16 inch plastic tubing was split from each of the chambers to three-way miniature solenoid valves (LHDA 0533115H, Lee Co., Westbrook, CT, USA). The outputs from the solenoid valves were connected to Sure-Lok (McMaster-Carr, Atlanta, GA, USA) fittings on a manifold stage made out of Plexiglas. Channels were machined into the Plexiglas manifold to allow pressure and vacuum from the solenoid valves to actuate the PDMS valves of the microdevice. O-rings were embedded onto the Plexiglas stage corresponding to the access holes on the microchip bottom glass layer. A second piece of Plexiglas was machined to fit above the microdevice, securing it to the manifold stage and sealing the O-rings against the chip valve layer. Platinum electrodes were placed into the fluid layer reservoirs for voltage application. A schematic of the experimental set-up is shown in Fig. 1B. The FQ-labeled analytes were excited with the 488 nm line of an argon ion laser (Model LS200, Dynamic Laser, Salt Lake City, UT, USA) using a conventional confocal detection setup with a 16× objective and a 1 mm pinhole, and the fluorescence emission was filtered with a 510 longpass (Omega Optical, Brattleboro, NY, USA) and detected with a PMT (5784-01, Hamamatsu, Bridgewater, CT, USA). A LabVIEW (National Instruments, Austin, TX, USA) program written in-house controlled the switching of the solenoid valves, the voltage application of two 5 kV power supplies (Spellman, Hauppauge, NY, USA), and the data acquisition.Three valves were implemented in the microchip design in a linear fashion to perform diaphragm pumping along the separation channel. The central diaphragm valve defines the volume pumped, and the two gate valves on either side enable directionality.21 The valves are normally closed, with the PDMS membrane completely sealing the gaps introduced in the channel design and preventing continuous fluid flow. To open or actuate the valve, vacuum is applied to the valve seats located below the gaps via a connection channel patterned into the valve glass layer. The vacuum causes the PDMS membrane to deflect into the valve seat and pull away from the fluid layer at the channel gap, allowing liquid to flow around the channel gap. To close the valve, pressure is applied to the valve seat causing the PDMS membrane to push fluid into the channel and reseal the gap. Valve actuation is defined by the time the valve is programmed to open and close during one pumping cycle. For example, a pump cycle denoted 50/100/50 indicates that the inlet gate is set to open and close for 50 ms, the diaphragm for 100 ms, and the outlet gate for 50 ms. In this work, the valve actuation times were constant for both open and closed states of a pump sequence.
Sample preparation
A mixture of three amino acids was used: L-lysine (1.5 mg mL−1), L-histidine (1 mg mL−1) and L-tyrosine (3 mg mL−1) solutions were prepared in 20 mM borate buffer (pH not adjusted).Amino acid solutions were labeled with FQ according to the manufacturer's guidelines. Briefly, a mixture of 10 µL sample solution, 40 µL 10 mM potassium cyanide and 20 µL 10 mM FQ (dissolved in methanol) was vortexed and allowed to react for at least 1 h, protected from light, in a water bath at 65 °C.
Blank samples consisted of 40 µL 10 mM potassium cyanide and 20 µL 10 mM FQ, and were prepared as mentioned above.
IEF methodology
Catholyte and anolyte solutions were also prepared in cIEF gel and consisted of 20 mM sodium hydroxide and 91 mM phosphoric acid, respectively. The solutions were vortexed and centrifuged at 7000 rpm for 5 min before use.
Results and discussion
Chip characterization
To better characterize the fluidic aspect of the mIEF chip and determine the field strength applied in the channels during IEF, the flow and electrical resistances were determined for each channel using the dimensions described in Table 1. Based on the flow resistance model presented by Attiya et al.,26 and assuming equal viscosity in both anolyte and separation channels, 66% of the flow initiated with the diaphragm pump was directed down the separation channel as opposed to 34% in the anolyte channel. It should be noted that the ratio of flow splitting for pressure mobilization through the device remains constant and is independent of the flow rate. To evaluate the electrical resistance, equal conductivity of solutions in both the anolyte and separation channels was assumed, at least during the initial application of voltage. With an applied voltage of 7.6 kV, the field was distributed over the channels such that the focusing field strength was 275 V cm−1 in the separation channel (as compared to 333 V cm−1 in the capillary). However, this value was not held constant, as the electrical resistance in the channel changes with the focusing of the analytes and subsequent mobilization, which brings anolyte into the separation channel.| Length/cm | Initial width/µm | Depth/µm | Cross-sectional area/µm2 | Hydraulic diameter/µm | Flow resistancea/mm−3 | Electrical resistanceb/µm | |
|---|---|---|---|---|---|---|---|
| a Flow resistance presented as resistance over viscosity.b Electrical resistance presented as resistance over resistivity.c Capillary cross-section. | |||||||
| Capillary | 30 | 75c | 75c | 4418 | 75 | N/A | N/A |
| Separation channel | 22 | 50 | 69 | 10929 | 96 | 2.21 | 20.1 |
| Anolyte channel | 1 | 50 | 23 | 1981 | 36 | 1.12 | 5.1 |
Valve actuation and flow rate linearity
An important aspect of this work was the need to produce stable and linear flow rates for mobilization, comparable to those obtained by hydraulic pressure in the capillary format. The linearity of the flow created from diaphragm pumping was investigated in five different locations along the serpentine channel using a 1 µM fluorescein solution (prepared in water or in cIEF polymer) pumped through the microchannel. Typical breakthrough curves were produced from the fluorescein solution passing the detection points, and the exact breakthrough times were obtained from the first derivative plots of the breakthrough curves. The breakthrough times were plotted against the channel volumes corresponding to the distance between two detection points. As expected with incompressible fluids, the relationship between channel volumes and breakthrough times was found to be linear for both water (y = 0.40x + 0.01; R2 = 0.9998) and cIEF polymer (y = 2.56x + 0.02; R2 = 1.000) solutions, indicating the flow rate to be linear along the serpentine channel. Not surprisingly, the flow rate was considerably faster with water (2.35 ± 0.23 µL min−1, with RSD = 9.9%) than with cIEF gel (0.38 ± 0.01 µL min−1, with RSD = 2.3%), due to the higher viscosity of the polymer solution. This experiment showed that the length of the separation channel (22 cm) did not affect the efficiency and consistency of diaphragm pumping.Flow rate control
Further investigation and optimization of flow rates were performed using the cIEF polymer as the fluid matrix, primarily because flow rate control during diaphragm pumping is crucial to the efficiency and reproducibility of IEF-based separations. It was imperative that the flow rate used to mobilize IEF zones be slow enough to prevent the formation of hydrodynamic flow in the separation channel, which would distort the analyte zones and affect peak shape and overall separation efficiency. Consequently, the initial goal was to match the flow rate generated from diaphragm pumping with the typical flow rates used in IEF separations on commercial CE instruments (typically between 0.03 and 0.08 µL min−1, corresponding to 0.2 and 0.5 psi—or 1.4 and 3.4 kPa—hydraulic pressure, respectively). The first experiment performed was to investigate the effect of valve actuation frequency (actuation times) on flow rate—three actuation times were examined: 50/200/50, 50/100/50, 50/50/50 (Fig. 2). Note that only the diaphragm valve actuation time was varied in these experiments (gate valve actuation time held constant), as this valve defines the volume of solution pumped. Results indicated that the faster the pumping cycle was performed, the slower the flow rate was observed. This is consistent with the observations of Grover et al.,21 where faster actuation corresponds to a reduction in the amount of time the diaphragm valve is opened and closed, resulting in a reduction of the flow velocity (from 0.39 ± 0.00 µL min−1 for 50/200/50, to 0.32 ± 0.00 µL min−1 for 50/50/50). This phenomenon is due to the fact that as the actuation time is decreased, less solution enters the diaphragm valve and, therefore, less solution is pumped into the channel. Varying the valve actuation times, however, did not appear to drastically affect the flow rate generated from diaphragm pumping, which was only reduced by 18%, and was still much faster than the typical flow rates obtained in the capillary format using hydraulic pressure.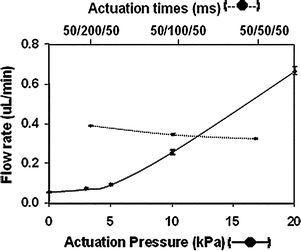 | ||
| Fig. 2 Flow rate variation with actuation times (dashed line) and actuation pressure (solid line). Vacuum and pressure were 60 kPa and 10 kPa respectively for the actuation time study. Actuation vacuum was held at 60 kPa for the actuation pressure study. | ||
The next parameters examined were the magnitude of the pressure and vacuum applied to the PDMS layer to actuate the valves. Although varying the magnitude of the vacuum applied during actuation did not appear to significantly affect the flow rate (data not shown), a decrease in actuation pressure (used to close the valve after vacuum actuation) considerably reduced the flow velocity generated from pumping, as shown in Fig. 2. This behavior was not reported in the original work by Grover et al.,21 and is likely due to the PDMS membrane not returning completely to its original position due to the increased viscosity of the cIEF gel, i.e., not fully resealing the fluid channel, and not purging the diaphragm valve seat completely (into the fluid channel). The use of lower actuation pressures, therefore, led to the displacement of smaller volumes of solution than high actuation pressures, generating slower flow rates. This data also showed that flow rates comparable to the ones obtained in capillary IEF separations could be achieved on the IEF microchip using diaphragm pumping with actuation pressures between 3 and 5 kPa (generating flow rates of 0.07 and 0.09 µL min−1, respectively).
IEF separation of amino acids in capillary and microchip formats
Once the flow rates typically used for zone mobilization using diaphragm pumping on a chip could be achieved, IEF separation of three fluorescently-labeled amino acids (L-lysine, L-histidine and L-tyrosine) was performed and compared with the separation achieved on-capillary (Fig. 3). Although the microchip channel dimensions were considerably different from the capillary dimensions (Table 1), the three amino acids were successfully separated. A few differences were, however, observed between the electropherograms obtained from cIEF (trace A) and mIEF (trace B). The resolution achieved between L-lysine and L-histidine was better in the microchip (Rmicrochip = 2.6, as opposed to Rcapillary = 2.2), whereas resolution between L-histidine and L-tyrosine was better in the capillary (Rmicrochip = 5.0, as opposed to Rcapillary = 14.7). The differences observed in the two electropherograms could be due to several factors, including the difference in glass surfaces (a much cleaner form of glass is used in fused silica capillary than the borofloat glass used for the microchip), the presence of PDMS in the microchip format, where one of the walls in the separation channel is now PDMS versus all glass in the capillary format and, probably more importantly, the difference between microchip and capillary channel dimensions (Table 1). Perhaps most notable is that, during the separation, the electric field was not held constant. The electrical resistance of the main channel changed as the focused zones, which can be treated as regions with low electrical conductivity, were mobilized past the detector and out of the channel, which in turn was progressively filled with anolyte solution (phosphoric acid). This process decreased the net resistance in the main channel and resulted in an increase in the field strength. Admittedly, this phenomenon also occurred in the capillary format, but may not be as obvious in cIEF due to the longer distance between the detection point and the capillary outlet reservoir (typically 10 cm, as opposed to 3 cm in this microchip system). The high electrical resistance provided by the pH gradient was maintained longer in the capillary as the pH gradient had a longer distance to travel to exit the capillary. The difference in field strength (higher in the microchip than in the capillary) resulted in faster migration times for the later peaks with lower pI values in the microchip system.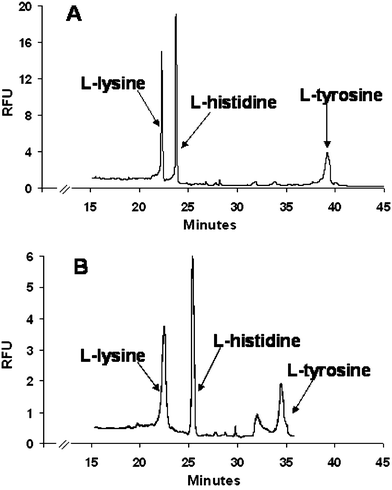 | ||
| Fig. 3 Comparison between IEF separation of amino acids in (A) capillary and (B) microchip. Valve actuation conditions for mobilization in microchip: actuation vacuum: 60 kPa; actuation pressure: 5 kPa. | ||
Most importantly within the framework of this report, the LIF trace obtained with microchip IEF appeared as smooth as the one generated with capillary IEF, indicating that diaphragm pumping did not adversely affect detection or lead to an increase in background noise. The typical pulsatile flow generated with the three-valve pumping scheme used here27 did not appear to be dominant, possibly due to the resistance generated from the viscosity of the gel matrix and the long separation channel (22 cm) which would serve to dampen out any perturbations in the flow. Also, the band-broadening effect that would be expected with the turns in the serpentine channel did not appear to generate effects on the peaks, presumably due to the constant focusing effect on the separated zones.
Effect of mobilization flow rates and channel effective length on separation performance
In IEF, the entire separation channel is initially filled with a mixture of sample and ampholytes. Upon application of voltage, a pH gradient is rapidly established in the separation channel due to the presence of small and highly mobile ampholyte molecules. The analytes of interest (generally larger in size and less mobile than ampholytes) migrate from both ends of the channels (anolyte and catholyte) toward their pI, according to their respective mobility (highly charged molecules will migrate faster than less charged molecules). The mobility of these analytes is also dependent on where they are situated in the pH gradient. While moving toward their pI, given analytes will congregate and concentrate in moving boundaries, with analytes further away from the pI exhibiting a higher mobility than those closer to the pI. While focusing, analytes with a pI more acidic than the pH at the detection point will migrate towards the anolyte (acidic solution) and pass the detector. A “preview” of the sample composition may, therefore, be obtained during the focusing step, although peaks are typically much smaller than those obtained during mobilization due to the small amount of analytes present between the catholyte end of the channel and the detection point (compared to the larger number of analytes present in the entire channel that are detected during the mobilization step). It is also noteworthy that the separation profile obtained during the focusing step is the inverse of the profile observed during the mobilization. These features, which are characteristic of IEF separations and have been reported by other groups,28,29 were also observed in the following experiments.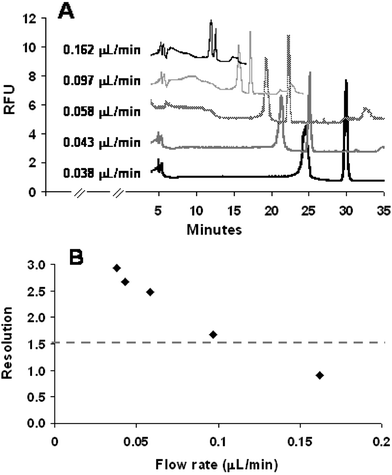 | ||
| Fig. 4 Effect of mobilization flow rates on (A) the overall separation performance and (B) resolution between L-lysine and L-histidine. Valve actuation conditions for mobilization: actuation vacuum: 60 kPa; actuation pressure ranging from 3 kPa to 20 kPa. | ||
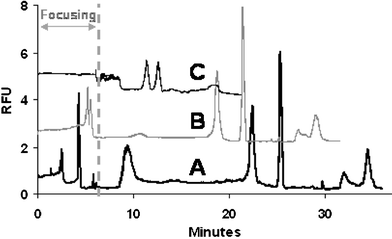 | ||
| Fig. 5 Microchip IEF separations of labeled amino acids obtained using different effective channel lengths: (A) 20 cm, (B) 16 cm, (C) 13 cm. Valve actuation conditions for mobilization: actuation vacuum: 60 kPa; actuation pressure: 5 kPa. | ||
These experiments indicated that mobilization flow rate and effective length of separation channel may be varied to reduce analysis time, but have been shown to affect peak resolution and analyte concentration (i.e. peak height/area) and should be optimized accordingly.
Conclusions
Using on-chip diaphragm pumping to mobilize focused analyte zones, the mIEF method was successfully applied to the separation of three labeled amino acids. The microchip format also displayed several advantages over the capillary format, including the possibility of varying the channel length and the position of the detection window to reduce analysis time. Additionally, the use of diaphragm pumping allows for precise control of zone mobilization, which would make this mIEF method a very powerful first dimension separation in an integrated microdevice. Using this pumping scheme, defined analyte zones could be mobilized and injected into a second dimension separation technique, such as capillary zone electrophoresis (CZE), for more extensive analysis. It should be noted that shorter separation channels could be designed to further reduce analysis time, since separation resolution is not dependent on channel length in IEF. This would likely require a high resistance chamber or passive flow control element27 to reduce the pulsatile flow inherent to diaphragm pumping.Acknowledgements
The authors thank Dr Michael G. Roper and Dr Christopher J. Easley for valuable discussions and Dr Richard Mathies at the University of California, Berkeley, for providing training on the fabrication and operation of the membrane valves.References
- D. R. Reyes, D. Iossifidis, P. A. Auroux and A. Manz, Anal. Chem., 2002, 74, 2623–2636 CrossRef CAS.
- P. A. Auroux, D. Iossifidis, D. R. Reyes and A. Manz, Anal. Chem., 2002, 74, 2637–2652 CrossRef CAS.
- T. Vilkner, D. Janasek and A. Manz, Anal. Chem., 2004, 76, 3373–3386 CrossRef CAS.
- P. S. Dittrich, K. Tachikawa and A. Manz, Anal. Chem., 2006, in press Search PubMed.
- A. E. Herr, J. I. Molho, K. A. Drouvalakis, J. C. Mikkelsen, P. J. Utz, J. G. Santiago and T. W. Kenny, Anal. Chem., 2003, 75, 1180–1187 CrossRef CAS.
- A. Griebel, S. Rund, F. Schönfeld, W. Dörner, R. Konrad and S. Hardt, Lab Chip, 2004, 4, 18–23 RSC.
- Y. Li, J. S. Buch, F. Rosenberger, D. L. DeVoe and C. S. Lee, Anal. Chem., 2004, 76, 742–748 CrossRef CAS.
- Y. C. Wang, M. N. Choi and J. Y. Han, Anal. Chem., 2004, 76, 4426–4431 CrossRef CAS.
- W. Tan, Z. H. Fan, C. X. Qiu, A. J. Ricco and I. Gibbons, Electrophoresis, 2002, 23, 3638–3645 CrossRef CAS.
- Y. Li, D. L. DeVoe and C. S. Lee, Electrophoresis, 2003, 24, 193–199 CrossRef CAS.
- J. Han and A. K. Singh, J. Chromatogr., A, 2004, 1049, 205–209 CrossRef CAS.
- Q. Mao and J. Pawliszyn, J. Biochem. Biophys. Methods, 1999, 39, 93–110 CrossRef CAS.
- J. C. Sanders, Z. L. Huang and J. P. Landers, Lab Chip, 2001, 1, 167–172 RSC.
- T. M. Huang, P. Ertl, X. Z. Wu, S. Mikkelsen and J. Pawliszyn, Sens. Mater., 2002, 14, 141–149 Search PubMed.
- Q. L. Mao and J. Pawliszyn, Analyst, 1999, 124, 637–641 RSC.
- T. M. Huang and J. Pawliszyn, Electrophoresis, 2002, 23, 3504–3510 CrossRef CAS.
- X. Y. Huang and J. C. Ren, Electrophoresis, 2005, 26, 3595–3601 CrossRef CAS.
- J. Wen, Y. H. Lin, F. Xiang, D. W. Matson, H. R. Udseth and R. D. Smith, Electrophoresis, 2000, 21, 191–197 CrossRef CAS.
- Y. Xu, C. X. Zhang, D. Janasek and A. Manz, Lab Chip, 2003, 4, 224–227 RSC.
- D. Kohlheyer, G. A. J. Besselink, S. Schlautmann and R. B. M. Schasfoort, Lab Chip, 2006, 3, 374–380 RSC.
- W. H. Grover, A. M. Skelley, C. N. Liu, E. T. Lagally and R. A. Mathies, Sens. Actuators, B, 2003, 89, 315–323 CrossRef.
- A. M. Skelley, J. R. Scherer, A. D. Aubrey, W. H. Grover, R. H. C. Ivester, P. Ehrenfreund, F. G. Grunthaner, J. L. Bada and R. A. Mathies, Proc. Natl. Acad. Sci. U. S. A., 2005, 102, 1041–1046 CrossRef CAS.
- M. A. Unger, H.-P. Chou, T. Thorsen, A. Scherer and S. R. Quake, Science, 2000, 288, 113–116 CrossRef CAS.
- A. Manz, J. C. Fettinger, E. Verpoorte, H. Ludi, H. M. Widmer and D. J. Harrison, Trends Anal. Chem., 1991, 10, 144–149 CrossRef CAS.
- S. Hjerten, J. Chromatogr., 1985, 347, 191–198 CrossRef.
- S. Attiya, A. B. Jemere, T. Tang, G. Fitzpatrick, K. Seiler, N. Chiem and D. J. Harrison, Electrophoresis, 2001, 22, 318–327 CrossRef CAS.
- C. J. Easley, J. M. Karlinsey, D. C. Leslie, M. R. Begley and J. P. Landers, Science, submitted Search PubMed.
- F. Kilar and S. Hjerten, Electrophoresis, 1989, 10, 23–29 CAS.
- J. M. Cunliffe, Z. Liu, J. Pawliszyn and R. T. Kennedy, Electrophoresis, 2004, 25, 2319–2325 CrossRef CAS.
| This journal is © The Royal Society of Chemistry 2007 |
