ICP-MS-assisted nanoHPLC-electrospray Q/time-of-flight MS/MS selenopeptide mapping in Brazil nuts†
Mihaly
Dernovics
a,
Pierre
Giusti
a and
Ryszard
Lobinski
*ab
aEquipe de Chimie Analytique Bio-inorganique, CNRS UMR 5034, Hélioparc, 2, av. Pr. Angot, F-64053, Pau, France. E-mail: ryszard.lobinski@univ-pau.fr; Fax: +33 559-407781; Tel: +33 559-407755
bDepartment of Analytical Chemistry, Warsaw University of Technology, 00-664, Warszawa, Poland
First published on 20th September 2006
Abstract
A method was developed for the identification of selenium-containing peptides issued from proteins of a Se-rich (82.9 mg kg–1) foodstuff, Brazil nut (Bertholletia excelsa). A sample purification procedure was optimized to cope with the 100-fold excess of sulfur analogues and matrix interferences. It was based on the consecutive size-exclusion fractionation of proteins and tryptic peptides, and enrichment of the Se-containing fractions, prior to nanoHPLC-ES-Q/TOF MS/MS. The characteristic isotopic patterns of selenium compounds (always minor peaks) were detected in ESI mass spectra at retention times precisely indicated by the matrix interference-free, sensitive (DL 1.3 fmol) 80Se detection by ICP collision cell MS in the same separation conditions. The potential of the method was demonstrated by the identification of 15 Se-containing peptides, from which all but one were found to originate from the selenised isoforms of the 2S protein.
Introduction
Selenium is a powerful antioxidant and an essential nutrient element often evoked in the context of protection against heart disease and prevention of cancers, especially of prostate cancer.1,2 Brazil nut, mostly consumed as dessert, has been classified among the foodstuffs that contain the highest level of unadulterated selenium, up to 0.5 g kg–1, which is about 2500 times more than in any other seed or nut.3,4 For this reason, and because of the high Se-bioavailability,5,6 Brazil nut was promoted in the late 1970s in Britain for the supplementation of the everyday diet with selenium,7 and has stayed since then in the focus of Se-related nutritional research. All these reasons make the question of the actual chemical forms of selenium present in Brazil nuts of paramount interest and importance.The first data on selenium speciation in Brazil nuts were reported by the Caruso group who quantified selenomethionine as the principal Se-species.4 Their subsequent attempts of the formal identification of Se-peptides and Se-proteins present turned out to be unsuccessful with the exception of a dipeptide.8,9 Other related reports concerned the production of a Brazil nut laboratory reference material ,10 and identification of selenocystine in Brazil nut simulated gastric digests.11
An insight into the selenium speciation on the molecular level can be obtained by the conventional proteomics approaches with the identification of Se-containing peptides and proteins by MALDI TOF MS and electrospray MS/MS . This approach was first proposed by Ruiz-Encinar et al.12 who purified a number of Se-containing peptides from a Se-rich yeast sample and sequenced them by off-line electrospray tandem MS . ICP MS was used to monitor the fate of selenium during the purification of Se-species; MALDI MS was used to spot (on the basis of the Se isotopic pattern) targets for ES MS/MS sequencing.12 This approach was subsequently validated by more elegant and faster on-line protocols based on either narrowbore HPLC 13 or nanoHPLC 14 which assured a higher level of purity of the Se-compounds at the moment of their electrospray ionization and MS detection.
A major obstacle of adopting this type of approach to Se-speciation in Brazil nut is its much lower (10–25-fold) Se concentration (100 mg kg–1 in Brazil nut against 2000 mg kg–1 in Se-yeast) which enhances the level of interference from the sulfur analogues and other matrix components. Indeed, in high Se-yeast, the concentration levels of Met-containing peptides and their SeMet-analogues are of the same order of magnitude,13 whereas in Brazil nut the expected concentration of Se-containing peptides is ca. two orders of magnitude lower than that of sulfur-containing ones.15 Consequently, the risk of ionization suppression by a S-analogue arriving at the electrospray source at the same moment as a Se-compound is considerably larger. Another difficulty in comparison with the yeast-related studies is that the genome of Brazil nut has not been completely sequenced, which limits the possibilities of manual targeting of ions for CID analysis.
Indeed, a preliminary study showed an inadequacy of standard proteomic approaches based on either matching the measured masses and CID data with libraries of theoretical tryptic peptide sequences from all the known Brazil nut proteins or manual targeting for fragmentation of the Se-analogues of identified sulfur-containing peptides as described recently by McSheehy et al.13 The overall success of these methods was limited and they turned out to be time-consuming. For these reasons new analytical protocols need to be developed.
The objective of this work was to develop an analytical method allowing the identification of low in abundance, Se-containing peptides in Brazil nut, Bertholletia excelsa. This implied (i) the development of a purification protocol of the target (minor) species in order to enhance their ionization and (ii) the development of an efficient data-mining strategy including the detection of Se-related peaks in mass spectra and interpretation of the corresponding MS/MS data. The approach developed was based on the selection of a narrow retention-time range for data mining by detection of selenium with a Se-specific, sensitive and matrix independent technique (ICP MS ). The advantage of ICP MS is that it provides an unambiguous indication of Se-containing peptides located at given retention times and thus narrows the search range, ideally down to a few mass spectra and the relevant MS/MS acquisitions. According to our knowledge, this is the first successful selenoproteomic attempt in a natural food sample at the total level of Se below 100 mg kg–1.
Experimental
Sample and reagents
The sample was a Brazil nut Laboratory Reference Material of which the production and characteristics were described elsewhere.10 This de-fatted and homogenous sample contained 82.9 µg g–1selenium. Reagents were purchased from Sigma-Aldrich (St. Quentin Fallavier, France) unless otherwise stated. An ultra-pure water system from a Milli-Q-Plus system (Millipore, Milford, MA, USA) was used throughout.Procedures
![[thin space (1/6-em)]](https://www.rsc.org/images/entities/char_2009.gif) 000 g for 10 min at 4 °C. The supernatant was decanted and the residue was washed twice with acetone. Finally, acetone was evaporated at room temperature and the residue was suspended in 1.5 ml of 6 M urea in 100 mM TRIS-HCl buffer (pH 7.8). The protein concentration in the solution was determined by the Bradford method using a test kit (BioRad, Marnes-la-Coquette, France) according to the supplier’s manual against a bovine serum albumin standard.
000 g for 10 min at 4 °C. The supernatant was decanted and the residue was washed twice with acetone. Finally, acetone was evaporated at room temperature and the residue was suspended in 1.5 ml of 6 M urea in 100 mM TRIS-HCl buffer (pH 7.8). The protein concentration in the solution was determined by the Bradford method using a test kit (BioRad, Marnes-la-Coquette, France) according to the supplier’s manual against a bovine serum albumin standard.
Results and discussion
Size-exclusion fractionation and MALDI MS analysis of the extracted Brazil nut proteins
Selenium recovered by extraction with NH4Ac buffer from the protein precipitate accounted for more than 70% of the total selenium present. This result is similar to that (66%) reported elsewhere,15 and is likely to correspond to Se incorporated in water-soluble albumins. The insoluble residue was reported to contain 7S vicilins and 11S legumins, typical Brazil nut storage proteins.18A size exclusion –ICP MS chromatogram of the buffer-soluble protein fraction (Fig. 1a) shows a dominant peak (accounting for 92% of the eluted Se) at an exclusion volume corresponding to a globular protein of 10–15 kDa, preceded by a smaller peak. The morphology of the chromatograms of sulfur (34S) and selenium (78Se) is very similar; the comparison of the 34S and 78Se intensities suggests that the amount of selenised proteins is ca. 100 times lower than that of their sulfur analogues. The recovery of selenium from the size-exclusion column was 90%.
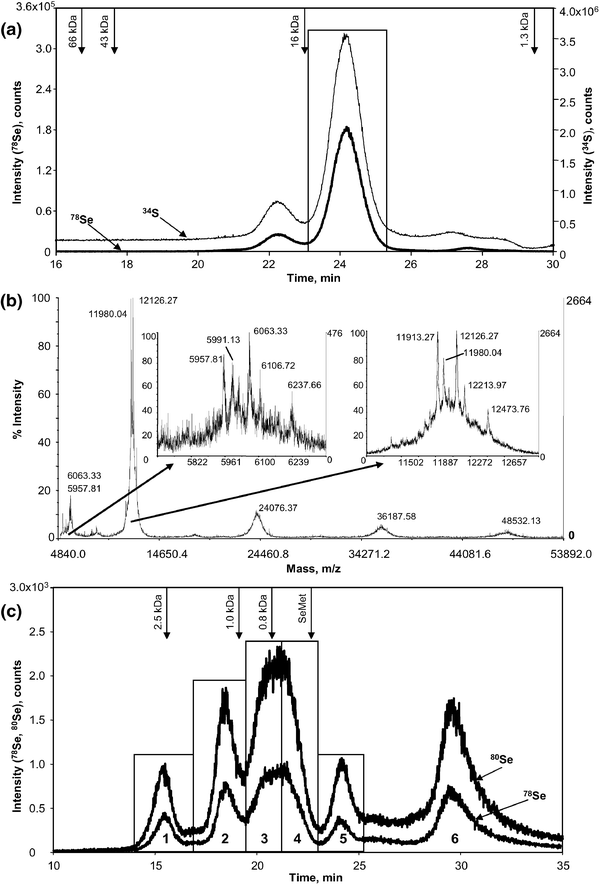 | ||
| Fig. 1 (a) Size-exclusion –ICP MS chromatogram (Superdex 200 column) of the extracted Brazil nut proteins. Regular line: 78Se; thin line: 34S. The rectangular area indicates the fraction collected for further analyses; (b)MALDI-TOF mass spectrum of the fraction indicated in Fig. 1a. The insets show the zooms of the 6 and 12 kDa peaks (doubly and singly charged ions, respectively); (c)size-exclusion –ICP MS chromatogram (Superdex Peptide column) of the tryptic digest (5 kDa cutoff filtered) of the fraction indicated in Fig. 1a. The arrows mark the elution volumes of the calibration standards. The rectangular fractions labelled with numbers were collected for nanoHPLC analyses. | ||
The analysis of the major SEC fraction by MALDI MS (Fig. 1b) revealed a major peak at 12 kDa preceded by a peak at 6 kDa. The fine structure of both the 12 kDa and 6 kDa peaks (cf. the zooms in Fig. 1b) show a number of corresponding peaks, clearly indicating that the 6 kDa peaks correspond to double charged ions. Three peaks of the 12 kDa group (m/z 11980, 12126 and 12214) correspond to isoforms of the water soluble sulfur-rich 2S albumin (National Center for Biotechnology Information (NCBI) entry gi/112754).19,20 The 2S protein is composed of two subunits connected by two disulfide bonds. Both subunits contain several Met and Cys residues in which sulfur can be replaced by selenium. This fact helps to understand the presence of the compounds at 24, 36, and 48 kDa, which are presumed to be covalent dimers, trimers and tetramers of the 12 kDa species, respectively. They are supposed to have been formed as a result of oligomerisation of the 12 kDa species (after isolation by SEC) via oxidation of free cysteine/selenocysteine residues that are present in large numbers.
The MALDI mass spectrum does not reveal the presence of any selenised isoforms as was observed elsewhere for Se-rich yeast.12 The most likely reason for the absence of a Se-related peak in the MALDI spectrum is the insufficient concentration of Se-containing proteins. Only enzymatic digestion and peptide mapping can therefore achieve an insight into the incorporation of selenium.
Tryptic digestion and peptide mapping
NanoHPLC -ES MS/MS analysis of the total tryptic digest of the fraction corresponding to the major size-exclusion chromatographic peak (Fig. 1a) did not allow the detection of any Se-containing peptide. The likely reasons for this include an insufficient concentration and/or a co-elution of another compound competing for ionization. In order to alleviate the signal suppression, an attempt to enrich Se-peptides vs. matrix components by a chromatographic technique using a different mechanism than the reversed-phase separation one was made. Size-exclusion chromatography , reported earlier to provide quantitative recoveries of Se-polypeptides even with dilute buffers (e.g., 10 mM NH4Ac),21 was preferred to cation-exchange LC.Prior to fractionation by SEC the mixture of peptides was filtered using a 5 kDa cut-off filter . The recovery of selenium was above 97%, which suggests advanced digestion of the Se-containing proteins. A size-exclusion -ICP MS chromatogram of the tryptic digest (Fig. 1c) shows 5 fairly well resolved peaks. The corresponding fractions were collected as indicated in Fig. 1c. The fractions (1–5) corresponded to 16% (18.3 ng), 19% (22.6 ng), 26% (30.1 ng), 21% (24.3 ng) and 4% (4.6 ng) of the selenium in the injected sample, respectively. The last fraction (accounting for 13% of injected selenium) corresponding to the total volume of the column was discarded because of the co-elution of reagents used for the tryptic digestion.
The individual fractions were lyophilized and submitted to nanoHPLC -ES MS/MS and nanoHPLC -ICP MS analyses.
ICP MS-assisted data mining
The approach developed here for finding Se-related data in mass spectra is ICP MS-assisted data mining. It is based on the acquisition of a chromatogram with ICP MS detection in exactly the same injection and separation conditions as those used in nanoHPLC -ES MS/MS . This was possible by using a dedicated nanoflow sheathless interface described elsewhere.17 The reversed-phase nanoHPLC -ICP MS chromatograms obtained for the size-exclusion chromatographic fractions of interest (cf. Fig. 1c) are shown in Fig. 2a, 3a, 4a, and 5a. The decrease of the chromatographic load by peptide size-exclusion fractionation made the baseline nanoLC separation possible in the case of several Se-species and allowed the quantification of 5 Se-peptides in the actual injections (88, 250, 583, 581, and 238 pg Se for m/z 1424, 1224, 747, 616, and 485, respectively). These amounts were ca. 100 times smaller than in the study of peptide mapping in Se-rich yeast by Ruiz-Encinar et al.12 | ||
| Fig. 2 Analysis of Fraction 1 (cf. Fig. 1c). (a) NanoHPLC -ICP-MS chromatogram (80Se); (b) Se-derived isotopic patterns detected with ES MS at the RTs corresponding to the apexes of peaks 1 and 2. Full range mass spectra are given in the ESI;†c) TIC (thin line) and XICs of the major monoisotopic ions in Fig. 2b: 1—m/z 2619, 2—m/z 2505. | ||
 | ||
| Fig. 3 Analysis of Fraction 2 (cf. Fig. 1c). (a) NanoHPLC -ICP-MS chromatogram (80Se); (b) Se-derived isotopic patterns detected with ES MS at the RTs corresponding to the apexes of peaks 3–6. Full range mass spectra are given in the ESI;†(c) TIC (thin line) and XICs of the major monoisotopic ions in Fig. 3b: 3—m/z 712.7, 4—m/z 612.7, 5—m/z 483.2, 6—m/z 677.7. The XIC of peptide 5 was set off for clarity of presentations. | ||
 | ||
| Fig. 4 Analysis of Fraction 3 (cf. Fig. 1c). (a) NanoHPLC -ICP-MS chromatogram (80Se); (b) Se-derived isotopic patterns detected with ES MS at the RTs corresponding to the apexes of peaks 7–10. Peptides 8 and 9 can not be unambiguously assigned because of insufficient separation. Full range mass spectra are given in the ESI;†(c) TIC (thin line) and XICs of the major monoisotopic ions in Fig. 4b: 7—m/z 554.2, 8—m/z 525.7, 9—m/z 880.3, 10—m/z 747.2. The XIC of peptide 10 was set off for clarity of presentations. | ||
 | ||
| Fig. 5 Analysis of Fraction 4 (cf. Fig. 1c). (a) NanoHPLC -ICP-MS chromatogram (80Se); (b) Se-derived isotopic patterns detected with ES MS at the RTs corresponding to the apexes of peaks 11–15. Full range mass spectra are given in the ESI;†(c) TIC (thin line) and XICs of the major monoisotopic ions in Fig. 5b: 11—m/z 485.1, 12—m/z 641.2, 13—m/z 616.2, 13′—m/z 632.2, 14—m/z 648.2, 15—m/z 398.1. (11″) denotes the m/z 485 in-source fragment of the Se-peptide m/z 616. Peptide 10 is identical to m/z 747.2 presented in Fig. 4. The XICs of peptides 10, 11, 11″ and 13′ were set off for clarity of presentations. | ||
NanoHPLC-electrospray TOF MS of Se-containing peptides
The search for Se isotopic patterns in retention time ranges where a selenium compound was detected by ICP MS led to the detection of 14 putative Se-containing compounds in size-exclusion chromatographic fractions indicated in Fig. 1c. Out of them, 7 matched the peptides found with the proteomic data mining tools. The other seven were new (previously undetected) peptides (at m/z 2505, 1424, 880, 648, 641, 616, and 485). Extracting the immonium ions of both intact and derivatised selenoamino acids on the most abundant Se-isotopes (e.g., m/z 151.997 for SeMet on 80Se) from the CID data contributed to the list of detected peptides with the one at m/z 795. The 15 Se-isotopic patterns are shown in Fig. 2b, 3b, 4b and 5b, along with the corresponding extracted ion chromatograms (XICs) in Fig. 2c, 3c, 4c and 5c for Fractions 1, 2, 3 and 4 (cf. Fig. 1c), respectively. In the case of peak 11 the relevant XIC showed a double peak (Fig. 5b) at m/z 485 corresponding to an in-source fragment of the m/z 616 peptide (peak 13). A search for oxidized (m/z + 16) peptides revealed the presence of an oxidized form of the m/z 616 peptide eluting together with the m/z 641 peptide. The size of the peptides detected matched the order of SEC elution: from larger peptides identified in Fraction 1 to smaller ones identified in Fraction 4. Note that in contrast to former studies,8,22 the signal-to-background ratio of the electrospray MS detection is at least as high as that of ICP MS owing to the high purity of the Se-species entering the ionization source.The nanoHPLC -ICP MS chromatogram (Fig. 2) shows clearly the presence of well separated Se-containing peptides in Fraction 1 (Fig. 1c). However, only two Se isotopic patterns corresponding to these peaks could be found in the corresponding ES MS spectra. NanoHPLC-ES MS/MS revealed the presence of high molecular mass peptides (M > 1500 Da) in agreement with the elution volume from the size-exclusion column. They were found to originate either from miscleaved or from inherently long tryptic peptides. The removal of these peptides in the size-exclusion step decreased the column load for nanoHPLC of the other fractions. The targeted search for selenised analogues of the GMEPHMSECCEQLEGMDESCR peptide (present in all the detected isoforms of the 2S protein) were partly successful, detecting the completely derivatised (m/z 2619) and one of the mono-derivatised forms (m/z 2505). Therefore, the possible explanation behind the unidentified Se-containing peptides is the inhomogeneous derivatisation of the three Cys residues of the given peptide, ending up in a spread of selenised peptides with different masses, which decreases the concentration of individual species. The analysis of Fraction 1 shows how easily the electrospray ionization of Se-containing peptides can be suppressed in the case of a more complex sample matrix and highlights the advantage of nanoHPLC -ICP MS for sample screening prior to (or in parallel with) electrospray MS.
No selenised peptides were detected in Fraction 5 (accounting for 4% of the total selenium) because of their insufficient concentration.
MS/MS data interpretation and peptide sequencing
The analysis of the MS/MS data indicates that collision induced dissociation (CID) mass spectra could be automatically acquired for more than half of the detected peptides. In terms of automated sequencing, however, the results were much poorer and only one peptide was correctly sequenced in the automated mode.A likely reason for this is the “low” selectivity of the Q1 quadrupole setting. It favours the simultaneous fragmentation of close isotopes of a molecule, especially in the case of multiple charged ions. This makes automated sequencing fail, especially when isomers or post-translational modification are present. However, as the Se-species investigated were minor in comparison with other compounds present, the choice of this setting was found to be crucial to trigger the automatic fragmentation of the Se-compounds and to obtain data for more than one Se-isotope. In most cases, the MS/MS data were interpreted manually. To reach a reliable sequence interpretation, checking for fragment ions from different Se-isotopes is of utmost importance; therefore the instrument was given the right to fragment the different isotopes of a target molecule. The relevant ES/MS and MS/MS spectra for each detected Se-peptide are given in the ESI,† together with the identified sequences.
The data acquisition mode chosen also assured the possibility of specifically sequencing the substitution isomers in cases where more than one Met residue was present in the sequence. The presence of the isomers could sometimes be predicted from the chromatographic peak shape, as can be seen in the case of peptide 13 (Fig. 5c). A wider elution window usually made the acquisition of more than one CID spectra from the same molecule possible, e.g., for peptide 10 (Fig. 4c). Fig. 6 shows an example of the interpretation of MS/MS data for peptide 6 with the 3 possible isomers detected.
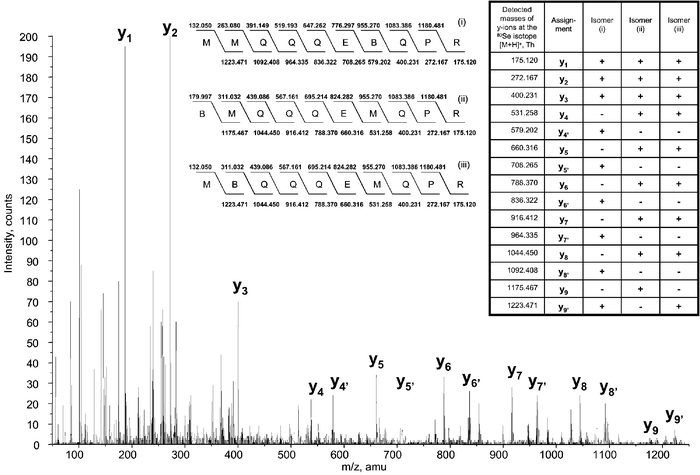 | ||
| Fig. 6 An example of CID mass spectrum showing the presence of three Se/S substitution isomers (assigned as i, ii and iii) for peptide 6, along with the characteristic y-ions detected. (B) denotes SeMet in the sequences presented, (+) and (–) indicates the relevance of y-ions to the given isomer. | ||
Mapping of Se-containing peptides in Brazil nut (Bertholletia excelsa)
The list of all the detected Se-peptides in the sample analyzed is given in Table 1. All but one originated from the isoforms of the 2S protein of Brazil nut. A Se-peptide was found with m/z 880 that did not fit any of the tryptic peptides (including miscleavages) of any of the known Brazil nut proteins. Its supposed sulfur analogue with m/z 832 was detected and sequenced; its sequence DNLSPMR did not match any related entries for Brazil nuts in the proteomic databases.| Peptide no.a | Detected mass (80Se) [M + H]+, Th | Theoretical mass (80Se) [M + H]+, Th | Fraction no. (peptide SEC fractionationb ) | Identified sequencec | Protein; NCBI accession number |
|---|---|---|---|---|---|
| a See Fig. 2, 3, 4 and 5 for the peak labels. b See Fig. 1c. c See the ESI1 for ES/MS and MS/MS spectra. Peptides 1 and 2 were detected as triply charged, while peptides 3–8 and 15 as doubly charged. ‘B’ denotes selenomethionine; ‘J’ denotes selenocysteine; ‘Pyr’ denotes pyroglutamic acid; ‘*’ denotes carbamidomethylation. (#) indicates that identification was based on the mass of the peptide. Isomeric Se-peptides separated by a comma indicate all presented isomers were MS/MS detected. | |||||
| 1 | 2619.75 | 2619.87 | 1 | GBEPHMSEC*C*EQLEGMDESC*R | 2S large subunit; gi/112754, gi/384326, gi/8439533, gi/384327 |
| 2 | 2505.71 | 2505.84 | 1 | GMEPHBSECCEQLEGMDESC*R | 2S large subunit; gi/112754, gi/384326, gi/8439533, gi/384327 |
| 3 | 1424.47 | 1424.51 | 2 | PyrEEC*REQBQR | 2S small subunit; gi/112754 |
| 4 | 1224.37 | 1224.45 | 2 | BQQEEMQPR, MQQEEBQPR | 2S large subunit; gi/112754 |
| 5 | 965.34 | 965.39 | 2 | BAENLPSR | 2S large subunit; gi/384327 |
| 6 | 1354.48 | 1354.51 | 2 | BMQQQEMQPR, MBQQQEMQPR, MMQQQEBQPR | 2S large subunit; gi/384327 |
| 7 | 1107.34 | 1107.42 | 3 | QQBLSHC*R | 2S small subunit; gi/112754, gi/384327, gi/8439533 |
| 8 | 1050.30 | 1050.40 | 3 | QQBLSHCR(#) | 2S small subunit; gi/112754, gi/384327, gi/8439533 |
| 9 | 880.29 | 880.34 | 3 | Unknown, DNLSPBR suggested(#) | Unknown |
| 10 | 747.21 | 747.22 | 3,4 | BMMMR, MBMMR, MMBMR, MMMBR | 2S large subunit; gi/112754 |
| 11 | 485.14 | 485.14 | 4 | BMR or MBR or both(#) | 2S large subunit; gi/112754, gi/384326, gi/8439533 |
| 12 | 641.22 | 641.17 | 4 | EEJ*R(#) | 2S small subunit; gi/112754 |
| 13′ | 632.20 | 632.18 | 4 | Oxidised BMMR or MBMR or MMBR(#) | 2S large subunit; gi/384327, gi/8439533 |
| 13 | 616.17 | 616.18 | 4 | BMMR, MBMR, MMBR | 2S large subunit; gi/384327, gi/8439533 |
| 14 | 648.19 | 648.20 | 4 | BYMR or MYBR or both(#) | 2S small subunit; gi/112754, gi/384327, gi/8439533 |
| 15 | 795.12 | 795.17 | 4 | BBMMR, BMBMR, BMMBR, MBBMR, MMBBR | 2S large subunit; gi/112754 |
The low concentration was the likely reason for the unsuccessful MS/MS identification attempts for five Se-peptides (m/z 485, 641, 648, 880, 1050), despite repeated acquisitions. These peptides were identified on the basis of their accurate mass. Note that the abundance of arginine in Brazil nuts15 offers the possibility of convenient internal mass calibration via the Arg (y1) ion in most CID spectra. Obviously, the identification on the basis of accurate mass requires the presence of the peptide in the database and does not distinguish between the different SeMet–Met substitution isomers. In the case of the m/z 485 Se-peptide, the presence of an in-source fragment with the same mass detected at the elution of the m/z 616 Se-peptide proves indirectly its sequence, BMR or MBR (cf. Fig. 5).
All the Se/S substitutions detected concerned selenomethionine. This could be expected taking into account the by far lower concentration of SeCys than SeMet in Brazil nut.11 Nevertheless, a peptide with the characteristic Se isotopic pattern was observed at m/z 641. Its accurate mass matched that of a carbamidomethylated EECR peptide of the gi/112754 isoform19,20,23 in which the Cys residue would have been replaced by selenocysteine. No valid MS/MS spectrum could be obtained because of the insufficient concentration of the target peptide.
Conclusions
The parallel ICP MS element-specific detection in nanoHPLC simplifies largely data mining in nanoHPLC -ES/MS for minor heteroelement-containing compounds. The invulnerability of the ICP MS detection to co-eluted matrix compounds and the quantitative character of the response provided make this technique attractive in following the fate of selenium compounds in multidimensional microscale chromatographic purification schemes. The purification scheme developed based on simple high yield consecutive size-exclusion chromatographic fractionation of protein and tryptic peptides prior to nanoHPLC -ICP-MS/ES Q-TOF-MS / allowed for the first time selenoproteomic information to be obtained in other than Se-yeast samples.Acknowledgements
M. D. acknowledges a Marie Curie fellowship (MEIF-CT-2003-501297). The help of Dr Regis Grimaud (LEM; UPPA, France) for the access to sample preparation infrastructure is gratefully acknowledged. The authors also thank Dr Hugues Preud’homme for his help with the HPLC-ESI-QTOF-MS experiments.References
- L. C. Clark, J. G. Combs, B. W. Turnbill, E. H. State, D. K. Chalker, J. Chow, K. S. Davis, R. A. Glover, G. F. Graham, E. G. Gross, A. Krongrad, J. L. Lesher, K. Park, B. B. Sanders, C. L. Smith and J. R. Taylor, JAMA, J. Am. Med. Assoc., 1996, 276, 1957 Search PubMed.
- T. C. Stadtman, J. Biol. Chem., 1991, 266, 16257 CAS.
- J. C. Chang, W. H. Gutenmann, C. M. Reid and D. J. Lisk, Chemosphere, 1995, 30, 801 CrossRef CAS.
- S. S. Kannamkumarath, K. Wrobel, K. Wrobel, A. Vonderheide and J. A. Caruso, Anal. Bioanal. Chem., 2002, 373, 454 CrossRef CAS.
- M. W. Chansler, M. Mutanen, V. C. Morris and O. A. Levander, Nutr. Res., 1986, 6, 1419 CAS.
- D. J. Lisk, C. A. Bache, L. A. Essick, C. M. Reid, M. Rutzke and K. Crown, Nutr. Rep. Int., 1988, 38, 183 Search PubMed.
- C. Reilly, Trends Food Sci. Technol., 1998, 9, 114 CrossRef CAS.
- A. Vonderheide, K. Wrobel, S. S. Kannamkumarath, C. B’Hymer, M. Montes-Bayón, C. Ponce de Leon and J. A. Caruso, J. Agric. Food Chem., 2002, 50, 5722 CrossRef CAS.
- S. S. Kannamkumarath, K. Wrobel and R. G. Wuilloud, Talanta, 2005, 66, 153 CrossRef CAS.
- E. T. Bodó, Z. Stefánka, I. Ipolyi, C. Sörös, M. Dernovics and P. Fodor, Anal. Bioanal. Chem., 2003, 377, 32 CrossRef CAS.
- E. Dumont, L. De Pauw, F. Vanhaecke and R. Cornelis, Food Chem., 2006, 95, 684 CrossRef CAS.
- J. R. Encinar, L. Ouerdane, W. Buchmann, J. Tortajada, R. Łobinski and J. Szpunar, Anal. Chem., 2003, 75, 3765 CrossRef.
- S. McSheehy, J. Kelly, L. Tessier and Z. Mester, Analyst, 2005, 130, 35 RSC.
- P. Giusti, D. Schaumlöffel, H. Preud’homme, J. Szpunar and R. Lobinski, J. Anal. At. Spectrom., 2006, 21, 26 RSC.
- T. Chunhieng, K. Pétritis, C. Elfakir, J. Brochier, T. Goli and D. Montet, J. Agric. Food Chem., 2004, 52, 4318 CrossRef CAS.
- Protein Sequencing and Identification Using Tandem Mass Spectrometry, ed. M. Kinter and N. E. Sherman, John Wiley & Sons, New York, 2000, pp. 161–163 Search PubMed.
- P. Giusti, J. Szpunar, R. Lobinski and D. Schaumlöffel, Anal. Chem., 2006, 78, 965 CrossRef CAS.
- S. S. M. Sun, F. W. Leung and J. C. Tomic, J. Agric. Food Chem., 1987, 35, 232 CrossRef CAS.
- F. J. Moreno, J. A. Jenkins, F. A. Mellon, N. M. Rigby, J. A. Robertson, N. Wellner and E. N. Clare Mills, Biochim. Biophys. Acta, 2004, 1698, 175 CAS.
- S. B. Altenbach, K. W. Pearson, F. W. Leung and S. S. M. Sun, Plant Mol. Biol., 1987, 8, 239 CrossRef CAS.
- J. Ruiz-Encinar, M. Sliwka-Kaszynska, A. Polatajko, V. Vacchina and J. Szpunar, Anal. Chim. Acta, 2003, 500, 171 CrossRef CAS.
- T. Lindemann and H. Hintelmann, Anal. Chem., 2002, 74, 4602 CrossRef CAS.
- C. Ampe, J. Van Damme, L. A. B. de Castro, M. J. A. M. Sampaio, M. Van Montagu and J. Vandekerckhove, Eur. J. Biochem., 1986, 159, 597 CrossRef CAS.
Footnote |
| † Electronic supplementary information (ESI) available: ES/MS and MS/MS spectra for each detected Se-peptide. See DOI: 10.1039/b608041c |
| This journal is © The Royal Society of Chemistry 2007 |