A low cost method to estimate dissolved reactive phosphorus loads of rivers and streams
Beat
Müller
*a,
Arno
Stöckli
b,
Ruth
Stierli
a,
Ernst
Butscher
c and
René
Gächter
a
aSwiss Federal Institute for Environmental Science and Technology, Eawag, CH-6047, Kastanienbaum, Switzerland. E-mail: beat.mueller@eawag.ch; Fax: ++41 41 349 21 68; Tel: ++41 41 349 21 49
bDepartment of Construction, Traffic and Environment, Entfelderstrasse 22, CH-5001, Aarau, Switzerland
cOffice of Environment and Energy (uwe), Libellenrain 15, PO Box 3439, CH-6002, Luzern, Switzerland
First published on 21st November 2006
Abstract
Concentration of dissolved reactive phosphorus ([DRP]) in rivers changes periodically (daily, weekly, seasonally) and is dependant on the weather and discharge Q. Accordingly, accurate estimation of the annual DRP load requires intensive sampling if not even continuous monitoring, which is laborious and expensive. We present a new, elaborated low cost technique based on passive samplers (P-traps), describing their design and chemical analysis. P-traps use iron(oxy)hydroxide as a sorbent, are inexpensive, easy to handle, and can be exposed for several months. We compare average DRP concentrations obtained from spot samples and P-traps and discuss the applicability and accuracy of the suggested method to measure annual P loads of rivers characterized by highly variable DRP concentrations.
Introduction
In rivers dissolved reactive phosphorus (DRP) loads originate from various sources, e.g., wastewater treatment plant effluents, elution from soils or avulsion by occasional overland runoff. Consequently, DRP concentrations ([DRP]) fluctuate temporally (diurnally, seasonally) (Reinhardt et al.,1 Pacini et al.2) and are strongly dependent on flow and weather conditions (Gächter et al.3,4). As the flux of phosphate through a river (LΔt), i.e., the P load transported in the time period t1 to t2, equals | (1) |
In this study we present a new, simple, easy to handle, low maintenance, and low cost method for the estimation of DRP loads in streams and rivers. It is based on (1) continuous recording of the water level (discharge) and (2) passive samplers exposed at various levels above the river bed, integrating the DRP concentration when immersed during time periods of weeks to months. Since this method does not require filtration, maintenance can be limited to about one inspection per week. Like the DGT technique (Zhang et al.8), the presented passive samplers capitalize on the affinity of dissolved HPO42− ions with Fe-(oxy)hydroxide surfaces (Sigg and Stumm9).
Materials and methods
Synthesis of Fe-(oxy)hydroxide suspension
600 ml 1 M NaOH (0.6 mol, Riedel-de-Haen, Fixanal no. 38215) were slowly added to a stirred solution of 80.8 g (0.2 mol) Fe(NO3)3·9H2O (Fluka purum p.a. no. 44952) with a peristaltic pump according to Zhang et al.8 The pH was then adjusted to approx. 7 and the precipitate was allowed to settle. The overlying solution was decanted and the precipitate washed three times with nanopure water and adjusted to a final volume of 1000 ml. Due to aging of the Fe-(oxy)hydroxide, the pH decreased within a few days thus preventing coagulation and settling of the particles due to their positive surface charges. pH was then again adjusted to approx. 7 with NaOH.The Fe-(oxy)hydroxide was contaminated with 5 × 10⁻⁷ mol P g−1 Fe(OH)3 (blank value). Its maximum adsorption capacity for phosphate (6.2 × 10⁻⁴ mol P g−1 Fe(OH)3) was determined by titrating suspensions of Fe-(oxy)hydroxide with phosphate and analyzing the Langmuir isotherm (Müller et al.10).
Preparation of P-traps
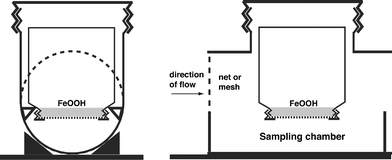
Square powder bottles of transparent PVC with a 200 ml volume and large opening (Semadeni AG, Switzerland, no. 0671) were used with holes of 41 mm diameter drilled in the lids. 20 ml of the vigorously stirred Fe-(oxy)hydroxide suspension was transferred to each bottle, which was then filled to the rim with nanopure water. Either a cellulose acetate membrane filter of 47 mm diameter with 0.45 μm pore size (Whatman, OE 67) or a Nuclepore polycarbonate track-edged membrane filter of 5.0 μm pore size (Whatman, no. 111113) was laid on the water, allowed to adhere and screwed tight with the lid avoiding the entrapment of air bubbles. The bottle was then exposed to the sample solution on upside-down position with the Fe-(oxy)hydroxide settled on the inside of the filter membrane (Fig. 1). Cellulose acetate filters are prone to degradation by microbes, damage by snails or erosion etc. when exposed for several months. Nuclepore filter membranes are much better suited for long-term exposition. | ||
| Fig. 1 Schematic representation of a DRP sampler in a casing made of PVC tubing mounted on a metal plate. A coarse mesh protected the P-trap from drifting debris. In the inverted bottle the FeOOH precipitate settled to the membrane, closing the bottle. If the water level in the river exceeds H, the sampling chamber is continuously flushed with river water. Periodical flushing of the sampling chamber with distilled water (not shown in the sketch) prevents P sampling and drying out of the membrane when the river water level is below H. | ||
Photometric analysis of phosphate from P-traps
After exposition, the P-traps were retrieved and the suspension was allowed to settle to the bottom of the bottles. About 150 ml of the clear, overlying water was decanted and the suspension quantitatively transferred to a 100 ml volumetric flask. 10 ml HCl conc. (12 M, purum p.a. Fluka no. 84426) was added and the precipitate dissolved while stirring and heating to 100 °C. The flasks with the cooled clear brown solution were then replenished to the mark with nanopure water.An increment of the acidic sample (usually 7 ml or 10 ml, max. 70 ml) was transferred to an Erlenmeyer flask and—if less than 70 ml—filled up to 70 ml with 1.2 M HCl. Standards were prepared in 1.2 M HCl solution. The photometric determination of [DRP] with the ammonium molybdate method involving solvent extraction with hexanol was performed according to DEV.11 In short, 1 ml of ascorbic acid (10%, Fluka puriss. p.a. no. 95210) and 2 ml molybdenum tungstate reagent (see below) were added to standards and samples. After 60 min of stirring at room temperature, 15 ml of 1-hexanol (Fluka purum no. 52840) were added and extraction continued while stirring for another 60 min. The organic phase was then carefully separated with a pipette and absorption measured at 720 nm in a 1 cm cuvette. The dynamic range used by the method (the range of the calibration curve) was 0–100 μg P l−1. The mean slope calculated from 16 calibration curves was 4.9 ± 0.64 absorption units μg−1 of phosphate, with correlations of R > 0.99.
The molybdenum tungstate reagent was prepared by dissolving 20 g ammonium heptamolybdate tetrahydrate (Fluka puriss p.a. no. 09880) and 0.4 g sodium tungstate dihydrate (Fluka puriss p.a. no. 72070) in approx. 200 ml of nanopure water under heating. After cooling, 700 ml of 50% sulfuric acid (1 : 1 with water) were added and the solution completed to 1000 ml with nanopure water in a volumetric flask.
A P-stock solution was prepared by dissolving 4.394 g KH2PO4 in 1 l of nanopure water resulting in a solution of 1.000 g P l−1.
Calibration of P-traps
 | ||
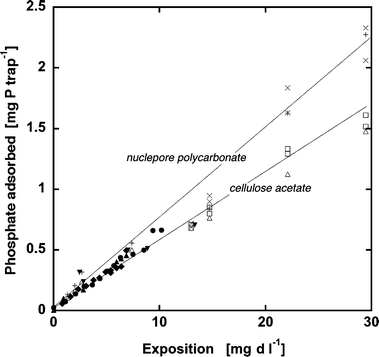
| Fig. 2 Time- and concentration-proportional DRP uptake by P-traps with cellulose acetate membrane filters (0.45 μm pore size) (shapes) and nuclepore polycarbonate filter membranes (5 μm pore size) (crosses). The different shapes indicate results from different experiment batches. | ||
Results and discussion
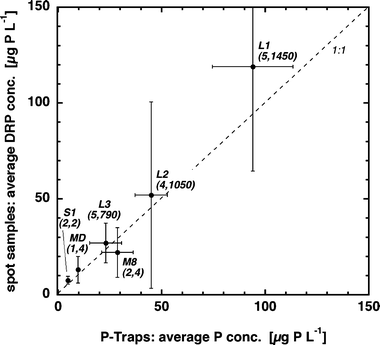
Fig. 3 compares average DRP concentrations determined using passive samplers exposed for several weeks to values obtained from occasional spot samples and FIA readings. Because DRP concentrations in drainage pipes and rivers may change by an order of magnitude within hours—depending on discharge (Fig. 4) and/or time of day (Lazzarotto et al.12—low frequency random spot sampling misses part of such fluctuations. The large vertical error bars indicate the concentration range determined from individual samples. Thus, depending on whether a majority of samples are taken at high or low discharges, the average DRP concentration will be over- or underestimated, respectively. Passive samplers, however, register the total variability of DRP concentrations irrespective of its frequency and amplitude. In spite of this methodological difference and in spite of the flow variability that the various P-traps experienced, the two approaches generated very similar results, indicating that flow velocity had relatively little effect on P-trap performance. Of course, due to incomplete water mixing resulting in concentration heterogeneities within a river and/or analytical inaccuracy, the passive sampler technique is also not error-free. However, as indicated by the smaller horizontal error bars, P-trap based average DRP concentrations seem to be more reliable than values determined as averages of a few randomly collected samples. To further increase its reliability, we recommend exposing and analyzing some replicate P-traps. | ||
| Fig. 3 Comparison of average DRP concentrations determined in four environments (MD, M8, S1 and L) estimated from passive samplers and from averages of spot samples. Error bars indicate standard deviations. Numbers in parentheses state the number of P-trap replicates, and the number of spot samples analyzed. Locations were: MD (Meisterschwander Dorfbach, 7 Sep 01–13 Dec 01); M8 (drainage pipe, 7 Sep 01–13 Dec 01); S1 (drainage pipe, 7 Sep 01–13 Dec 01); L1 (Lippenrütibach, 11 Sep 05–30 Sep 05); L2 (Lippenrütibach, 30 Sep 05–13 Nov 05); L3 (Lippenrütibach, 13 Nov 05–17 Dec 05). | ||
 | ||
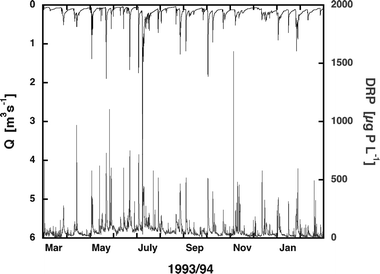
| Fig. 4 Variability of discharge (inversely plotted on top of the figure) and DRP concentration in the river Kleine Aa according to Gächter et al.3 | ||
For statistical reasons the accuracy of an average concentration increases with the number of analyzed spot samples. However, sampling and chemical analyses are manpower-intensive and costly. Even if these procedures can be automated in principal, sophisticated analyzers need frequent control and maintenance (Berg;5 Gächter et al.,4 Kuban et al.13). In comparison, the described P-trap technique integrates the ambient DRP concentration continuously and requires neither filtration, nor maintenance. It is thus a highly potent and cost-effective method to evaluate average DRP concentrations with relatively high accuracy even in rivers with highly variable DRP concentrations.
Passive samplers integrate DRP concentrations proportionally to time, but not to discharge. However, as in rivers DRP concentrations are often positively related to water discharge Q, a significant fraction of the annual DRP load L enters the lake during only a few days with high floods (Pacini et al.,2 Gächter et al.,3 Moosmann et al.7). In such cases the annual load L may be substantially underestimated if expressed simply as the product of the annual average concentration ([DRP]) and the total annual discharge. This is easily demonstrated by modeling a large dataset obtained from the Kleine Aa in which [DRP] and Q were monitored at 35 minute intervals during 1996 (Fig. 4). The roughly 15![[thin space (1/6-em)]](https://www.rsc.org/images/entities/char_2009.gif) 000 spot sample pairs yielded an annual DRP load of 786 kg yr−1 compared to only 399 kg yr−1 if estimated as a simple product of the average concentration (71.1 mg m−3) times the total annual discharge (5
000 spot sample pairs yielded an annual DRP load of 786 kg yr−1 compared to only 399 kg yr−1 if estimated as a simple product of the average concentration (71.1 mg m−3) times the total annual discharge (5![[thin space (1/6-em)]](https://www.rsc.org/images/entities/char_2009.gif) 613
613![[thin space (1/6-em)]](https://www.rsc.org/images/entities/char_2009.gif) 226 m3 yr−1). Since both the [DRP] and the water level H increase with increasing discharge Q, the exposition of an array of P-traps at various water levels H allows the measurement of the average DRP concentrations of individual, predefined discharge classes and, hence, better accuracy of the estimated DRP load (eqn (2)).
226 m3 yr−1). Since both the [DRP] and the water level H increase with increasing discharge Q, the exposition of an array of P-traps at various water levels H allows the measurement of the average DRP concentrations of individual, predefined discharge classes and, hence, better accuracy of the estimated DRP load (eqn (2)).
We used the measurements of the Kleine Aa presented in Fig. 4 to model the accuracy which can be attained by applying three passive samplers at different vertical levels. A relationship between water level H and discharge Q was described by empirical equations containing polynomials of the 3rd power. The dataset was sectioned into three groups where each group yielded the total length of periods Δti during which the discharge Q was within the ranges (i = 1, 2, 3) specified in Table 1, as well as the corresponding average concentrations (DRP1, DRP2, DRP3) and discharge values (Q1, Q2, Q3). Approximating the annual DRP load Lapprox with three P-traps according to
 | (2) |
 | (3) |
| Discharge class | Discharge/m3 s−1 | Exposition time/d | Average conc./mg m−3 | Average discharge/m3 d−1 | DRP load/kg yr−1 | DRP ads./μg trap−1 |
|---|---|---|---|---|---|---|
| 1 | 0.0 < Q < 0.3 | 330 | 55.9 | 11![[thin space (1/6-em)]](https://www.rsc.org/images/entities/char_2009.gif) 901 901 |
219 | 1419 |
| 2 | 0.3 < Q < 0.6 | 27 | 161.8 | 33![[thin space (1/6-em)]](https://www.rsc.org/images/entities/char_2009.gif) 918 918 |
148 | 336 |
| 3 | 0.6 < Q < Qmax | 8 | 417.2 | 96![[thin space (1/6-em)]](https://www.rsc.org/images/entities/char_2009.gif) 163 163 |
321 | 257 |
Samplers—especially the cellulose membranes—are delicate and may be harmed by harsh currents and drifting objects like sand, stones, wood and other debris during storm flow conditions. We therefore suggest protection against mechanical stress. It proved convenient to expose traps in holders of the type shown in Fig. 1. The ground plate can be designed in a suitable way to anchor the trap on the stream bottom. To minimize the risk of a possible data loss we suggest exposing replicate samplers and inspecting them regularly. Furthermore, in case the samplers are installed at various heights where some of them are not permanently immersed in the water, samplers are prone to drying out which causes damaging of the membranes. Periodic refilling of the sampling chamber underneath the membrane with distilled water, e.g. accomplished by a peristaltic pump, can prevent this.
Why didn’t we follow the normal procedure for DGT-like samplers, and encapsulate the Fe salts in a gel as suggested by Zhang et al.?8 Since the diffusive boundary layer above the filter membrane is likely to be thin in turbulent riverine environments and hence its extent does not strongly depend on discharge, the Fe-(oxy)hydroxide was not separated from the membrane by a diffusive gel as in the DGT technique. This minimizes the lag time between variations in [DRP] and P adsorption to the Fe-(oxy)hydroxide. Furthermore, DGT samplers accumulated only 7 μg P if exposed to 0.5 mg l−1 day (Fig. 6 in Zhang et al.8) compared to about 35 μg P adsorbed by passive samplers (Fig. 2). In addition, the linear adsorption maximum was reached at an exposure of 0.5 mg l−1 day compared to 30 mg l−1 day for the P traps. In conclusion, we recommend applying P traps instead of the DGT samplers in riverine environments, because they are five times more sensitive and tolerate a sixty-fold longer exposure time.
Acknowledgements
We thank Tess Edmonds, Tom Gonser and two anonymous referees for their valuable suggestions, which helped considerably clarifying our thoughts and strengthen the manuscript.References
- M. Reinhardt, R. Gächter, B. Wehrli and B. Müller, J. Environ. Qual., 2005, 34, 1251 CrossRef CAS.
- N. Pacini, J. Zobrist, A. Ammann and R. Gächter, Chimia, 1997, 51, 929 CAS.
- R. Gächter, C. Stamm, U. Kunze and J. Blum, Agrarforsch., 1996, 3, 329 Search PubMed.
- R. Gächter, J. M. Ngatiah and C. Stamm, Environ. Sci. Technol., 1998, 32, 1865 CrossRef.
- M. Berg, Gas, Wasser, Abwasser, 1991, 12, 822 Search PubMed.
- B. Müller, M. Reinhardt and R. Gächter, J. Environ. Monit., 2003, 5, 808 RSC.
- L. Moosmann, B. Müller, R. Gächter, A. Wüest, E. Butscher and P. Herzog, Water Resour. Res., 2005, 41(1), W01020 Search PubMed.
- H. Zhang, W. Davison, R. Gadi and T. Kobayashi, Anal. Chim. Acta, 1998, 370, 29 CrossRef CAS.
- L. Sigg and W. Stumm, Colloids Surf., 1981, 2, 101 CrossRef CAS.
- B. Müller, R. Stierli and A. Wüest, Water Resour. Res., 2006, 42(10), W10414 Search PubMed.
- Deutsche Einheitsverfahren zur Wasseruntersuchung (DEV), Wiley-VCH, Weinheim, 1996, vol. 2 Search PubMed.
- P. Lazzarotto, V. Prasuhn, E. Butscher, C. Crespi, H. Flühler and C. Stamm, J. Hydrol., 2005, 304, 139 CrossRef CAS.
- P. Kuban, M. Reinhardt, B. Müller and P. C. Hauser, J. Environ. Monit., 2004, 6, 169 RSC.
| This journal is © The Royal Society of Chemistry 2007 |
