Cloud point extraction for speciation analysis of inorganic tin in water samples by graphite furnace atomic absorption spectrometry
Xiaohong
Zhu
,
Xiashi
Zhu
* and
Baosheng
Wang
Department of Chemistry, Yangzhou University, Yangzhou 225002, P.R. China. E-mail: xszhu@yzu.edu.cn; zhuxiashi@sina.com; Fax: +86-514-7975244; Tel: +86-514-7975244
First published on 1st November 2005
Abstract
A new method based on cloud point extraction (CPE) separation and graphite furnace atomic absorption spectrometry (GFAAS) detection was proposed for the determination of inorganic tin species. When the system temperature is higher than the cloud point extraction temperature (CPT) of the mixed surfactant of p-octyl polyethyleneglycolphenyl ether (Triton X-100) and sodium dodecyl sulfate(SDS), the complex of Sn(IV) with 1-(2-pyridylazo)-2-naphthol (PAN) could be extracted into the surfactant-rich phase, whereas the Sn(II) remained in the aqueous phase. Thus, an in situ separation of Sn(IV) and Sn(II) could be realized. The main factors affecting the cloud point extraction were investigated systematically. Under the optimized conditions, the determination limit for Sn(IV), as low as 0.51 ng mL−1, was obtained by preconcentrating a 10 mL sample solution, and the relative standard deviation (n = 10; c = 1.0 mg L−1) was 3.6%. The proposed method was applied to the speciation analysis of tin in different water samples and the recovery of total Sn was in the range of 98.9–100.7%. In order to verify the accuracy of the method, a certified reference water sample was analysed and the results obtained were in good agreement with the certified values.
Introduction
Tin is a toxic metal which could gather in a human’s body and the tissue of animals.1 Under many situations, tin, especially meals which have a high concentration of tin, brings serious interference to the metabolism of zinc.2 There are many reports of organic tin species analysis,3,4 while inorganic tin species have seldom been reported. As is well known, there are mainly two chemical species of inorganic tin (Sn(II) and Sn(IV)) in environmental samples. Differential toxicities of the different forms of an element have dictated an increasing development and use of analytical determination of the chemical species. The behavior of inorganic tin as a moderately corrosion-resistant metal is of considerable interest due to its important applications in the food and electronic industries.5 Therefore, the analysis and monitoring of inorganic tin species in environmental samples is extremely important.In order to determine trace or ultra-trace inorganic tin species in an environmental sample, a chemical separation and preconcentration step is often necessary prior to analysis. For the speciation of inorganic tin, the separation methods reported in the literature are usually based on solvent extraction,6 liquid chromatography,7 gas chromatography8 and solid extraction.9 However, most of the above-mentioned methods are complicated and time-consuming. Thus, a new, simple separation technique for inorganic tin species is essential.
On heating an aqueous surfactant solution to a particular temperature, the solution will become turbid because of incomplete solubilization. This temperature is named as the cloud point (CP). It is an important characteristic of a surfactant.10 When the temperature is higher than the CP, the micelle solution is obviously separated into two phases. When a complex is in micellar solution, it is entrapped easily in the surfactant-rich phase during separation due to its higher solubility in surfactant. The cloud point extraction method is solvent-free and non-polluting.10 Now, it has been applied to the separation of environmental11–30 and biological31–33 samples with a complicated matrix. The surfactants that are used in cloud point extraction are mostly nonionic surfactants, such as Triton X-114 and PONPE 7.5.13,17,21 In fact, the nonionic surfactant Triton X-100 in cloud point extraction has many advantages. After centrifugal settling, the two phases are easy to separate without cooling by an ice bath. What is more, this reagent is not expensive. In our previous publication, the use of Triton X-100 as a nonionic surfactant in cloud point extraction for the speciation analysis of chromium28,29 and copper30 was researched. CPE in connection with atomic spectrometry can be a powerful analytical technique for metal preconcentration and metal speciation analysis.29 The purpose of this study is to combine CPE with GFAAS for the speciation analysis of inorganic tin in environmental water samples. PAN, as the chelating agent, and the mixed surfactant system of Triton X-100–SDS–NaCl20 as the extractant were used in CPE. Under the optimal conditions, Sn(IV)–PAN was entrapped in the surfactant-rich phase at a temperature higher than the CP, and thus separated from Sn(II), the analyte in surfactant-rich phase was determined by GFAAS with 5.0% Vitamin C solution as the matrix modifier. The developed method was applied to the speciation analysis of tin in tap water and the lake water with satisfactory results.
Experimental
Reagents and apparatus
Standard solutions (1.0 μg mL−1) of Sn(IV), Sn(II), Co(II), Ni(II), Cu(II), Mn(II), Fe(III), Ca(II), Pb(II), Mg(II), Al(III), Bi(III), Cr(III), Zn(II), Cd(II) and Ag(I) were prepared from the high-purity metal. 2.0 × 10⁻³ mol L−1 PAN solution in methanol, 1.0% (m/v) Triton X-100 solution, 0.01 mol L−1 NaOH solution and 30% (w/v) NaCl solution were also prepared. All the chemicals were of analytical reagent grade.A graphite furnace atomic absorption spectrometer (WFX–210, Ruili Analysis Instrument Company, Beijing) was used, as was a hollow cathode lamp for Sn (Beijing Instrument Company,China). The optimized conditions for GFAAS are given in Table 1.
| Element | Sn |
|---|---|
| Wavelength/nm | 286.3 |
| Slit/mm | 1.3 |
| HCL current/mA | 5 |
| Graphite furnace | |
| Dry temperature/°C | 100 (ramp 0 s, hold 20 s) |
| Ashing temperature/°C | 600 (ramp 20 s, hold 15 s) |
| Atomization temperature/°C | 2500 (ramp 0 s, hold 5 s) |
| Cleaning temp/°C | 2750 (ramp 0 s, hold 2 s) |
Procedure for cloud point extraction
10 mL of analytical solution containing Sn(IV) (or Sn(II)), 0.3 mL 0.01 mol L−1 NaOH, 0.2 mL 2.0 × 10⁻³ mol L−1 PAN, 0.5 mL 1.0% (m/v) Triton X-100, 0.5 mL 1.0%(m/v) SDS and 0.5 mL 30% (m/v) NaCl was shaken for 1 min and then placed in a refrigerator at 0 °C, for 30 min. Separation of the phases was achieved by centrifugation at 3500 rpm for 15 min. The bulk aqueous phase was easily decanted, and any residual aqueous phase was removed with a pipette. To decrease the viscosity of the extract and to allow its pipetting, 200 μL of 2.0 mol L−1 HNO3 solution was added to the surfactant-rich phase. The final solution was introduced by conventional aspiration into a graphite furnace atomic absorption spectrometer.The 100 mL tap water samples were distilled 3 times. The 100 mL lake water samples were filtered.
Results and discussion
Selection of CPT of the surfactant system
In cloud point extraction, it is important to choose the correct surfactant. If the cloud point tempeature (CPT) of the surfactant is too low, the phase separation is easy but the concentration efficiency is low because of the low solubility in aqueous solution. If the CPT is too high, the phase separation is difficult because of the high solubility in aqueous solution. Generally, the CPT of the surfactant chosen is lower than 100 °C. At present, there are many methods of changing the CPT of the surfactant system. (1) Adding an electrolyte such as chloride, sulfate, carbonate, etc. When small amounts of NaCl were added to the Triton X-100 system, a decrease in the CP was noted.30 (2) The use of mixed surfactant. The addition of NaCl to the Triton X-100–SDS system reduces drastically the CP, thus allowing phase separation at room temperature, the reason being the secondary effect of the electrolytes, i.e., salting-out.20 In this experiment, a suitable amount of NaCl solution was added to the mixed system of Triton X-100 and SDS, the CPT was lowered to 0 °C and then the phase separation was easier to achieve without heat. More importantly, the decline in sensitivity because of the decomposition of Sn(IV)–PAN when heated was avoided.The effect of NaCl on the CPT of Triton X-100 solution was investigated (Fig. 1). From Fig. 1, the cloud point of Triton X-100 decreases as the concentration of NaCl solution increases. At the same time, the time of back extraction in which the turbid micelle solution became clarified increased. The reason was probably that the inorganic electrolyte made hydrogen bonds with micelles, fracturing and separating hydrophobic groups from the water phase. Hence, 30% NaCl solution was chosen.
 | ||
| Fig. 1 Effect of NaCl concentration on CPT (fixed parameters: 0.3 mL 0.01 mol L−1 NaOH, 0.2 mL 2.0 × 10⁻³ mol L−1 PAN, 0.5 mL 1.0% (m/v) Triton X-100 and 0.2 μg mL−1 Sn(IV)). | ||
The effect of the anion surfactant SDS affecting the CPT of the matrix was investigated. From Fig. 2, it can be seen that the CPT was 80 °C without SDS and about 0 °C with addition of over 0.3 mL of 1.0% SDS. So SDS was used to decrease the CPT and the experimental matrix was put into a refrigerator at 0 °C for 30 min without use of a thermostatic bath.
 | ||
| Fig. 2 Effect of the amount of SDS on CPT (fixed parameters: 0.3 mL 0.01 mol L−1 NaOH, 0.2 mL 2.0 × 10⁻³ mol L−1 PAN, 0.5 mL 1.0% (m/v) Triton X-100, 0.5 mL 30% NaCl and 0.2 μg mL−1 Sn(IV)). | ||
Effect of NaCl
The CPT of the mixed system was decreased as the amount of NaCl solution increased and the extraction efficiency was correspondingly increased. When the amount of 30% NaCl solution was 0.5 mL, the extraction efficiency was at its greatest (Fig. 3). Hence, 0.5 mL of 30% NaCl was chosen. | ||
| Fig. 3 Effect of the amount of NaCl (30% solution) (fixed parameters: 0.3 mL 0.01 mol L−1 NaOH, 0.2 mL 2.0 × 10⁻³ mol L−1 PAN, 0.5 mL 1.0% (m/v) Triton X-100, 0.5 mL 1.0% (m/v) SDS, and 0.2 μg mL−1 Sn(IV)). | ||
Effect of SDS
In this experiment, the amount of SDS affecting the extraction efficiency was investigated (Fig. 4). When the amount of 1.0% SDS was in the range of 0.3–0.5 mL, the extraction efficiency increased. With the addition of SDS, there is more surfactant in the surfactant-rich phase and the solubilization is stronger, so the extraction efficiency is higher. 0.5 mL of 1.0% SDS was chosen.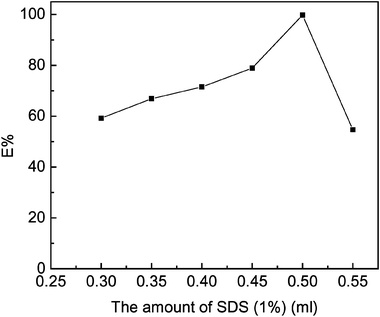 | ||
| Fig. 4 Effect of the amount of SDS on efficiency (fixed parameters: 0.3 mL 0.01 mol L−1 NaOH, 0.2 mL 2.0 × 10⁻³ mol L−1 PAN, 0.5 mL 1.0% (m/v) Triton X-100, 0.5 mL 30% (m/v) NaCl and 0.2 μg mL−1 Sn(IV)). | ||
Effect of Triton X-100
The amount of Triton X-100 not only affected the extraction efficiency but also the volume of surfactant-rich phase. Therefore, the change in the extraction efficiency effected by the changing amount of 1.0% Triton X-100 solution was investigated (Fig. 5). When the amount of 1% Triton X-100 solution was in the range of 0.2–1.0 mL, the extraction efficiency reached the maximum at 0.5 mL and the extraction efficiency dropped on adding more Triton X-100. Hence, in this experiment, 0.5 mL of Triton X-100 solution was chosen. | ||
| Fig. 5 Effect of the amount of Triton X-100 (fixed parameters: 0.3 mL 0.01 mol L−1 NaOH, 0.2 mL 2.0 × 10⁻³ mol L−1 PAN, 0.5 mL 1.0% (m/v) SDS, 0.5 mL 30% (m/v) NaCl, and 0.2 μg mL−1 Sn(IV)). | ||
Effect of NaOH
The pH of the system affected the formation of the complex. As is shown in Fig. 6, after the addition of 0.3 ml of 0.01 mol L−1 NaOH solution the extraction efficiency of Sn(IV) was at its greatest and close to 100%. When the pH of solution was out of the range 6.0–8.5, the formation of the complex Sn(IV)–PAN was difficult, resulting in the decline of the extraction efficiency. Hence, 0.3 ml of 0.01 mol L−1 NaOH solution was chosen. | ||
| Fig. 6 Effect of the amount of NaOH (0.01 mol L−1 solution) (fixed parameters: 0.2 mL 2.0 × 10⁻³ mol L −1 PAN, 0.5 mL 1.0% (m/v) Triton X-100, 0.5 mL 1.0%(m/v) SDS, 0.5 mL 30% (m/v) NaCl, and 0.2 μg mL−1 Sn(IV)). | ||
Effect of PAN
The amount of chelating agent is another important indicator as to whether the chelating action processed completely. As is shown in Fig. 7, on adding over 0.20 mL of 2.0 × 10⁻³ mol L−1 PAN solution the extraction efficiency was the most and close to 100%. Hence, 0.20 mL of 2.0 × 10⁻³ mol L−1 PAN solution in methanol was chosen. | ||
| Fig. 7 Effect of the amount of PAN (fixed parameters: 0.3 mL 0.01 mol L−1 NaOH, 0.5 mL 1.0% (m/v) Triton X-100, 0.5 mL 1.0% (m/v) SDS, 0.5 mL 30% (m/v) NaCl and 0.2 μg mL−1 Sn(IV)). | ||
All the above optimum values were obtained by a univariate method. For this reason, a variable was modified while maintaining the other variables at their constant values (chosen at random). Thus, by maintaining that variable at its optimum value, another was modified.
Interferences
The determination of Sn(IV) in the presence of foreign ions was investigated. With a relative error of less than ±5%, the tolerance limits of the various foreign ions are shown in Table 2. The determination of Sn(IV) was not interfered with by a great deal of K+, Na+, NO3− and Cl−.| Foreign ions | Foreign/Sn(IV) w/w | Foreign ions | Foreign/Sn(IV) w/w |
|---|---|---|---|
| K+ | 1000 | Cu2+ | 5 |
| Na+ | 1000 | Be2+ | 5 |
| NO3− | 1000 | Cd2+ | 5 |
| Cl− | 1000 | Mn2+ | 5 |
| Ca2+ | 500 | Ni2+ | 5 |
| Fe3+ | 10 | Ag+ | 3 |
| Al3+ | 10 | Bi3+ | 3 |
| Zn2+ | 5 | Co2+ | 2 |
Calibration curve, detection limit and precision
The calibration curve was obtained by preconcentration of a suitable amount of Sn(IV) solution, under the optimized experimental conditions, by the proposed method. The linear equation was A = 4.7 × 10⁻⁴ + 0.6027 C (μg mL−1), and the correlate coefficient was R = 0.9990. The calibration line was linear over the range of 0.0–5.0 μg mL−1 Sn(IV). The limit of detection was 0.51 ng L−1 (3σ). The relative standard deviations(RSD) was 3.6% (n = 10, c = 0.2 μg mL−1) and the enhancement factor was 50.Determination of water samples
In order to examine the reliability of the proposed method, it was applied to the speciation of tin in reference water samples spiked with standard Sn(II) at 100.0 μg mL−1. The results are shown in Table 3. The analysed content in reference water samples was in good agreement with the certified value.The proposed method was applied to the determination of speciation of inorganic tin in tap water samples and lake water samples. The results are shown in Table 4. The recovery was the value of recovery of total tin.
| Sample | Added Sn(IV)/μg mL−1 | Measured Sn(IV)/μg mL−1 | Measured Sn(II)a/μg mL−1 | Recovery (Sn)b (%) |
|---|---|---|---|---|
| a Calculated by subtracting Sn(IV) from total Sn. b The recovery of total tin. | ||||
| Tap water 1 | 0 | 0.43 | 0.11 | |
| 1.0 | 1.42 | 0.11 | 99.2 | |
| 2.0 | 2.40 | 0.11 | 98.8 | |
| Tap water 2 | 0 | 0.49 | 0.10 | |
| 1.0 | 1.48 | 0.10 | 99.2 | |
| 2.0 | 2.46 | 0.10 | 98.9 | |
| Lake water | 0 | 1.85 | 0.22 | |
| 1.0 | 2.87 | 0.22 | 100.7 | |
| 2.0 | 3.86 | 0.22 | 100.2 | |
Conclusions
In this paper a new method is proposed for the speciation of inorganic tin by CPE combined with GFAAS with the use of PAN as chelating reagent and a mixture of Triton X-100 and SDS as extractant. The surfactant-rich phase was separated from the solution without use of a thermostated bath, so that the decline of sensitivity because of the decomposability of Sn(IV)–PAN on heating was avoided. The tin in the surfactant-rich phase was determined by GFAAS when 5% vitamin C solution was used as the matrix modifier. The method is characterized by simplicity, rapidity, selectivity, safety, low cost and high preconcentration factor, and is suitable for the speciation analysis of inorganic tin in environmental water samples.References
- M. E. Malla, M. B. Alvarez and D. A. Batistoni, Talanta, 2002, 57, 277 CrossRef CAS.
- X. Zhang, Toxic. Det. Tin Sanit. Res., 2002, 31, 324 Search PubMed.
- J. L. Gomez Ariza, E. Morales, D. Sanchez-Rodas and I. Giraldez, Trends Anal. Chem., 2000, 19, 200 CrossRef.
- M. Azenha and M. T. Vasconcelos, Anal. Chim. Acta, 2002, 458, 231 CrossRef CAS.
- P. E. Alvarez, S. B. Ribotta, M. E. Folquer, C. A. Gervasi and J. R. Vilche, Corros. Sci., 2002, 44, 49 CrossRef CAS.
- S. M. Saleha, S. A. Saida and M. S. El-Shahawi, Anal. Chim. Acta, 2001, 436, 69 CrossRef CAS.
- H. J. Yang, S. J. Jiang, Y. J. Yang and C.-j. Hwang, Anal. Chim. Acta, 1995, 312, 141–148 CrossRef CAS.
- M. Azenha and M. T. Vasconcelos, Anal. Chim. Acta, 2002, 458, 231 CrossRef CAS.
- O. A. Zaporozhets, L. S. Ivanko, I. V. Marchenko, E. V. Orlichenko and V. V. Sukhan, Talanta, 2001, 55, 313 CrossRef CAS.
- A. C. Sahayametal, Can. J. Appl. Spectrosc., 1994, 39, 61 CAS.
- J. Chen and J. Lin, Chin. J. Anal. Lab., 2002, 21(5), 86 Search PubMed.
- R. Carabias-Martínez, E. Rodríguez-Gonzalo, B. Moreno-Cordero, J. L. Pérez-Pavón, C. García-Pinto and E. Fernández Laespada, J. Chromatogr., A, 2000, 902, 251 CrossRef CAS.
- H. Watanabe and H. Tanaka, Talanta, 1978, 25, 585 CrossRef CAS.
- M. F. Silva, L. Fernández and R. Olsina, Anal. Chim. Acta, 1997, 342, 229 CrossRef.
- M. F. Silva, L. Fernández and R. Olsina, Analyst, 1998, 123, 1803 RSC.
- M. Garrido, M. S. Dinezio, A. G. Lista, M. Palomeque and B. B. S. Fernández, Anal. Chim. Acta, 2004, 502, 173 CrossRef CAS.
- L. M. Jamshid and K. Ghasem, Anal. Chim. Acta, 2003, 484, 155 CrossRef CAS.
- L. Giokas Dimostheris, K. Paleologos Evangelos, G. Veltsistas Panayotis and I. Karayannis Miltiades, Talanta, 2002, 56, 415 CrossRef CAS.
- S. A. Kulichenko, V. O. Doroschuk and S. O. Lelynshok, Talanta, 2003, 59, 767 CrossRef CAS.
- C. N. Clésia and M. A. Z. Arruda, Talanta, 2003, 61, 759 CrossRef CAS.
- J. L. Manzoori and A. Bavili-Tavrizi, Microchim. Acta, 2003, 141, 201 Search PubMed.
- P. C García, J. L. Pérez Pavón and C. B. Moreno, J. Anal. At. Spectrom., 1996, 11, 37 RSC.
- D. Jiang, Mod. Instrum., 2003, 9(1), 8 Search PubMed.
- Y. Ma and J. X. Huang, Shanghai Environ. Sci., 2000, 19(7), 319 Search PubMed.
- X. S. Zhu, Z. C. Jiang, B. Hu and M. F. Li, Chin. J. Anal. Chem., 2003, 31(11), 1312 CAS.
- A. Ohashi, H. Ito, C. Kanai, H. Imura and K. Ohashi, Talanta, 2005, 65, 525 CrossRef CAS.
- C.-G. Yuan, G.-B. Jiang, B. He and J.-F. Liu, Microchim. Acta, 2005, 150, 329 Search PubMed.
- X. Zhu, B. Hu, Z. Jiang and M. Li, Water Res., 2005, 39, 589 CrossRef CAS.
- X. Zhu, B Hu and Z. Jiang, Int. J. Environ. Anal. Chem., 2004, 84, 927 CrossRef CAS.
- X. Zhu, X. Zhu, G. Zhang and J. Shu, Chin. J. Spectrosc. Lab., 2005, 22(2), 332 Search PubMed.
- H. X. Yu, B. K. W. Wan, L. N. Chan, M. H. Lam, P. K. S. Lam and L. S. Wang, Anal. Chim. Acta, 2004, 509, 63 CrossRef CAS.
- Y. Ma, Y. Zhe and J. X. Huang, Prog. Chem., 2001, 13(1), 25 Search PubMed.
- J. L. Zhou and K. Yu, Food Sci., 2003, 24(4), 164 CAS.
| This journal is © The Royal Society of Chemistry 2006 |