Determination of selenium isotopic ratios by continuous-hydride-generation dynamic-reaction-cell inductively coupled plasma-mass spectrometry
Daniel
Layton-Matthews
*a,
Matthew I.
Leybourne
b,
Jan M.
Peter
c and
Steven D.
Scott
a
aDepartment of Geology, University of Toronto, Toronto, Canada. E-mail: laytonmatthews@geology.utoronto.ca; Fax: +1 416 978 3938; Tel: +1 416 978 0658
bDepartment of Geosciences, University of Texas at Dallas, Richardson, USA. E-mail: mleybo@utdallas.edu; Fax: +1 972 883 2537; Tel: +1 972 883 2604
cGeological Survey of Canada, 601 Booth Street, Ottawa, Canada. E-mail: jpeter@NRCan.gc.ca; Fax: +1 613 996 3726; Tel: +1 613 992 2376
First published on 29th November 2005
Abstract
The goal of this study was to develop an accessible method for the determination of selenium isotopes within selenium-rich geological samples and examine the influence of sample introduction, instrumental parameters, column separation and the application of standard-sample bracketing for mass bias and drift correction. Quantitative selenium separation and enrichment of samples was achieved by a column separation using 0.2 g thioglycollic impregnated cotton fiber prior to introduction of the sample to an ICP-DRC-MS. 0.6 ml min−1 premixed Ar (95%) + H2 (5%) was favored over CH4 and NH4 as a reaction cell gas and was used within the DRC coupled with optimized DRC rejection parameters RPa (0) and RPq (0.65) to effectively reduce the signal to background ratio of all measured selenium isotopes (m/z 76, 77, 78, 80 and 82). Ion signal intensity of all measured selenium isotopes were increased 100 fold over classic nebulization by mixing of 1% NaBH4 and acidified sample digestions in a membrane-less computer-controlled continuous hydride generator. Transient hydride ion signals were time-averaged for five readings and three replicates to produce an in-run precision (2σ) of ±0.45‰ δ82/76SeMerck (relative to a Merck titrosol ICP-MS standard) and ±0.85‰ δ82/76SeMerck over an 18 month period. In the absence of a selenium isotopic standard, the accuracy of the method was determined using four interlaboratory solutions and five geological standard reference materials covering 0 to −4.5‰ δ82/76SeMerck. Our results indicate excellent reproducibility within method precision. The minimum mass of Se required for isotopic ratio determination was 3 μg (>100 000 cps at m/z 82 and 76).
Introduction
Traditional ICP-MS instruments are prone to spectroscopic interferences caused by isobaric interferences that preclude the routine analysis of selenium isotopes (i.e., m/z 76 and 80). With the advance of dynamic-reaction and gas-collisional cells coupled with conventional ICP-MS, spectroscopic interferences near m/z 80 and 76 can nearly be eliminated.1–3 The low ionization efficiency of selenium within an argon ICP (∼30%) coupled with the reduced signal intensities resulting from the use of a DRC, have led to the application of hydride generation in this study to improve the signal to background ratio (SBR).Selenium concentrations within most crustal reservoirs are low, generally less than 0.1 μg g−1,4 and require isotopic analysis via double spike negative thermal ionization mass spectrometry (N-TIMS)5–15 or standard bracketed hydride-generation multicollector inductively coupled mass spectrometry (HG-MC-ICP-MS)16,17 in light of their superior detection limits, precision and accuracy. Traditional ICP-MS has been applied to isotopic research involving mass-dependent fractionation of light isotopes, such as B where larger relative standard deviation (RSD) of ion intensity result in large but acceptable isotope ratio error (e.g., B; ∼7‰ δ11/10BNASS−1)18 given the large potential mass-fractionation range (e.g., B; >40‰ δ11/10BNASS−1).18 Isotopic ratio analysis of heavier ‘non-traditional’ isotopes by ICP-MS (e.g., Fe, Cu and Zn) have a lower RSD of ion intensity at high masses by traditional ICP-MS and require more precise measurement than possible by traditional ICP-MS due to the relatively small mass-dependent fractionation range (i.e., ∼3‰ δ57/54FeIRMM−014).19 However, recent data indicate a wide range of mass-dependent fractionation within the selenium isotopes4,17,11 (+3 to −8‰ δ82/76SeMerck) and imply earth reservoirs as negative as −15‰ δ82/76SeMerck.16 Furthermore, geological materials that have the greatest potential for isotopic mass-dependent fractionation, such as hydrothermal ore deposits, coal and organic-rich shale, are also Se-rich20–22 (>1 μg g−1) and are amenable to analysis by more traditional ICP-MS techniques. It was therefore the aim of this study to develop and test a more accessible method (>300 Perkin Elmer DRC instruments in North America) for the routine determination of selenium isotope ratios within Se-rich geological samples.
Experimental
Instrumentation
Measurements were preformed on an ELAN 6100 dynamic reaction cell inductively coupled mass spectrometer (Perkin Elmer Life and Analytical Sciences, Inc., USA), equipped with an automated continuous hydride generator (CGH) system developed specifically for this study. Samples, standards and wash solutions were introduced to the instrument via a Perkin Elmer AS-91 autosampler. The experimental conditions for both the Elan 6100-DRC and the CHG system are given in Table 1.| a Pure Ar equivalent | |
|---|---|
| ICP parameters | |
| RF-Power | 1300 W |
| Auxiliary gas flow | 1.3 ml min−1 |
| Plasma gas flow | 13 ml min−1 |
| Dwell time | 10 ms |
| Sweeps/reading | 1 |
| Quadrupole offset | –3 |
| Autolens voltage | 6.5 V |
| Interface cones | Platinum |
| Instrument resolution | 0.5% at 10% peak |
| DRC parameters | |
| Reaction gas | Ar/H2(95–5%) mixture |
| DRC gas flow | 0.6 ml min−1a |
| RPa | 0 |
| RPq | 0.65 |
| CGH parameters | |
| Carrier gas flow (nebulizer gas flow) | 0.8 ml min−1 |
| Reagent | NaBH4 |
| Reagent flow rate | 0.89 ml min−1 |
| Sample acidity | 5.3 wt% HCl; 5.8 wt% HNO3 |
| Sample flow rate | 0.44 ml min−1 |
| Wash time | 300 s |
| Signal duration | 650 s (300 replicates) |
The CHG system was designed and built at the University of Texas at Dallas and is shown in Fig. 1. The gas–liquid separator was assembled using an inverted 500 ml fluorinated ethylenepropylene (FEP) Nalgene™ bottle with a modified perfluoroalkoxy copolymer (PFA) cap. A peristaltic pump (Gilson Minipuls3 Peristaltic, Middleton, WI) was used to deliver the acidified sample and reducing agent to the CHG chamber. Hydride gas was swept using an argon carrier gas into the ICP torch via 4 mm internal diameter FEP tubing. A modified Scott double-pass spray chamber was used between the CHG and ICP torch to dampen pulsation (induced by using a peristaltic pump) of the hydride gas flow to the ICP. Stability of the hydride gas was greatly improved by simultaneously combining sample and reagent within the CHG chamber via a mixing manifold rather than using a traditional mixing coil (cf., Rouxel et al.17). Sample-reagent mixing minimized the pulsation of hydride gas into the ICP torch. Hydride stability was improved by removing waste liquid as a batch at the end of the sample analysis and minimized analyte hydride gas loss via continuous peristaltic pumping, similar to Wolnik et al.23 Memory effects and hydride stability were also improved by not incorporating a microporous polytetrafluoroethylene (PTFE) membrane at the CHG-ICP interface as in previous studies.16,17,24–27
 | ||
| Fig. 1 Schematic diagram of continuous hydride generator (CHG). | ||
Standard solutions and reagents
Ar (99.999% purity, Air Liquide, TX) was used as a plasma gas and Ar/H2 mixture (99.999% purity, 5% H2 95% Ar, Air Liquide, TX), CH4 (99.999% purity, Scott Speciality Gases, TX), and NH4 (99.999% purity, Scott Speciality Gases, TX) were tested in the DRC as potential reaction gases.During digestion of standard reference material (SRM) and preparation of solutions only high purity reagents were used. 18.2 MΩ cm−1 deionized water (Millipore™, Bedford, MA) and high purity quartz/PFA distilled 12.1 M HCl, 15.8 M HNO3, 28.9 M HF, 11.6 M HClO4, 17.4 M HC2H3O2, 18 M H2SO4 (Baseline grade, Seastar Chemicals Inc, Sidney, BC) were used in this study. PFA beakers, centrifuge tubes, and bottles were cleaned by soaking in 2% (v/v) citronox solution (ALCONOX Inc., USA), using a hot (60 °C) ultrasonic bath for 90 min. Labware were then placed in successive baths of 6 M HNO3 and 2 M HNO3 for 24 h, with thorough rinses using 18.2 MΩ cm−1 water between each step. All sample and reagent preparation was conducted in a Class 100 total exhaust fume hood and SRM powder digestions were carried out in a 99.97% HEPA filtered digestion enclosure to minimize contamination.
In generating the hydride gas, a 1% sodium borohydride was used and prepared daily dissolving 3 g of powdered NaBH4 (EMD Chemicals Inc., Gibbstown, NJ) in 250 ml of 0.05% NaOH solution to stabilize the reagent. The NaBH4 solution was then filtered through a microfibre filter (Whatman 934-AH) to remove any undissolved material and transferred to a clean PFA bottle and refrigerated at (4 °C) during use to minimize the decomposition of NaBH4.
In the absence of an international isotopic reference standard for selenium, an ICP-MS standard solution obtained from EMD Chemicals Inc. (Merck Titrosol SeO2 in HNO3) was adopted as a running lab standard as in other studies.15,17 Aliquots of reference materials and lab standards used by Rouxel et al.17 were also used in this study to quantify external precision.
Procedure
Sample preparation
Pulverized samples and standard reference materials (SRM) were digested in PFA digestion vessels (Savillex, Minnetonka, MN) using 28.9 M HF (10 ml), 15.8 M HNO3 (10 ml), and 11.6 M HClO4 (1 ml). Digestion vessels were sealed and placed in an oven at 80 °C for 76 h and taken to incipient dryness at 70 °C on a hotplate. The temperature of the hotplate was monitored via a Pt-thermocouple mounted within an empty PFA digestion vessel. Se degassing17 and loss by evaporation28 was avoided by using a HCl-free decomposition and maintaining the temperature <80 °C. Residue obtained after decomposition was instantaneously sealed after addition of 6 M HCl (10 ml) and placed in an agitating boiling bath for 60 min to quantitatively reduce all selenate(VI) to selenite(IV).29Thioglycollic cotton fiber (TCF) column separation was used to simplify the sample matrix and quantitatively concentrate selenium. TCF was prepared in a similar manner to that described by others.17,30,31 Reduced samples were allowed to cool and were filtered through 25 mm 0.45 μm hydrophobic polytetrafluoroetheylene (PTFE) syringe filters (Aerodisc, Gelman Science, Northampton, UK) that were initially primed using isopropyl alcohol (Omnisolv grade, EMD Chemicals Inc., Gibbstown, NJ). Filtered samples were then diluted to 1 M HCl before being loaded onto 10 ml polypropylene columns (BIORAD, Hercules, CA) previously filled with 0.2 g of TCF. Prior to sample loading, TCF was washed with 18.2 MΩ cm−1 water (5 ml) and conditioned with 6 M HCl (1 ml) followed by 1 M HCl (1 ml)17,30 to bring the TCF to the appropriate pH (<3) for optimum selenium adsorption. Filtered sample solutions were passed through the TCF columns a total of three times at a flow rate of 1.0 ml min−1. Final column eluent was then collected and analyzed via classical nebulization ICP-MS to ensure complete selenium TCF adsorption. Sample-loaded TCF was then eluted with 6 M HCl (2 ml) to remove any residual higher oxidation state species such as Sb.
Se-impregnated TCF was quantitatively removed from the columns and placed in sealed 15 ml PFA centrifuge tubes. 500 μl of 15.8 M HNO3 and 500 μl 18 MΩ cm −1 water were added to the TCF before boiling for 20 min. During this oxidating process, complete desorption of selenium was achieved (see discussion below). Centrifuge tubes were removed and cooled in an ice bath for 10 min before the addition of 3.3 ml of 18.2 MΩ cm−1 water. Samples were centrifuged for 10 min at 3500 rpm. Residual liquid was pipetted into 15 ml polypropylene centrifuge tubes with the addition of 500 μl of 12.1 M HCl.
Continuous-gas-hydride analysis
Reagent and acidified sample were conveyed with a peristaltic pump at 0.89 and 0.44 ml min−1 respectively, into the HG chamber and were simultaneously mixed via a reaction manifold. Carrier Ar (0.8 ml min−1) was introduced over the reaction manifold where reaction hydride and Ar were mixed to fill the HG chamber. Upon mixing of the acidified sample with reagent in the CHG, large quantities of H2 enter the plasma. Preconcentration of the sample, as described above, maintains constant acid strength. Additionally, this serves to avoid mass bias problems that result from changes in sample viscosity and variable matrix conditions.Ten isotopes were monitored in DRC-mode by using the shortest dwell time per AMU (10 ms), resulting in ‘near-simultaneous’ measurement. 300 replicates were collected over a 12 min analysis period (Fig. 2). After analysis, the computer-controlled waste valve was opened and spent reagent, sample and hydride–argon gas was vented into a waste container. Subsequently, the HG chamber and mixing manifold was washed with 10% HNO3 before a second venting of waste.
 | ||
| Fig. 2 CGH response of 10 replicate analyses of 800 ppb Merck standard solution. (A) Raw ion signal response of 10 replicate analyses. Ion signal can be divided into three distinct signal responses, including: gas build-up, stabilization and stable. (B) Time-averaged integration for 350 to 650 s for each replicate over a typical unknown sample run. Error bars indicate 2σ. | ||
The ion signal response of the CGH can be divided into three distinct time-dependent intervals (Fig. 2), namely: hydride build-up, stabilization delay and, stable response. As such, the ion signal for a given sample via CGH is in many respects analogous to the transient signal of LA-ICP-MS analysis.32–34 An initial interval of hydride build-up is required to fill peristaltic tubing and fill the HG with the reacted gases. Following this, a period was required for the ICP to stabilize and for hydride production to become constant. This was followed by an interval of constant and stable ion response in which a time-averaged ion signal was attained for calculation of relative isotopic measurements. Waste drainage at the end of each analysis (rather than continuous waste pumping), resulted in a less pulsed and more stable ion signal. However, continued reagent reaction with sample acid results in production of excess hydrogen23,26,30,35 and suppression of the ion signal with time, which is most notable at the highest intensity m/z 80. Precise computer-controlled timing (±500 ms) of reagent and acidified sample mixing within the CHG allowed accurate replication of samples (Fig. 2b).
For a given sample run (two blanks, five replicate samples, eight Merck standards), a time-stacked integration of the stable ion signal response (flat response between 350 s and 640 s; (Fig. 2a) was used to select the timing of ion signal use.
The isotopic ratios are calculated by standard bracketing time averaged ion response, that involves the measurement of a sample between standards of known composition.36,37 This process/calculation corrects for mass discrimination and instrument drift, assuming sample and standard are closely matrix-matched.38 For samples reported in this study, matrix simplification and Se concentration on TCF ensures matrix-matching of samples and standards. The Se isotopic nomenclature in this paper is reported in ‘delta notation’39 where the isotopic composition is calculated as deviation relative to the Merck standard by:
 | (1) |
Eight procedural blanks measured in this study resulted in low signal intensities (in the hundreds of counts per second m/z 80). These are considered negligible and therefore no procedural blank correction was considered necessary for calculation of selenium isotopic ratios. Instrumental background correction was performed by subtraction of a matrix-matched ultra-low level acid blank signal at m/z of interest that allowed the correction for any fluctuation in the background signal present at m/z 60 (to monitor potential NiO isobaric interferences at m/z 74 and 76), 72, 74, 75, 76, 77, 78, 79, 80, 81, 82, and 83. All isotope ratio data in this study are calculated from background corrected values. Calculations were performed off line in Excel™ spreadsheets using macros for the integration of transient hydride signals. All the uncertainties reported in this paper are expressed as standard deviation (2σ).
Holding capacity and yield rates of TCF
TCF has been shown to have a strong adsorption affinity for selenite(IV) with quantitative isotopic recoveries following digestion in concentrated nitric acid.16,17 The theoretical holding capacity of TCF has been reported by other workers to be in the order of 7–9 mg g−1, with a maximum operational value of 1/3 employed in routine trace element analysis.30,31 Previous workers have only semi-quantitatively documented the required TCF mass and acid strength/volume to provide 100% Se yield. Given the lack of quantification in previous studies and the fact that the TCF was generated in-house, we quantitatively tested both optimal holding capacities and acid strengths to ensure complete Se adsorption and removal and to prevent Se isotope fractionation during sample processing. (Fig. 3). | ||
| Fig. 3 Thioglycollic cotton fiber yield as a function of acid strength and selenium solution concentration. (A) Below 0.1 g of TCF selenium is not quantitatively adsorbed. (B) At elevated concentrations (>3000 ppm Se) and at recommended nitric desorption volumes and strengths (0.1 ml; ref. 17) selenium is not quantitatively removed. | ||
Results confirm that there is a critical balance between the TCF mass used in the column separation, the enrichment of selenium and the volume and strength of nitric acid used to desorb selenium from the TCF. If TCF mass is insufficient, selenium fails to completely adsorb, remaining in the residual liquid passed through the column. If TCF mass is excessive, selenium remains adsorbed onto the TCF during the digestion of the cotton and if nitric acid concentration is too weak, selenium remains adsorbed at high TCF masses. However, at higher nitric volumes and concentrations, selenium is fully de-adsorbed, but stronger acid strength suppresses the ion signal in the ICP. Using 0.2 g TCF and 0.5 ml of 15.8 M HNO3 during TCF digestion, selenium recovery is ∼98 to 101% with minimal signal suppression (∼14%) (see discussion below). By using this TCF mass and concentration of nitric acid volume in the digest, maximum TCF holding capacity and recovery is 6.7 mg g −1, which is lower than previously reported30,31 (Fig. 3).
Influence of HCl and HNO3 on the selenium ion signal
Changing TCF acid digestion volume from 0.1 ml (15.8 M HNO3) to 0.5 ml results in a change in the final running solution from 1.1% to 5.8 wt% HNO3. Previous workers23,40–43 have observed that variation in the acid concentration of the running solution and calibration standards can radically alter the intensity of the ion signal (also known as a matrix effect) by classic nebulization ICP-MS. However, it was unclear how variation in acid concentration would affect analysis by CHG-ICP-DRC-MS. Therefore, an experiment was devised to investigate ion signal suppression of the Merck Se standard with increasing HNO3 and HCl concentrations (Fig. 4). We found that variation in HNO3 concentration from 0.4 to 11 wt% resulted in signal suppression from 3% to 26%, and signal suppression of samples of 14.5%, which given the intensity of the Se signal (∼1 × 10⁶ cps) was deemed acceptable. Similar signal suppression for HCl at 5.3 wt% (1.7 mol l−1) was observed, where signal suppression is approximately 12%. It is also noteworthy that varying the HCl concentration had a minimal effect on the signal suppression (up to ∼10 wt%) when compared to the signal suppression for increasing HNO3 concentration. These trends are consistent with those of other elements analyzed by standard nebulization ICP-MS.40,41 | ||
| Fig. 4 Dependence of the selenium signal at m/z 80 (1000 (μg Se) l−1) normalized to 0.3 and 0.4 wt% on the concentrations of HCl and HNO3, respectively. | ||
Influence of reaction gas and DRC settings on the selenium signal
Considerable instrumental development and research has been devoted to the reduction of polyatomic interferences via collisional processes and ion–molecule reactions in ICP-MS.44–48 Despite the numerous potential interferences, the Ar2+ interference at m/z 76, 78, and 80 are the most important for this study. The dominant interferences of interest that reside near m/z 80 are summarized in Table 2.| Isotope | Natural concentration (at.%) | Potenial Interference |
|---|---|---|
| a Compiled from ref. 2 and 50. | ||
| 74 | 0.89 | 37Cl2+,40Ar34S+, 74Ge, 148Sm2+, 148Nd2+ |
| 76 | 9.36 | 36Ar40Ar+, 38Ar38Ar+, 40Ar36S+, 31P214N+, 152Sm2+, 152Gd2+ |
| 77 | 7.63 | 40Ar37Cl+, 40Ar36Ar1H+, 154Sm2+,154Gd2+ |
| 78 | 23.78 | 38Ar40Ar+, 31P216O+, 156Gd2+ |
| 80 | 49.61 | 40Ar2+, 1H79Br+, 80Kr+, 160Dy2+, 160Gd2+ |
| 82 | 8.73 | 12C35Cl2+, 34S16O3+, 82Kr+, 40Ar21H2+, 1H81Br+, 165Ho2+, 164Dy2+,160Er2+ |
It is generally agreed that in the ICP-DRC-MS the most important and abundant type of reactions that occur when using a reaction gas are those involving charge transfer:47–49
 | (2) |
It was found that a premixed Ar (95%) and H2 (5%) mixture was an effective reaction gas for the reduction of Ar dimer at m/z 76 (Ar40 + Ar36) and 80 (Ar40 + Ar40). Efficiency of the reduction of the Ar dimer to background levels was improved using Ar/H2 over CH4 and NH4, and a flow rate of 0.5 ml min−1† Ar/H2versus 0.75 ml min−1.† (Fig. 5). However, at elevated gas flow rate (>1 ml min−1) for Ar/H2, produced a greater decrease in the intensity of the ion signal when compared to CH4.
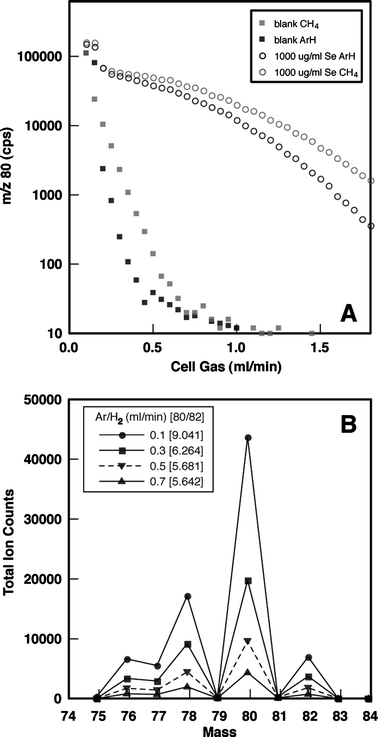 | ||
| Fig. 5 Ion signal response to different reaction gases and varied gas-flow rates. (A) Signal response at m/z 80 for CGH-ICP-DRC-MS analysis of 800 ng ml−1 Se standard (Merck). (B) Response of total ion count over varied Ar/H2 gas flow rates. Solid lines indicate non-acceptable isotopic ratios, whereas dashed line indicate acceptable isotopic ratios, within theoretical instrumental bias near m/z 80. | ||
Because of the high atomic percent and volume of hydrogen in CH4 (25 at.% @ 99.9999% v/v) versus the Ar (95% v/v) H2 (5% v/v) (2.5 at.% @ 5% v/v), SeH+ is created at a much higher efficiency within the DRC using CH4 as the reaction gas. Because charge transfer is a molecular reaction, reducing the gas flow rate of CH4 reduces the effective DRC reactions and thus increases BSR, but has little effect on the SeH+ production. Analyzing a 1000 ng ml−1 Merck Se solution by DRC using CH4 reaction gas results in ∼500 000 cps (m/z 80) and 70 000 CPS (m/z 81) and gives a 14% SeH+ yield, whereas using CH4 as a reaction gas results in ∼2000 cps (m/z 81) resulting in 0.4% SeH+ generation using an Ar/H2 mixture.
Residual 80Se ion signal after running samples using CH4 as a reaction gas was observed and required protracted wash times to lower 80Se to background values. This residual 80Se ion signal was not observed using Ar/H2 or NH3 as a DRC gas. Since other isotope intensities for Se (i.e., 76Se and 82Se) did not demonstrate this pattern of elevated SBR with CH4, memory-effects do not appear to be the cause, but rather imply unresolved secondary ions as suggested by Hattendorf and Gunther.48
The DRC is essentially a quadrupole ion guide and as such, the efficiency of charge transfer reactions can be optimized for the discrimination against unwanted reaction products by the bandpass and gas flow settings within the DRC.46,47,49 The bandpass is adjusted by the rejection parameters RPa and RPq to achieve optimum transmission for the analyte ions in question.
The rejection parameter q (RPq) of the DRC quadrupole in this study was optimized for the Merck running standard prior to each analytical run, in order to achieve a close match of the measured selenium mass spectrum with Merck TIMS selenium isotope values15 (Fig. 6). At low RPq ∼0.3 the measured m/z intensities did not match the Merck selenium isotope values and only when the RPq value was increased to 0.6–0.7 did the measured signal intensities more closely match the Merck selenium isotope abundance. By using RPq ∼0.65 (variation of ±0.05 was recorded between runs), a favorable mass cut-off in the DRC is achieved and a reduction in the isobaric interferences followed the gas phase chemical reactions with the DRC gas Ar/H2. However, the sensitivity decreased and thus increased the limit of detection. It was found that on adjusting the rejection parameter (RPa) by small increments (i.e., 0.01) the ion signal quickly approached 0, such that for this study RPa was kept at zero.
 | ||
| Fig. 6 The effect of the RPq DRC settings on the selenium m/z 82, 80, 78, and 76 for 1000 ng ml−1 Merck solution. | ||
Potential m/z interferences and correction
Isobaric interferences
Despite the effective removal of Ge by TCF separation, m/z 72 was monitored during analysis and anomalous 76Ge was corrected by using a 72Ge/76Ge natural isotopic value corrected for instrumental bias of 0.2763.
Polyatomic interferences
Hydrogen interferences within the DRC
Internal precision
At the beginning, middle and end of each sample run the ‘in-house’ Merck standard was bracketed against itself to quantify within-run precision, but also to quantify internal reproducibility over an 18 month period. Within-run reproducibility of the Merck solution was ±0.45 per mille (n = 3; 95% confidence level) for the δ82/76SeMerck ratio. However, the greater scatter in the measured m/z 80 results in a larger uncertainty in the delta δ80/76SeMerck of ±0.83 per mille (n = 3; 95% confidence level). Because the precision of this technique will degrade with smaller signal strengths, as a direct product of counting statistics, the minimum mass of Se used was 3 μg (>100 000 cps at m/z 82 and 76 for 5% RSD), which is significantly higher than HG-MC-ICP-MS (>5 ng17) and N-TIMS (>500 ng12), but is two-orders of magnitude lower than traditional gas source mass spectroscopy (∼100 μg57).Analysis of standard solutions
External accuracy
To quantify the accuracy of the CHG-ICP-DRC-MS, four Se solutions were obtained from O. Rouxel (used in Johnson et al.14 and Rouxel et al.)17 and have been measured relative to the ‘in-house’ Merck standard (Table 3). These solutions have been analyzed by N-TIMS and MC-ICP-MS and cover a moderate range of δ82/76 values (0.0 to −4.5 per mille). Results indicate, within analytical error, that Se isotope analysis by CHG-ICP-DRC-MS reproduces isotopic ratios measured by other techniques and that the ‘in-house’ Merck standard is isotopically identical to those used in other studies.15–17,58| Sample | Description | Se/μg g−1 | Sample mass/mg | δ 82/76SeMerck | δ 80/76SeMerck | δ 82/78Merck |
|---|---|---|---|---|---|---|
| a Data from Rouxel et al.17 b Data from Rouxel et al.17 but calculated from δ80/76 relative to MH495. c This study. d Calculated from linear mass fractionation law (e.g. Criss59). e Calculated from five replicate digestions. f Provisional value (CCRMP). | ||||||
| SRM | ||||||
| SGR-1 | Green River shale | 3.5 | −1.08a | −0.68a | ||
| 250 | −1.0c (n = 3) | −0.5c (n = 3) | −0.4c (n = 3) | |||
| GXR-4 | Copper mill feed | 5.6 | −1.29 a | −0.88a | ||
| 250 | −1.4c (n = 3) | −1.0c (n = 3) | −1.0c (n = 3) | |||
| MAG-1 | Marine mud | 1.16 | −1.42a | −0.76a | ||
| 250 | −1.2ce (n = 2) | −0.9c (n = 3) | −0.7c (n = 3) | |||
| SCo-1 | Shale | 0.89 | −1.57a | N/A | −0.92a | |
| 250 | −1.8ce (n = 2) | −1.4c (n = 2) | −0.9c (n = 2) | |||
| SRM (provisional) | ||||||
| Canyon Diablo Triolite | Meteorite | 10 | −1.32a | N/A | N/A | |
| −1.10b | N/A | N/A | ||||
| 250 | −1.1c (n = 2) | −0.6c (n = 2) | −0.6c (n = 2) | |||
| WMG-1 | Mineralized gabbro | 15 ± 3f | 250 | −1.0c (n = 3) | −0.5c (n = 3) | −0.4c (n = 3) |
| WMS-1 | Massive magmatic sulfide | 108 ± 13f | 250 | −1.0c (n = 3) | −0.6c (n = 3) | −0.4c (n = 3) |
| WPR-1 | Altered peridotite | 4 ± 1f | 250 | −0.9c (n = 3) | −0.5c (n = 3) | −0.4c (n = 3) |
| Interlaboratory standards | ||||||
| Merck–Rouxel | Nancy Merck split | 1 | 0a | N/A | 0a | |
| −0.2c (n = 3) | −0.1c (n = 3) | −0.1c (n = 3) | ||||
| CRPG | Nancy split | 1 | −3.15a | N/A | −2.13a | |
| −3.1c (n = 3) | 1.9c (n = 3) | −2.0 (n = 3) | ||||
| MH495 | Illinois split | 1 | −4.46a | N/A | −3.06a | |
| −4.3c (n = 3) | −2.6c (n = 3) | −2.3c (n = 3) | ||||
| NIST 3149 split | NIST bulk Se standard | 1 | −1.4a | N/A | −0.93ad | |
| −1.5c (n = 3) | −0.9c (n = 3) | −0.8c (n = 3) | ||||
Analysis of standard reference materials
In addition to interlab solutions, four geologically relevant SRM’s and four additional provisional SRM’s were analyzed to quantify the accuracy of the method as a whole (Se preconcentration and CGH-ICP-DRC-MS). The isotopic results of the SRM’s processed through the TCF columns, compared with those reported by others, indicate that, within analytical error, there was no mass fractionation within the Se preconcentration procedure, which is consistent with near 100% selenium yield and recovery.Conclusions
The performance of CGH-ICP-DRC-MS for Se isotope ratio measurement has been evaluated and is shown to provide acceptable precision and accuracy between 0 and −4.5‰ δ82/76SeMerck. This allows the analysis of geological samples and the discrimination of samples that have undergone moderate to extreme mass-dependent fractionation (perhaps down to −15‰ δ82/76SeMerck). The accuracy and precision of the method using four interlaboratory solutions and the ‘in-house’ Merck standard analyzed over an 18 month period indicate a variation of ±0.85‰ δ82/76SeMerck (2σ).Ion signal intensities of all measured selenium isotopes were increased 100-fold over classic nebulization. Premixed Ar (95%) + H2 (5%) at a flow rate of 0.6 ml min−1 was used in preference over CH4 and NH4 as a reaction cell gas to minimize the Ar2+ interferences at m/z 76, 78 and 80, the formation of secondary ions at m/z 80, and the formation of hydrides within the DRC. Optimized DRC rejection parameters RPa (0) and RPq (0.65) were required to effectively reduce the SBR and to reduce the instrumental mass bias within range of the m/z 80 (∼3% per AMU) for the PE 6100 DRC instrument.
The throughput of this method is about 6–8 samples per day, similar to 4–5 by N-TIMS. Standard-bracketing of samples corrects for mass discrimination as well as instrument drift; however, selenium separation by TCF is always necessary. Once a laboratory has been established for TCF separation, the time required for sample preparation is minimal.
Future publication will include the application of this technique to selenium-enriched rocks, including volcanogenic massive sulfide ores and organic-rich black shale rocks.
Acknowledgements
We thank O. Rouxel and T. M. Johnson for providing aliquots of their Se solutions and for their interest in this project. We thank Jerry Beavers for his machining and aid in the CHG assembly. This work benefited from discussions with P. Pelchat (Geological Survey of Canada), O. Rouxel (Woods Hole Oceanographic Institute) and T. Johnson (University of Illinois at Urbana-Champaign). We are grateful for journal reviewer’s comments that greatly helped to improve the manuscript. Research support was gratefully received from Natural Sciences and Engineering Research Council, National Science Foundation, Geological Survey of Canada, Society of Economic Geologists and Mineralogical Association of Canada. This is the Geosciences Department at the University of Texas at Dallas contribution number 1073, and Geological Survey of Canada contribution number 2004309.References
- E. H. Larsen, J. Sloth, M. Hansen and S. Moesgaard, J. Anal. At. Spectrom., 2003, 18, 310 RSC.
- J. J. Sloth, E. H. Larsen, S. H. Bugel and S. Moesgaard, J. Anal. At. Spectrom., 2003, 18, 317 RSC.
- J. J. Sloth and E. H. Larsen, J. Anal. At. Spectrom., 2000, 15, 669 RSC.
- T. M. Johnson and T. D. Bullen, in Geochemistry of Non-Traditional Stable Isotopes, ed. C. M. Johnson, B. L. Beard and F. Albarede, Mineralogical Society of America, Washington, DC, 2004 Search PubMed.
- P. Van Dael, D. Barclay, K. Longet, S. Metairon and L. B. Fay, J. Chromatogr. B, 1998, 715, 341 CrossRef CAS.
- T. M. Johnson, Chem. Geol., 2004, 204, 201 CrossRef CAS.
- T. M. Johnson and T. D. Bullen, Geochim. Cosmochim. Acta, 2003, 67, 413 CrossRef CAS.
- M. J. Herbel, T. M. Johnson, K. K. Tanji, S. Gao and T. D. Bullen, J. Environ. Qual., 2002, 31, 1146 CAS.
- M. J. Herbel, T. M. Johnson, K. K. Tanji, S. D. Gao and T. D. Bullen, J. Environ. Qual., 2002, 31, 1146 CAS.
- P. Van Dael, L. Davidsson, E. E. Ziegler, L. B. Fay and D. Barclay, Pediatr. Res., 2002, 51, 71 Search PubMed.
- M. J. Herbel, T. M. Johnson, R. S. Oremland and T. D. Bullen, Geochim. Cosmochim. Acta, 2000, 64, 3701 CrossRef CAS.
- T. M. Johnson, M. J. Herbel, T. D. Bullen and P. T. Zawislanski, Geochim. Cosmochim. Acta, 1999, 63, 2775 CrossRef CAS.
- T. M. Johnson, M. J. Herbel, T. D. Bullen and R. S. Oremland, Geol. Soc. Am., Abstr. Prog., 1999, 31, 276 Search PubMed.
- T. M. Johnson, M. J. Herbel, T. D. Bullen and P. T. Zawislanski, Geochim. Cosmochim. Acta, 1999, 63, 2775 CrossRef CAS.
- M. Wachsmann and K. G. Heumann, Int. J. Mass Spectrom. Ion Processes, 1992, 114, 209 CrossRef CAS.
- O. Rouxel, Y. Fouquet and J. N. Ludden, Geochim. Cosmochim. Acta, 2004, 68, 2295 CrossRef CAS.
- O. Rouxel, J. Ludden, J. Carignan, L. Marin and Y. Fouquet, Geochim. Cosmochim. Acta, 2002, 66, 3191 CrossRef CAS.
- D. C. Gregoire, Anal. Chem., 1987, 59, 2479 CrossRef CAS.
- B. L. Beard and C. M. Johnson, Rev. Mineral. Geochem., 2004, 55, 319 Search PubMed.
- D. Mercone, J. Thomas, I. W. Croudace and S. R. Troelstra, Geochim. Cosmochim. Acta, 1999, 63, 1481 CrossRef CAS.
- G. M. Peters, W. A. Maher, D. Jolley, B. I. Carroll, V. G. Gomes, A. V. Jenkinson and G. D. McOrist, Org. Geochem., 1999, 30, 1287 CrossRef CAS.
- A. H. Clemens, L. F. Damiano, D. Gong and T. W. Matheson, Fuel, 1999, 78, 1379 CrossRef CAS.
- K. A. Wolnik, F. L. Fricke, M. H. Hahn and J. A. Caruso, Anal. Chem., 1981, 53, 1030 CrossRef CAS.
- R. M. Barnes and X. Wang, J. Anal. At. Spectrom., 1988, 3, 1083 RSC.
- S. Branch, W. T. Corns, L. Ebdon, S. Hill and P. O’Neill, J. Anal. At. Spectrom., 1991, 6, 155 RSC.
- E. J. McCurdy, J. D. Lange and P. M. Haygarth, Sci. Total Environ., 1991, 135, 131.
- J. T. Creed, M. L. Magnuson, C. A. Brockhoff, I. Chamberlain and M. Sivaganesan, J. Anal. At. Spectrom., 1996, 7, 505 RSC.
- Y. K. Chau and J. P. Riley, Anal. Chim. Acta, 1965, 33, 36 CrossRef CAS.
- S. P. Brimmer, W. R. Fawcett and K. A. Kulhavy, Anal. Chem., 1987, 59, 1470 CrossRef CAS.
- M.-Q. Yu, G.-Q. Liu and J. Q., Talanta, 1983, 30, 265 CrossRef CAS.
- S. Xiao-Quan and H. Kai-Jing, Talanta, 1985, 32, 23 CrossRef.
- W. T. Perkins, R. Fuge and N. J. G. Pearce, J. Anal. At. Spectrom., 1991, 7, 445 RSC.
- B. Hattendorf and D. Gunther, J. Anal. At. Spectrom., 2000, 15, 1125 RSC.
- B. Hattendorf, C. Latkoczy and D. Gunther, Anal. Chem., 2003, 75, 341A CrossRef CAS.
- R. F. Sanzolone and T. T. Chao, Geostand. Newsl., 1987, 11, 81 CrossRef CAS.
- N. S. Belshaw, X. K. Zhu, Y. Guo and R. K. O‘Nions, Int. J. Mass Spectrom. Ion Processes, 2000, 197, 191 Search PubMed.
- X. K. Zhu, R. K. O’Nions, Y. Guo, N. S. Belshaw and D. Rickard, Chem. Geol., 2000, 163, 139 CrossRef CAS.
- F. Albarede and B. Beard, in Geochemistry of Non-Traditional Stable Isotopes, ed. C. M. Johnson, B. L. Beard and F. Albarede, Mineralogical Society of America, Washington, DC, 2004 Search PubMed.
- J. R. O’Neil, Rev. Mineral., 1986, 16, 561 Search PubMed.
- E. G. Chudinov and G. V. Varvanina, J. Anal. Chem., 1989, 44, 662.
- L. Jian, W. Goessler and K. J. Irgolic, Fresenius’ J. Anal. Chem., 2000, 366, 48 CrossRef CAS.
- II. Stewart and J. W. Olesik, J. Anal. At. Spectrom., 1998, 13, 1313 RSC.
- P. Smichowski and J. Marrero, Anal. Chim. Acta, 1998, 376, 283 CrossRef CAS.
- J. T. Rowan and R. S. Houk, Appl. Spectrosc., 1989, 43, 976 CAS.
- G. C. Eiden, C. J. Barinaga and D. W. Koppenaal, J. Anal. At. Spectrom., 1996, 11, 317 RSC.
- P. Turner, J. Merren, C. Speakmen and C. Haines, in Plasma Source Mass Spectrometry, ed. G. Holland and S. D. Tanner, Royal Society of Chemistry, Cambridge, 1997 Search PubMed.
- S. D. Tanner, V. I. Baranov and D. R. Bandura, Spectrochim. Acta, Part B, 2002, 57, 1361 CrossRef.
- B. Hattendorf and D. Gunther, J. Anal. At. Spectrom., 2004, 19, 600 RSC.
- D. R. Bandura, V. I. Baranov and S. D. Tanner, Fresenius’ J. Anal. Chem., 2001, 370, 454 CrossRef CAS.
- B. Gammelgaard and O. Jons, J. Anal. At. Spectrom., 1999, 14, 867 RSC.
- S. Gao, T. Luo, B. Zhang, H. Zhang, Y. Han, Z. Zhao and Y. Hu, Geochim. Cosmochim. Acta, 1998, 62, 1959 CrossRef CAS.
- D. Layton-Matthews, M. I. Leybourne, J. Peter and S. D. Scott, Geol. Soc. Am. Abstr. Progr., 2003, 35, 357 Search PubMed.
- G. E. M. Hall, A. I. MacLaurin, J. C. Pelchat and G. Gauthier, Chem. Geol., 1997, 137, 79 CrossRef CAS.
- G. E. M. Hall and J. C. Pelchat, J. Anal. At. Spectrom., 1997, 12, 97 RSC.
- G. E. M. Hall and J. C. Pelchat, J. Anal. At. Spectrom., 1997, 12, 103 RSC.
- J. A. Plant, D. G. Kinniburgh, P. L. Smedley, F. M. Fordyce and B. A. Klinck, in Treatise on Geochemistry, ed. H. D. Holland and K. K. Turekian, Elsevier, Amsterdam, 2003, vol. 9 Search PubMed.
- H. R. Krouse and H. G. Thode, Can. J. Chem., 1962, 40, 367 CAS.
- O. Y. F. Rouxel and J. Ludden, unpublished work presented at the EUG XI meeting, Strasbourg, 8th–12th April, 2001.
- R. E. Criss, Principles of Stable Isotope Distribution, Oxford University Press, 1999 Search PubMed.
Footnote |
| † Ar-equivalent flow units: mass-flow controller calibrated for pure Ar. |
| This journal is © The Royal Society of Chemistry 2006 |