Synchrotron radiation circular dichroism spectroscopy of proteins and applications in structural and functional genomics
Andrew J.
Miles
a and
B. A.
Wallace
*ab
aDepartment of Crystallography, Birkbeck College, University of London, London, UK WC1E 7HX. E-mail: ubcg25a@mail.cryst.bbk.ac.uk; Fax: 44-207-631-6803; Tel: 44-207-631-6800
bCentre for Protein and Membrane Structure and Dynamics, Daresbury Laboratory, Warrington, UK WA4 4AD
First published on 14th November 2005
Abstract
The technique of Synchrotron Radiation Circular Dichroism (SRCD) spectroscopy and its advantages over conventional circular dichroism spectroscopy are described in this tutorial review, as well as recent applications of the technique in structural and functional genomics.
Circular dichroism (CD) spectroscopy is a well-established method in biological chemistry and structural biology, but its utility can be limited by the low flux of the light source in the far ultraviolet and vacuum ultraviolet wavelength regions in conventional CD instruments. The development of synchrotron radiation circular dichroism (SRCD), using the intense light of a synchrotron beam, has greatly expanded the utility of the method, especially as a tool for both structural and functional genomics. These applications take advantage of the enhanced features of SRCD relative to conventional CD: the ability to measure lower wavelength data containing more electronic transitions and hence more structural information, the higher signal-to-noise hence requiring smaller samples, the higher intensity enabling measurements in absorbing buffers and in the presence of lipids and detergents, and the ability to do faster measurements enabling high throughput and time-resolved spectroscopy.
This article discusses recent developments in SRCD instrumentation, software, sample preparation and methods of analyses, with particular emphasis on their applications to the study of proteins. These advances have led to new applications in structural genomics (SG), including the potential for fold recognition as a means of target selection and the examination of membrane proteins, a class of proteins usually excluded from SG programmes. Other SG uses include detection of macromolecular interactions as a screen for complex formation, and examination of glycoproteins and sugar components. In functional genomics (FG) new applications include screening for ligand binding as a means of identifying function, and examination of structural differences in mutant proteins as a means of gaining insight into function.
 Andrew J. Miles | Andy Miles obtained a first class degree in biological chemistry at the University of Leicester. After working as a computer programmer for two years he decided to do research and gained a masters degree in biotechnology from Liverpool John Moores University before moving to London to do his PhD in the Crystallography Department of Birkbeck College. He is currently in the process of writing his PhD thesis. |
 B. A. Wallace | Bonnie Ann Wallace is Professor of Molecular Biophysics at Birkbeck College, University of London, and Director of the BBSRC Centre for Protein and Membrane Structure and Dynamics at the Daresbury Laboratory. She obtained her PhD from Yale and did postdoctoral work at Harvard and at the MRC-LMB in Cambridge. She was an Associate Professor at Columbia University, then Professor of Chemistry at Rensselaer Polytechnic Institute. She moved her lab permanently to London following a sabbatical visit (as a Fogarty Fellow) to Birkbeck College. |
1.0 Introduction
Circular dichroism (CD) is a spectroscopic method that depends upon the differential absorption of left- and right-circularly polarized light by optically active molecules. In chemistry, absorptions in the ultraviolet (UV), visible and infrared (IR) wavelength regions are routinely used to determine the absolute configuration of molecules in solution and the purity of stereoselective syntheses. CD is also a standard tool in biochemistry and biophysics where it is used to characterize biopolymers such as proteins and nucleic acids (see 24, and references therein for a review). The structural information obtained from CD is limited compared to that obtained by X-ray crystallography and nuclear magnetic resonance (NMR) spectroscopy, however it has a number of advantages including: a) a wide range of solution conditions and temperatures can be explored, b) data collection is rapid and c) only small amounts of sample are required. Consequently CD is a valuable adjunct to other structural biology techniques.Changes in CD spectra can provide information on ligand–protein interactions. Dissociation constants can be determined at wavelengths chosen to monitor either ligand-induced modification of the protein secondary structure in the far UV, ligand-induced changes in the protein tertiary structure in the near UV or changes in the ligand itself if binding creates a different chiral environment. Likewise, CD is valuable for monitoring protein folding and unfolding. CD spectra have found other important uses in studies of protein stability and in detecting macromolecular complex formation.
2.0 CD spectra of proteins
The far UV CD spectra of alpha-helical proteins are characterized by three peaks (Fig. 1): A negative peak at ∼222 nm has been assigned to the peptide n → π* transition.67 Another negative peak of similar intensity at ∼208 nm and a stronger positive peak at ∼192 nm, are assigned to the π → π* exciton splitting polarized parallel and perpendicular to the helix axis, respectively. A peak which appears as a shoulder at 175 nm has been proposed to be due to the charge transfer transitions,43,13 but in general this transition is at a wavelength that is too low to be detected in a conventional CD instrument.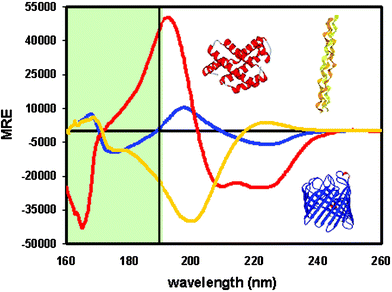 | ||
| Fig. 1 SRCD spectra of a mostly helical protein in red, a mostly beta sheet protein in blue, and a polyproline helix (collagen) in yellow. The low wavelength data in the green shaded area to the left of the vertical black line are generally only accessible using SRCD, whereas the data to the right of the line are accessible by both SRCD and conventional CD instruments. The greater diversity in spectral characteristics of the different secondary structural types in the low wavelength region enables secondary structural features to be more accurately determined in proteins with mixed contents. MRE is mean residue ellipticity units. | ||
The CD spectrum of a 310 helix is very similar to that of an α-helix but it has been suggested that a distinction lies in the intensities of the two negative peaks at 222 nm and 208 nm, which are much less intense for 310 helices than for α-helices;44 consequently when there is a high content of α-helix present, the 310 helix signal cannot be easily distinguished.
In general, spectra arising from β-sheets (Fig. 1) are characterized by a small negative peak near 217 nm assigned to the n → π* transition and a positive peak near 195 nm that has approximately half the intensity of the α-helix peak in this region.67 The 195 nm peak and a negative peak at around 180 nm are assigned to π → π* exciton components polarized perpendicular to the chain direction and normal to the plane of the sheet, respectively. β-Sheets give rise to considerably less intense signals than helices and show far more variation in spectral characteristics; the latter is partly attributable to the fact that β-sheets are much more structurally diverse than α-helices, with strands which may run parallel or antiparallel to each other, and with sheets displaying differing degrees of twisting. The weak β-sheet signal makes it more susceptible to distortions caused by the CD signals of aromatic side chains, which can produce peaks or dips between 225 nm and 235 nm.68 These factors often make the analyses of β-sheet rich proteins much less accurate than those of their helical counterparts.
The polyproline (PPII) helix spectrum (Fig. 1) is characterized by a small but variable peak around 215–230 nm and strong negative peak at ∼200 nm and. Below 190 nm, its spectrum tends to be negative, often with a shoulder or minimum around 170 nm.23,56 Unordered structures (often also referred to as random coil or disordered) have variable spectra that are generally similar to the PPII spectra,40 but tend to be slightly blue shifted, have slightly smaller amplitudes, and can lack the higher wavelength positive peak.66 They often also have small positive amplitudes at wavelengths below 180 nm. Consequently, the availability of low wavelength data can aid in distinguishing between these two structural classes.
3.0 SRCD spectroscopy: Advantages over conventional CD spectroscopy
Synchrotron radiation was first used as a light source for CD over 20 years ago,50,45 but the unique information that may be obtained by SRCD spectroscopy and its applications for structural and functional genomics54,56 are only now being realized.3.1 Lower wavelength data
At wavelengths below 190 nm the light flux from a synchrotron ring is orders of magnitude more intense than that typically available in conventional instruments that use Xenon arc lamps, allowing spectra to be obtained well into the vacuum ultraviolet (VUV) wavelength region where additional electronic transitions occur. Consequently the data acquired contains more unique elements of information than conventional CD spectra, making it possible to distinguish between more types of secondary structures and motifs.56Flux from Xenon light sources used in conventional CD instruments can decrease from approximately 1011 photons s−1 mm−1 at 240 nm to 109 photons s−1 mm−1 at 180 nm.6 This dimming is augmented by a steady increase in absorption by the quartz optics and oxygen present in the light path as well as the sample itself and any absorbing buffer present, severely limiting the collection of meaningful data at wavelengths below 190 nm. A synchrotron radiation light source can be orders of magnitude brighter than a Xenon lamp and suffers no comparable decrease in flux across the UV and VUV wavelength ranges. The first SRCD beamline 3.1 constructed at the Synchrotron Radiation Source (SRS), Daresbury, UK provided a flux of around 1011 photons s−1 from 350 to 140 nm.6 Beamline UV1 at ISA in Aarhus, Denmark has a similar flux; however that of the recently commissioned beamline CD12, at Daresbury is roughly 1000 times brighter.5 These beamlines are maintained under high vacuum except for the sample chamber, which is purged with dry nitrogen. Thus, with the removal of oxygen from the light path and by using calcium fluoride or lithium fluoride for optical windows and sample cells, measurements can be extended down to 140 nm, although for aqueous solutions, the absorbance due to the water solvent tends to truncate spectra at 168 nm even if very short pathlength cells are used.
Fig. 1 shows the SRCD spectra of three structurally different proteins measured to 160 nm. For comparison, the low wavelength cut-off of a conventional instrument is indicated by the black vertical line; in general, the shaded green region is accessible only using SRCD. It is clear that below 190 nm the spectra of the different structural types are more distinct (with helices and sheets even having different signs). This can be exploited to improve secondary structural analyses.
3.2 Higher information content
The information content of a protein CD spectrum is dependent upon the wavelength range present and especially the lower wavelength limit of the spectrum. Five eigenvectors were estimated to be present in CD spectra that extend down to 178 nm, allowing seven types of secondary structure to be distinguished including α-helices, anti parallel β-sheets, parallel β-sheets, β-turns and aperiodic (sometimes called “random coils” or “disordered”) structures.22 The information content of a spectrum was estimated to increase by extending the lower wavelength to 168 nm,52 rising to ≥8 at 160 nm.56 This allows many more types of structures to be resolved, which could include distinctive folds and supersecondary motifs. However, most existing reference databases (see Section 5.3) only include data to 190 nm (or in a few cases down to 178 nm). To utilize the extra data in the low wavelength region, an extensive reference database of SRCD spectra for ∼100 proteins covering a wide range of secondary structural motifs and fold types is now under construction by our group. It has already been demonstrated that using a small set of 15 proteins measured to 160 nm with SRCD can significantly improve secondary structure analyses,28 so the broader based reference set should even enhance this.3.3 Improved signal-to-noise ratios
The greater intensity of the synchrotron light source compared to Xenon arc lamps, especially at lower wavelengths, means that the signal-to-noise ratios in spectra obtained on SRCD instruments are much greater than those of spectra measured on conventional instruments (Fig. 2). Therefore considerably smaller amounts of protein are required to obtain a spectrum of comparable quality, and smaller differences can be distinguished.53 In addition, averaging times (defined as the times taken at each wavelength to acquire a suitable signal) can be greatly reduced, thereby speeding up the process of obtaining a spectrum. This is advantageous not only for increasing the rate of data collection (useful for structural genomics projects which seek to examine a large number of proteins), but ultimately also for increasing the time resolution of stopped-flow experiments.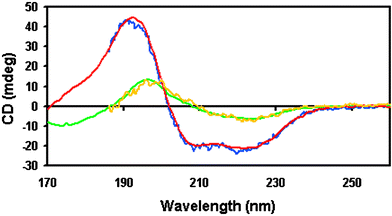 | ||
| Fig. 2 Conventional CD spectra (blue and yellow) and SRCD spectra (red and green) of myoglobin and concanavalin, respectively, obtained using identical samples (same protein preparation and concentration, same buffer, same sample cell with same cell pathlength, same temperature, etc.) showing improved signal-to-noise levels in the SRCD spectra, as well as the lower wavelength limits achievable with SRCD. | ||
4.0 Protocols for SRCD measurements
Measuring a CD spectrum may seem simply a matter of loading a sample into the instrument and pressing a button, however there are a number of procedures that need to be adopted to ensure the quality and consistency of the data. Sound guides to the pitfalls encountered when collecting data on conventional instruments provided by references 21 and 24 are equally applicable to SRCD measurements. However, SRCD has its own additional requirements and issues.4.1 Instrument calibration
Most CD analysis algorithms are very sensitive to the magnitudes and positions of protein CD spectral peaks. It is therefore essential to calibrate any type of CD instrument for spectral magnitude, polarisation, and wavelength. This is especially important for SRCD beamlines, where beam position is more variable than in conventional instruments. D-10-camphorsulfonic acid (CSA) or ammonium camphorsulfonate (ACS) are both routinely used to calibrate CD instruments for magnitude and polarization, each giving rise to a positive CD peak at 290 nm and a larger negative peak at 192.5 nm (Fig. 3). The magnitude of the 290 nm peak of CSA at 25 °C is Δε = 2.36 M−1cm−133 and that of ACS is 2.40 M−1cm−1.51 However the 192.5 nm peak is near the lower wavelength limit of conventional CD instruments and a number of different Δε values for it can be found in the literature, ranging from 4.5 to 5.0, with a consensus for CSA of 4.72 at 25 °C; this makes the calculated average ratio of the peaks equal to a value of 2.0, with values ranging from 1.95 to 2.25 actually measured for a group of pre-calibrated CD and SRCD instruments.33 Two other magnitude standards are pantolactone, which has a negative peak at 219 nm (Δε = 4.9 M−1cm−1), and in the visible range, cobalt(III) tris-ethylenediamine (Coen), giving rise to a maximum at 490 nm (Δε = 1.89 M−1cm−1).33 This suggested a method whereby the ratio of the absolute values of the standard peaks and the values measured on a particular instrument can be used to normalize the spectrum of a protein measured on that instrument so that it coincides with the data collected on any other instrument where the same procedure has been applied.33 Software for doing this calibration is available in the CDtool package25 (see Section 5.2). However in most situations just the values of the two peaks of CSA or ACS will suffice for the calibration, which is fortunate since Coen is difficult to obtain and pantolactone is hygroscopic and has no convenient absorbance peak at the required concentration. CSA is also hygroscopic but the absorbance at 285 nm can be used for quantitation: for a 6 mg ml−1 solution in a 1 cm cuvette at 25 °C, A285 = 0.864, ε285 = 34.6.31 In contrast, the concentration of ACS can be accurately measured gravimetrically. The spectra of both CSA and ACS are sensitive to temperature and should be measured at 25 °C and solutions should be stored (briefly) in the dark at 4 °C, as they tend to degrade with time and exposure to light.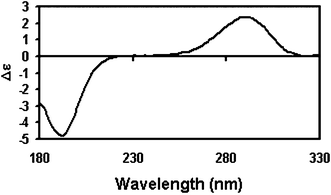 | ||
| Fig. 3 SRCD spectrum of CSA, a standard used for instrument calibration. Both the Δε at 290 nm and the ratio of the ellipticities of the peaks at 290 and 192.5 nm are useful calibration parameters | ||
For wavelength calibrations, there are a number of commercial standards available which can be purchased as sealed solutions or glass filters. These include holmium oxide, which produces a series of absorption peaks between 260 nm and 650 nm, and didymium with peaks from 290 nm to 870 nm. An inexpensive alternative is benzene vapour which gives rise to a series of sharp peaks between 240 and 270 nm.32 For SRCD, assuming the instrument is well-purged with nitrogen, a series of sharp nitrogen gas peaks at ∼140 nm can also be used for calibration in the VUV region. Wavelength errors are usually linear across the wavelength range and can be corrected using the instrument software. However if this is not possible, the spectra can be adjusted afterwards using spreadsheet programs like Microsoft Excel, or the CDtool data processing package.25
4.2 Sample preparation
In general any component of a buffer system that absorbs strongly in the wavelength region of interest should be removed or substituted with a non-absorbing equivalent. Chlorine anions are one of the worst offenders so sodium chloride should be substituted wherever possible by either sodium fluoride (unless this interferes with the protein structure or function) or sodium sulfate. Similarly Tris buffer should be acidified with sulfuric or phosphoric acid instead of HCl. Fig. 4 illustrates the benefits of using these alternatives. Many low pH buffers such as citrate, acetate and glycine have carbonyl groups that absorb strongly in the far UV and neutral buffers such as tricine and HEPES also absorb strongly, thus raising the cutoff wavelength (the lowest wavelength at which a spectrum can accurately be measured). The problem can sometimes be resolved by using relatively low buffer concentrations and short pathlength cells.64 However, phosphate systems are preferable and can generally be used at concentrations of up to 100 mM in cells with pathlengths of less than 50 µm.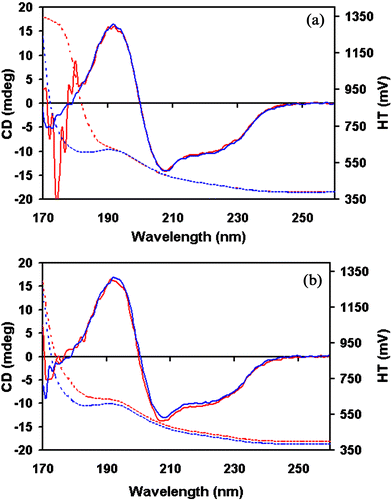 | ||
| Fig. 4 SRCD spectra (solid lines) and HT signals (dashed lines) of lysozyme measured at the same concentration to demonstrate the effect of different buffers on the low wavelength cutoff limit: a) 150 mM NaCl, 20 mM phosphate, pH 7.0 (red) and 150 mM NaF, 20 mM phosphate, pH 7.0 (blue). b) 50 mM Tris HCl, pH 7.0 (red) and 50 mM Tris phosphate, pH 7.0 (blue). It can be seen that the presence of chloride ions adversely affects the low wavelength cutoff limit achievable. | ||
Immediately prior to measuring a spectrum, samples may need to be degassed to remove any dissolved oxygen gas that absorbs strongly below 170 nm; this is an obvious problem for low wavelength measurements. The problem of dissolved oxygen is exacerbated if liquid samples are carried on aircraft for measurements at other locations. Finally, suspended contaminants that produce light scattering should be removed by centrifugation at 12000 × g for 1 minute, or by micro-filtration.
4.3 Sample cells
Most SRCD stations have cell holders suitable for a range of cells with different geometries, however circular demountable cells are recommended for pathlengths below 500 µm because they are much easier to clean than cylindrical bottle cells and provide a larger surface-to-volume ratio than rectangular cells. When using demountable cells, it is important to mark the rim of each half of the cell so that they can be assembled in the same orientation each time; this also provides a reference for positioning the cell in the cell holder, thereby ensuring reproducibility. Cells can exhibit a small amount of dichroism and, as a rule of thumb, the CD signal of an empty cell should not vary by more than 5 mdeg across the entire wavelength range. Any cell that gives rise to a larger signal should be not be used for SRCD measurements.The pathlengths of long cells (0.1–1.0 cm) are usually accurately reported by the manufacturers, however the reported pathlengths of short cells can be in error by as much as 50%.32 This error, if unrecognized, will, in turn, result in a comparable error in the spectral magnitude. For cells of <50 µm, pathlengths can be determined using the interference fringe method described in reference 32 (see Fig. 5). Longer pathlength cells can be calibrated using carefully prepared solutions of potassium chromate where ε273 = 4830 M−1cm−1.17
![Interference spectrum used for calibrating the pathlength of a sample cell. The fringes are obtained by scanning an empty sample cell having a nominal 0.001 cm pathlength with a UV/VIS spectrometer in transmission mode. The cell path length is calculated from the following: pathlength (in µm) = [(n (W1 * W2))/2(W2 −
W1)]/1000, where W1 and W2 are the wavelengths of the fringes in nm and n is the number of fringes between wavelengths W1 and W2. (Figure adapted from reference 32.)](/image/article/2006/CS/b316168b/b316168b-f5.gif) | ||
| Fig. 5 Interference spectrum used for calibrating the pathlength of a sample cell. The fringes are obtained by scanning an empty sample cell having a nominal 0.001 cm pathlength with a UV/VIS spectrometer in transmission mode. The cell path length is calculated from the following: pathlength (in µm) = [(n (W1 * W2))/2(W2 − W1)]/1000, where W1 and W2 are the wavelengths of the fringes in nm and n is the number of fringes between wavelengths W1 and W2. (Figure adapted from reference 32.) | ||
New custom-made calcium fluoride cells (Hellma Jena, Germany) that have been specifically designed for low wavelength measurements64 have optical pathlengths of 3 to 20 µm. Calcium fluoride crystals have the advantage of being transparent at much lower wavelengths than quartz cells, which become opaque at ≥165 nm. An additional feature of the new design is that only 1 or 2 µl of sample is required, and the loading and therefore pathlengths are extremely reproducible. Furthermore, owing to the low-wetting surface properties of calcium fluoride the sample can often be recovered after a spectrum has been measured.
4.4 Protein concentration: optimisation and determination
Maximising the protein concentration (but not so high as to cause precipitation) will enable the use of the shortest possible optical pathlengths, thereby reducing the amount of solvent and buffers in the beam, and thus lowering the cutoff wavelength limit of the measurements. The maximum absorbance of the amide peak at ∼190 nm should optimally be set to <1.0. However, absorbance measurements of these peaks in many UV spectrophotometers are often difficult as they are unable to accurately measure signals below 200 nm. Fortunately the high tension (HT) or high voltage (HV) or dynode [different instruments use different nomenclatures and different scales] signal of an SRCD instrument can be used to monitor and optimise the concentration, as it is related to the absorption of the sample. In general, 10 mg ml−1 for alpha helical proteins and 15–20 mg ml−1 for beta-sheet rich proteins are optimal concentrations for use with 10 µm optical pathlength cells.If data collection is to be followed by secondary structure analysis, the concentration must also be measured as accurately as possible.37,59,24 Methods typically used for simple biochemical analyses such as the Bradford and Lowry techniques are not sufficiently accurate for these purposes. The most accurate method is quantitative amino acid analysis. As little as 300 pmoles of protein may be required, however, on the downside the sequence must be known and the procedure, which is usually carried out in specialist analytical laboratories, can be expensive. This method has the additional advantage of providing a check on the protein purity. Another reasonably accurate method of protein concentration determination is to measure the absorbance of the protein at 280 nm when it is denatured in 6 M guanidinium hydrochloride.14 The protein should be diluted to give a maximum absorbance of between 0.5 and 1.2 in a 1 cm cell. If small aperture cuvettes are used, only ∼0.1–0.5 mg of protein is required, but this is more costly in terms of protein than the SRCD measurements themselves. Absorbance in the far UV region of the spectrum is due to aromatic and cystine residues and, at a given wavelength, the extinction coefficient of a denaturated protein can be estimated from the molar extinction coefficients of tyrosine, tryptophan and cystine using the following equation
| εprotein = (ntrp * εtrp) + (ntyr * εtyr) + (ncys * εcys) |
| A280 [1 mg ml−1; 1 cm] = 5690ntrp + 1280ntyr + 120ncys/M |
The A280 method has limited value if the protein in question has absorbing cofactors such as a heme group or NAD, that can distort the aromatic absorptions. Light scattering due to suspended particles is another problem, as it tends to produce signals even at wavelengths above 310 nm where the protein itself does not absorb. For the purposes of determining protein concentrations spectroscopically, if centrifugation or filtration does not remove the light scattering, it is suggested in reference 58 to plot the log of the absorbance against log of the wavelength in the non-absorbing regions above 310 nm and extrapolate the line into the absorbing regions to determine the contribution to absorbance by light scattering at these wavelengths.
4.5 Measuring SRCD spectra
SRCD instruments run in step scan mode, a method used in Aviv and other conventional CD instruments, but different from the continuous scan mode, used by Jasco CD instruments. For measuring protein spectra it is usual to set the wavelength interval between data points to 1 nm and the bandwidth to 0.1 nm. Sometimes a smaller interval is used (0.2 nm) if a very high resolution in peak position is needed (e.g. for distinguishing membrane proteins from soluble proteins57). The dwell time (the time data is collected at each wavelength) depends upon the instrument but is usually between 1 and 2 seconds, although smooth spectra may be obtained with dwell times as low as 0.2 seconds if the spectral magnitude is large. However, it is essential that optimal spectral parameters be established for each instrument so that peaks are not truncated due to differences in the response times of the instrument. It is often advisable to run a quick preliminary test scan with a dwell time of 0.2 s to ensure that a cell is appropriate for the protein concentration (i.e. it produces a large enough signal for accuracy, but not exceeding the linear range of the detector). The latter can be monitored by the HT signal, which is related to the absorbance of the sample, and should not, at the 190 nm backbone amide peak, exceed the maximum level defined for that instrument—typically corresponding to an absorbance of ∼1.0;24 to do so will result in the CD peak being truncated. Verification can be achieved by diluting the sample, re-measuring the spectrum and scaling the two spectra to the n → π* minimum at ∼222 nm (again the data processing software, CDtool provides a useful means of doing this). If the 190 nm peak of the diluted sample is significantly higher than the peak of the concentrated sample, then truncation has occurred. At the cutoff limit the HT will increase rapidly whilst the CD signal becomes very noisy, although the latter may be not be apparent if the signal appears to increase precipitously either positively or negatively, a feature that should be regarded as an artifact. For example, in Fig. 6, the spectrum for ceruloplasmin shows a sharp increase at ∼170 nm that might be considered to be the slope of a peak, but this is artifactual as it is at a wavelength where the HT (dotted line) is too high for accurate measurements. It is advisable to set the low wavelength limit for the data collection 5 data points (usually 5 nm) below the cutoff limit to accommodate smoothing algorithms which require averaging over a number of data points (although these extra 5 nm of data should not be included in the final processed spectrum produced).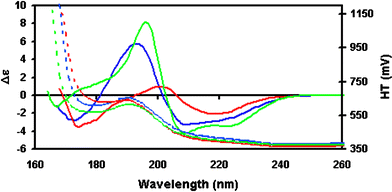 | ||
| Fig. 6 SRCD spectra (solid line) and HT signals (dashed line) for several proteins with different types of secondary structure. Insulin is a mostly helical protein (green), rhodanase is a mixed protein (blue), and ceruloplasmin is mostly beta sheet protein (red). All spectra were obtained using the same protein concentration and in the same pathlength cell, illustrating the relative magnitudes of the spectra of different secondary structural types, and showing how the HT can indicate the useful lower wavelength limit of the data. For comparable conditions, helical proteins can be accurately measured to considerably lower wavelengths than can be mixed or mostly beta sheet proteins. | ||
At least three scans of both sample and baseline should be measured and saved independently to enable tests for reproducibility (see Section 5.2). It is important to ensure that the baseline coincides with the protein spectrum at wavelengths where the protein absorption is negligible, usually between 260 nm and 270 nm. If there is a small discrepancy, the processed spectrum can be zeroed at the appropriate wavelength, however a difference of more than 2 mdeg is an indication that either the demountable cell has been assembled so that the two halves are in a different orientation from when the sample spectrum was measured or that the cell may be tilted in relation to the beam.
Finally, two possible problems uniquely associated with the use of synchrotron radiation as a light source need to be considered when making measurements: a) movement of the beam and b) damage to proteins whilst they are in the beam, although it must be stressed that these phenomena do not occur at all beamlines. Some SRCD designs produce wavelength-dependent positions of the beam. A small movement of the beam amplified through the focal length can result in significant movement at the detector. If the detector windows are not completely uniform, different areas of the detector may exhibit different amounts of dichroism. This is not problematic if the movement is consistent but sometimes the beam may shift in the synchrotron ring during or between consecutive scans and a different sector of the detector window with different dichroic properties will lie in its path. Similarly, if the cell pathlength is not perfectly uniform across the face of the cell, the beam may penetrate different thicknesses as it moves, and this will distort the spectrum measured.
When the first SRCD beamlines were used for protein studies, there was some concern as to whether the high intensity UV light would have a deleterious effect on proteins due to the formation of free radicals or heating of the sample by the intense light beam.35 It was demonstrated that long exposure to the beam at Daresbury station 3.1 and at ISA station UV1 had no detectable effect on the chemical integrity or conformation of a test protein, myoglobin.35 However at high flux beamlines (such as CD12 at the SRS), changes in spectra may be observed between consecutive scans; these are not due to chemical degradation or free radical formation, but have been proposed to be due to localized heating of bound water molecules resulting in protein denaturation.65 In some cases, when the sample is removed from the beam the signal will recover because the protein refolds. Not all proteins exhibit the same sensitivity to the beam, with membrane proteins tending to be less sensitive than soluble proteins. If a change in spectra between consecutive scans is observed to occur, measurements should be accumulated using a fresh sample loaded into the cell for each repeat scan.65 Alternatively, it may be possible to adjust the aperture to the sample chamber, thereby reducing the flux incident on the sample and allowing damaged protein to diffuse out of the beam between scans.20
5.0 Data processing, analyses and software
5.1 Units of measurement
Before discussing the processing of data it is useful to describe the units used. In absorption spectroscopy the fraction of light absorbed by a sample follows the Beer–Lambert law:| Aλ = log10 (I0/I) = εlC |
| CD = ΔA = AL − AR = εLlC − εRlC = ΔεlC |
| [θ] = 100θ/Cl |
| MRE = (MRW)θ/10cl |
| Δε = [θ]/3298 |
Typical MRE values for the positive π → π* peak of a α-helical protein are between 25,000 and 65,000 degrees.cm2 dmol−1 (the corresponding Δε values are 8 to 20). β-sheet rich proteins with their smaller signals have MRE values in the region of 10,000 to 16,000 degrees-cm2 dmol−1 (Δε = 3 to 5).
5.2 Data processing and processing software
Generally, in order to assess the reproducibility of a spectrum, multiple scans of both the protein and the baseline are obtained. Comparison of consecutive individual scans (rather than saving only an online-averaged spectrum) enables the user to determine if any systematic changes have occurred in the sample during data collection (for example, protein denaturation or precipitation). Post collection averaging of spectra also enables the calculation of error bars at any wavelength so that spectra of different samples can be compared to see if any differences are significant. The averaged baselines are subtracted from the averaged sample spectra. Data may be smoothed using an algorithm41 (taking care not to smooth over so many data points that peaks are truncated), zeroed at an appropriate wavelength (see Section 4.5), and then converted to the appropriate units.Most commercial CD instruments and SRCD beamlines have developed their own software to do some or all of these functions. However, if the aim is to compare spectra obtained on different instruments, it may be valuable to process all the data with a single software program for consistency. CDtool25 is a CD data processing package that accepts formats from all currently operational SRCD stations and popular conventional CD instruments. It includes a simple graphical toggling system to select, average, subtract and zero spectra. The smoothed and raw data can be presented along with the HT; other useful functions such as a zoom control and the ability to print plots are available. Spectra can be scaled relative to each other and can be calibrated for both wavelength and spectral magnitude. Data can also be downloaded into a MySQL database for local archiving.
5.3 Data analyses and analysis software
In the last three decades a number of methods have been developed for determining protein secondary structure content based on empirical analyses of CD spectra. These include: multilinear regression least squares,4,59 singular value decomposition (SVD),18 ridge regression,37 the self-consistent method47 and neural networks.1These empirical methods utilize spectral data from proteins with known crystal structures to create reference databases from which they calculate the structure of an “unknown” protein from its spectrum. The methods assume that the crystal structures and structures in solution of the reference proteins are the same and that the contributions to the CD spectrum from individual secondary structures are additive, i.e. Cλ = ∑fiBiλ + noise, where Cλ is the CD spectrum of a protein as a function of wavelength, fi is the fraction of secondary structure of a given type and Biλ is the ellipticity of each ith secondary structure at each wavelength. The noise term also includes the contribution due to aromatic side chains.15 Least squares methods derive a set of “characteristic” spectra, one for each secondary structural type, from the spectra of the individual proteins and then minimize the deviation between the experimental spectrum and the calculated protein spectrum. In constrained methods, the sum of the fractional weights, ∑f, is constrained to equal 1.0.4 Unconstrained, normalized least squares analyses do not constrain the fractions to sum to 1.0, but divide the fractions by the sum of the fractions.59 This latter method has the advantage that it can be employed if the concentration of the protein is not accurately known and is therefore useful in studies of membrane proteins. SVD18 is an eigenvector method that extracts principal component basis curves from a set of protein spectra. Each basis curve is associated with a known mixture of secondary structures and used to analyse the spectra of the unknown protein. Other methods include selection procedures where proteins in the reference set that have similar CD spectra to the unknown protein are combined to produce the final “calculated” spectrum. Such methods include ridge regression analysis implemented by the CONTIN program.37 Another selection method that also includes a number of constraints is the self-consistent method, SELCON3.47 Likewise, the CDSSTR algorithm based on SVD22 also includes the increased the flexibility associated with a selection method. SELCON3, CONTINLL and CDSSTR are now available in a single software package called CDPro.46 Another analysis approach has been the use of neural nets1 such as K2D, in which a network is trained on a reference set of proteins to identify characteristic patterns associated with certain structural types.
In general, the results from all of these methods depend on the proteins used to produce the basis set. A number of different reference databases have been accumulated over the years which contain spectra from different proteins.46,19 They tend to produce somewhat different results for calculated secondary structures, depending on the characteristics present in the reference database proteins and those present in the unknown protein. If the unknown protein has a relatively standard structure, all reference databases and methods will usually produce similar and suitable results, but if the unknown protein contains a type of secondary structure not present in a given reference database (for example, 310 or polyproline helices), or if the protein has unusual contributions due to the presence of aromatic side chains or disulfide bridges, this will influence the ability of the various algorithms to replicate the experimental spectrum of the unknown protein. This is a particular issue for membrane proteins,60 since all existing reference databases are derived from spectra of soluble proteins, which have peaks that are shifted relative to those of membrane proteins. Ultimately, of course, the development of databases with broader coverage of protein secondary structural types and fold space62 will improve the accuracy of all these methods. At present, however, it is often advisable to test different algorithms and different databases to determine which produces the “best”result. Various programs have different ways of calculating goodness-of-fit parameters to assess the correspondence between the calculated and experimental spectra, so comparisons between different algorithms and databases have often been hard to compare. DICHROWEB, a user-friendly web-based calculation server,63 includes a wide range of these algorithms as well as a range of reference databases (including the ability to incorporate user-supplied specialist ones).10 It was developed to accept data formats produced by any conventional CD or SRCD instrument, and calculates a single fit parameter, the normalized root mean square deviation (NRMSD),59 which enables facile comparisons between methods and databases. An additional feature of DICHROWEB is the ability to apply a magnitude-scaling factor to spectra, allowing the user to compensate for possible errors in protein concentration or cell pathlength,32 generally one of the most problematic aspects of data analyses. Such errors in magnitude can have dramatic effects on the calculated secondary structures (see Fig. 7).
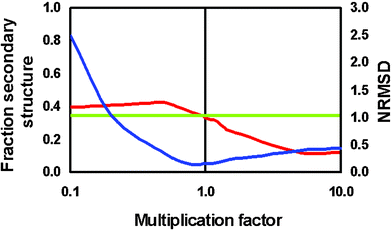 | ||
| Fig. 7 Plot showing magnitude effects on the goodness-of-fit (NRMSD) parameter (blue) and the calculated secondary structure (red) (adapted from reference 30). The green line corresponds to the actual secondary structure, as determined by crystallography, so where the red and green line intersect, the magnitude should be correct. This point also corresponds to the lowest (NRMSD) value. | ||
6.0 Applications of SRCD in structural and functional genomics
With the advent of whole genome sequencing of a wide range of prokaryotic and eukaryotic organisms, the fields of structural and functional genomics have developed to take advantage of the new wealth of information present in the genome sequences. Goals of these studies have included the determination of the three-dimensional structures of proteins on a massive scale (structural genomics (SG)), in order to obtain representative structures of all fold types, and then functional genomics (FG) studies to decipher the functions of proteins whose structures have been determined, but which have low sequence homology to proteins with known activities.A number of characteristics of SRCD have made the technique especially suitable as an adjunct to SG X-ray and NMR studies: the requirement for small amounts of material [volumes of ∼1 microlitre, and amounts of as little as 0.005 mg (with the prospect that even less will be needed with second generation SRCD beamlines)], the rapidity of measurements, and the high sensitivity to small changes and to the presence of beta sheets, as well as the ability to measure proteins in solution without the requirement for either crystals or the high concentrations and extreme conditions often necessary for NMR studies. As SRCD is a developing technique, with the technical parameters and procedures described in earlier sections just being established, not all of the method's potential applications have yet been realized. However, a number of actual and potential (some based on unpublished work from our lab) applications of this technique in SG and FG are described below.
6.1 Structural genomics: beta sheet proteins
Analyses of CD spectra of mainly beta sheet proteins are adversely affected by the presence of helical components, because the far UV regions of their spectra are dominated by the large signals due to the helical components. However, in the VUV region, helices and sheets have spectra of opposite signs and are therefore much more readily distinguished. Thus, the expense and inconvenience of using SRCD may be especially justified when investigating proteins with mainly beta sheet secondary structures.An example is OspA, a major antigen of the Lyme disease spirochete Borrelia burgdorferi. In an early study, its SRCD spectrum (down to 178 nm) was used to characterize the secondary structure of this primarily β-sheet protein, with a view to developing a vaccine.11 It was also used to monitor conformational transitions produced by thermal, chemical and pH changes. Although at the time chemical denaturation could only be monitored down to 198 nm because of the absorbance of the denaturant (lower wavelength measurements are now possible with short pathlength cells and higher flux beamlines), the high signal-to-noise ratio of SRCD compared to conventional CD allowed greater definition of the changes produced by all methods.
A further example of the utility of SRCD for examining beta sheet components was illustrated by temperature-dependence studies of β-lactoglobulin, which revealed the differential loss of the β-sheet and α-helix components.38 Likewise, a study of the blue copper protein, rusticyanin, where SRCD data down to 175 nm was obtained, suggested that removal of the 35 residue N-terminus resulted in a small increase in β-sheet content.42 This kind of information would not be available in conventional CD spectra due to the domination of helical contributions at wavelengths above 190 nm.
A potential further extension of this sensitivity to beta sheet components will be the ability to monitor the formation or unfolding of beta-sheet structures with stopped-flow techniques. With SRCD it should be possible to monitor structural transitions at single wavelengths below 190 nm; conventional CD signals tend to be too noisy to permit accurate measurements at these wavelengths. Because spectra in the wavelength range between 200 and 222 nm tend to arise from a mixture of both helical and sheet components, it is often difficult to deconvolute the contributions of the two types of secondary structures when monitoring a single wavelength. However, when this data is combined with data from the VUV region, the contributions of these two types of secondary structural components should be readily distinguished.
6.2 Structural genomics: fold recognition and target selection
There are vast quantities of DNA sequence data being generated by genome projects; it is possible to assign the fold and function of many open reading frames (ORFs) from a particular organism by comparison with well-characterized homologues in other organisms. However there are many ORF's that have no structurally defined homologues and many of these proteins will be comprised of new fold motifs. One of the goals of SG is to identify examples of all types of protein folds, and then use that information to improve the prediction of related structures. Of the ∼1000 unique folds estimated to exist, examples of approximately half of them have already been seen. But the number of candidates for the remaining unique folds from the ORFs found in all the genomes sequenced to date is vast. Although the 3D structural determination of proteins as a part of SG programmes has been highly productive, X-ray diffraction is limited to proteins that easily crystallize, and NMR is restricted to relatively low molecular weight proteins. Both methods are time consuming and there is a bias towards proteins that are more amenable to these techniques; therefore a rapid screening method to find potential candidates for new folds to be subjected to structural analysis is required and SRCD may provide the solution.56 This may be possible because proteins with similar beta sheet contents but different folds, produce similar far UV spectra, but significantly different VUV spectra,62 suggesting that SRCD may provide a means of identifying fold motifs or supersecondary structures.Another potential use of SRCD in SG is suggested by the elegant proteomics study of Mycoplasma genitalium.2 In this organism, which has a small genome, potential proteins of unknown function were selected based on bioinformatics studies, and then expressed and screened for secondary structure characteristics and thermodynamic properties using CD. Thermostable and structured proteins were rapidly distinguished from proteins that were unstable or unstructured and those that may require partners for stability were identified. With SRCD, this sort of study could be extended to larger genomes and less readily expressed proteins.
6.3 Structural genomics: carbohydrates and glycoproteins
Most conventional CD studies of glycoproteins tend to ignore contributions due to the carbohydrate components present because the spectral transitions of sugar residues tend to be minimal in the far UV region where the protein backbone transitions dominate. The absence of a significant carbohydrate signal in the UV spectral region is often viewed as an advantageous simplification for structural studies of proteins, but it omits valuable information on the carbohydrate components.Unsubstituted polysaccharides give rise to CD signals below 200 nm due to the ether linkage combined with the ether group in the sugar ring.48,27 Distinct spectral characteristics arise due to the structure of sugar polymers in either helical or disordered conformations.48 In addition, carbohydrates associated with glycoproteins (particularly N-acetyl substituted sugars) sometimes contain substituents with π systems generating weak CD signals at longer wavelengths that overlap with the protein amide peaks.7
An example of the use of SRCD to investigate glycoproteins is provided by a study of voltage gated sodium channels, which are highly glycosylated membrane proteins involved in electrical signalling in muscle and nerve cells. The deglycosylation of sodium channels is associated with modified function and there is a small but significant difference between the conventional CD spectra of native and deglycosylated sodium channels, which could have been due to either a change in secondary structure upon deglycosylation or the loss of the contribution due to the CD signal from the sugar. The principal carbohydrate components of sodium channels are polymers containing N-acetylhexosamines and N-acetylneuraminic acid, which have functional groups giving rise to signals at 190–200 nm along with the ether signal below 180 nm. Both the high signal-to-noise ratio and the low wavelength range of SRCD was essential to demonstrate that the observed differences in the spectra of native and deglycosylated proteins were due to the removal of the signal due to the sugar moiety rather than due to a change in protein conformation.7
6.4 Structural genomics: membrane proteins
CD is especially useful for studies of membrane proteins, which are notoriously difficult to crystallize and are generally unsuitable for NMR due to their size and low solubility. As a result, membrane proteins are significantly underrepresented in the Protein Data Bank (PDB).3 This is unfortunate since membrane proteins are the primary targets of many drugs and represent between 20 and 35% of all ORFs in most genomes. Conventional CD studies have been complicated by the presence of lipid and/or detergent components, which can produce artifacts in the spectra,58 including differential scattering and absorption flattening. However those artifacts can be minimized by collecting the data using SRCD.54 In addition, there appears to be shift in wavelength of the peaks of membrane proteins compared to those of soluble proteins of similar structure,60 probably as a result of the different dielectric constant of the lipid bilayer relative to aqueous solution. A specific reference database of membrane protein SRCD spectra is under construction61 and should improve the accuracy of both CD and SRCD studies of membrane proteins in the future.6.5 Structural genomics: macromolecular complexes
Most structural genomics programmes to date have focused on single protein structures; however it is clear from a wide range of proteomics and binding studies that a very significant proportion of proteins exist not as isolated monomers but as macromolecular complexes in vivo. SRCD is a good method for characterising conformational changes associated with macromolecular interactions, either with other proteins, nucleic acids or lipid molecules.For example, it is now known that many isolated proteins have “natively unfolded” structures. When bound to other macromolecules, the disordered regions tend to refold to form regular secondary structures. SRCD is especially suitable for these types of studies as it permits monitoring of changes in the low wavelength regions, where unordered structures typically have significant spectra (as opposed to the far UV region where their spectra are small and nondescript). Recent examples of the use of SRCD for these types of studies include the SHERP and HASPB proteins from Leishmania16,36 and the binding of the phosphopeptide of rhodopsin to arrestin (Wallace & Hargraves, in preparation).
6.6 Functional genomics: identification of ligands
Structural genomics programmes have been very successful in determining the structures of new proteins with low homologies to existing protein structures, thereby adding to the pool of known protein folds. However for a structure determined as part of a SG programme to be fully valuable, knowledge of its function is essential. Often a structure does not give sufficient hint as to what the enzymatic action or structural role of the protein is, and thus there have been major efforts to use bioinformatics techniques to discern functional roles for these proteins. SRCD (especially once high thoughput methods (see Section 7.2) are available) has the potential to play a role in this by virtue of its high sensitivity to conformational changes that may occur upon ligand binding.57 Of course not all proteins undergo conformational changes involving their secondary structures, and in such cases conventional CD may not be useful (tertiary changes can be monitored in the near UV region, but these signals are very small, depend on the presence of aromatic amino acids in the affected region, and are difficult to interpret). However, because SRCD can monitor conformational changes involving not only secondary structures in the far UV but also through-space changes associated with charge transfer transitions in the VUV, it is less restrictive than conventional CD in its requirements for the nature of the changes to be monitored.A recent example of this type of study has been to identify the potential ligands transported by a porin membrane protein with low sequence homology to any known porin. This has been accomplished by challenging the protein with a panel of 70 potential ligands (Miles, Wien, Jormakka, Byrne, and Wallace, unpublished results). Spectral changes were seen only for a single potential ligand, thus suggesting that this maybe related to the functional role of the protein.
6.7 Functional genomics: mutant proteins associated with disease
The availability of the three-dimension crystal structure of a protein causally associated with a disease is very valuable in understanding the molecular bases of the disease and in aiding the process of rational drug design for development of pharmaceuticals to treat the disease. Knowledge of how the native protein differs from the mutant protein is especially important for this process, although it is not always possible to obtain structures for the mutant proteins, perhaps due to differences in solubility or stability or other characteristics necessary for producing crystals. In this case SRCD can be used to compare the native and mutant proteins in solution, and in combination with the native protein crystal structure and other biophysics and bioinfomatics studies, provide information on the changes associated with the mutant that produces the diseased state.An example of this use of SRCD was to compare the structures of native human gamma-D-crystallin, an eye lens protein, with the T32S mutant of the protein that causes cataract.10 A critical aspect of the study was that conventional CD was insufficiently sensitive to accurately define the differences between the wild type and mutant proteins (the spectral differences were smaller than the error bars associated with the measurements). However, with its enhanced sensitivity and signal-to-noise ratios, clear and significant differences could be seen in the SRCD spectra; these were attributable to a number of residues changing from disordered to beta-sheet conformations, which could be rationalised with the crystal structure of the native protein.
7.0 Future prospects and developments for SRCD
Whilst the viability of SRCD as a physical technique was shown more than 20 years ago,50,45 demonstrations of its applications in the biological and chemical sciences have been much more recent.54 Many of these have relied on the development of appropriate means of sample handling, software for data collection and processing, and proof-of-principle experiments, all of which are now in place. Hence it is expected that this technique will grow in utility and that new applications for it will continue to be found in the next several years. These developments will continue to rely on technological innovations and increased availability of sites where SRCD measurements can be made.7.1 Availability of SRCD beamlines worldwide
At the time of writing (August, 2005) there are more than 40 synchrotron storage rings in operation, with a further 20 or more currently under construction worldwide. At present there are SRCD beamlines at the NSLS Brookhaven, USA (beamlines U9b and Ul1), ISA in Aarhus, Denmark (UV_1), the SRS Daresbury, UK (CD12),5 HSRC/HiSOR, Hiroshima, Japan,29 BESSY2 in Berlin, Germany, the BSRF in Beijing, China39 and NSRL in Hefei, China, with other beamlines being developed at Diamond (UK) – the replacement for the SRS Daresbury, at Soleil, France,34 and at Melbourne, Australia;55 other SRCDs are in the planning stages at other sites worldwide. A distinct advantage of SRCD beamlines is that they are compatible with lower energy rings (ISA is a 0.6 GEV ring, and HiSOR is 0.7 GEV), so even sources that are not suitable for protein crystallography can be used for structural biology applications with SRCD. For sources that do have protein crystallography beamlines, the complementarity of SRCD will make it a useful adjunct.55 As a consequence, the development and availability of SRCD beamlines on new and existing synchrotrons is likely to grow significantly over the next few years.7.2 Technical developments
Measuring time-dependent changes in spectra is an excellent means of following folding/unfolding processes of proteins. SRCD is especially suited for this type of experiment as it requires only small amounts of material for stopped-flow and kinetic studies, and its sensitivity means it has the potential for making single wavelength measurements over the very short time periods compatible with protein folding processes.9 However, the ability to detect a whole spectrum simultaneously (using white light) instead of monitoring at single wavelengths will obviously make this an even more exciting tool for investigating protein folding or fast kinetic reactions. Developments in detector technology should make this possible.26 When used in conjunction with fast stopped flow and continuous flow devices and the high light flux available from second and third generation SR sources, this technology will be capable of measuring rates that are faster by approximately two orders of magnitude (to ∼20 µs), the limit imposed by the modulator frequency. Potentially even the modulator limitation could be overcome if new beamlines were designed to take advantage of the circularly polarized regions of beam produced by synchrotrons to simultaneously irradiate a sample with left- and right-circularly polarized light.Other technical developments in progress that will augment the utility of SRCD include development of high throughput and robotics sample handing, remote monitoring and control of data collection, instrumentation that enables simultaneous fluorescence, plus absorption and SRCD measurements,49 and the ability to measure circular and linear dichroism on the same sample.69 Monitoring linear dichroism will be important feature for future studies of oriented samples8 and crystals, since linear dichroism can dominate – and distort – CD spectra in these types of samples. All these developments should expand the type and number of samples that can be investigated using this technique.
7.3 The protein circular dichroism data bank (PCDDB), a bioinformatics resource for CD and SRCD spectroscopy
The development of a deposition data bank (the PDB) for protein crystal data many years ago was a hallmark in the progress of protein crystallography; it made protein structures available to both the specialist structural and non-specialist biological communities. The availability of SRCD (and CD) data in a parallel publicly-accessible data bank will be an important development for this field as a tool for bioinformatics data mining, as an enduring archive, and as a means of traceability in the pharmaceutical industry. Such a data bank, the Protein Circular Dichroism Data Bank (the PCDDB) is currently under development55 with input from international experts at SRCD sites and CD facilities. It will include spectroscopic validation software (to parallel the crystallographic validation software in the PDB) as a means of assuring that the deposited data is sound. Mirror deposition sites will be available at SRCD beamlines. This development will enhance the accessibility of SRCD data to the broader structural biology community.8.0 Summary
In summary, whilst SRCD instrumentation that takes advantage of the bright light produced by a synchrotron was first developed in the 1980s, applications of the method in structural and functional genomics have only just now begun to be realized. The additional low wavelength data, the high sensitivity resulting in lower sample requirements, faster measurements and higher signal-to-noise levels, all make this evolving technique especially suitable for structural biology studies in the post-genomic era.Acknowledgements
Our SRCD studies have been supported by grants from the BBSRC to BAW. AJM was supported by a studentship from the MRC. Beamtime access to the SRS Daresbury has been enabled by a Programme Mode Access grant to BAW and Dr R. W. Janes (Queen Mary, University of London). Beamtime access at ISA was enabled by the European Community – Research Infrastructure Action under the FP6 “Structuring the European Research Area” Programme to Soren Pape Moller (Aarhus University). Beamtime at the National Synchrotron Light Source, Brookhaven National Laboratory is supported by the U.S. Department of Energy, Division of Materials Sciences and Division of Chemical Sciences, under Contract No. DE-AC02-98CH10886.We thank Dr Robert W. Janes (Queen Mary) and members of the Wallace lab group (Birkbeck College) for helpful discussions. We thank the following for their help and advice at the SRCD beamlines: Dr Soren Vronning Hoffman (ISA), Dr John Sutherland and John Trunk (NSLS), and Dr David Clarke and Alan Brown (SRS).
References
- M. A. Andrade, P. Chacón, J. J. Merelo and F. Morán, Protein Eng., 1993, 6, 383–390 CAS.
- S. Balasubramanian, T. Schneider, M. Gerstein and L. Regan, Nucleic Acids Res., 2000, 28, 3075–3082 CrossRef CAS.
- H. M. Berman, J. Westbrook, Z. Feng, G. Gilliland, T. N. Bhat, H. Weissig, I. N. Shindyalov and P. E. Bourne, Nucleic Acids Res., 2000, 28, 235–242 CrossRef CAS.
- C. T. Chang, C. S. Wu and J. T. Yang, Anal. Biochem., 1978, 91, 13–31 CAS.
- D. T. Clarke and G. R. Jones, J. Synchrotron Radiat., 2004, 11, 142–149 CrossRef.
- D. T. Clarke, M. A. Bowler, B. D. Fell, J. V. Flaherty, A. F. Grant, G. R. Jones, M. L. Martin-Fernandez, D. A. Shaw, B. Todd, B. A. Wallace and E. Towns-Andrews, Synchrotron Radiat. News, 2000, 13, 21–27 Search PubMed.
- N. B. Cronin, A. O'Reilly, H. Duclohier and B. A. Wallace, Biochemistry, 2005, 44, 441–449 CrossRef CAS.
- C. Dicko, D. Knight, J. M. Kenney and F. Vollrath, Biomacromolecules, 2004, 5, 758–767 CrossRef CAS.
- A. J. Doig, C. D. Andrew, D. A. E. Cochran, E. Hughes, S. Penel, J. K. Sun, B. J. Stapley, D. T. Clarke and G. R. Jones, Biochem. Soc. Symp., 2001, 68, 95–110 Search PubMed.
- P. Evans, K. Wyatt, G. J. Wistow, O. A. Bateman, B. A. Wallace and C. Slingsby, J. Mol. Biol., 2004, 343, 435–444 CrossRef CAS.
- L. L. France, J. Kieleczawa, J. J. Dunn, G. Hind and J. C. Sutherland, Biochim. Biophys. Acta, 1992, 1120, 59–68 CAS.
- E. Gasteiger, A. Gattiker, C. Hoogland, I. Ivanyi, R. D. Appel and A. Bairoch, Nucleic Acids Res., 2003, 31, 3784–3788 CrossRef CAS.
- A. T. B. Gilbert and J. D. Hirst, THEOCHEM, 2004, 675, 53–60 CrossRef CAS.
- S. C. Gill and P. H. von Hipple, Anal. Biochem., 1989, 182, 319–326 CAS.
- N. J. Greenfield, Anal. Biochem., 1996, 235, 1–10 CrossRef CAS.
- C. Guerra-Giraldez, B. Moore, B. Neves, B. A. Wallace, D. I. Svergun, K. A. Brown and D. F. Smith, 3rd International Congress on Leishmania and Leishmaniasis, 2005 Search PubMed , abstracts.
- G. W. Haupt, J. Res. Natl. Bur. Stand., 1952, 48, 414–423 Search PubMed.
- J. P. Hennessey and W. C. Johnson, Jr., Biochemistry, 1981, 20, 1085–1094 CrossRef CAS.
- R. W. Janes, Bioinformatics, 2005 DOI:10.1093/bioinformatics/bti690.
- R. W. Janes and A. L. Cuff, J. Synchrotron Radiat., 2005, 12, 524–529 CrossRef CAS.
- W. C. Johnson, Jr., Proteins: Struct., Funct., Genet., 1990, 7, 205–214 CAS.
- W. C. Johnson, Jr., Proteins: Struct., Funct., Genet., 1999, 25, 307–312.
- W. C. Johnson and I. Tinocco, J. Am. Chem. Soc., 1972, 94, 4389 CrossRef.
- S. M. Kelly, T. J. Jess and N. C. Price, Biochim. Biophys. Acta, 2005, 1751, 119–139 CAS.
- J. G. Lees, B. R. Smith, F. Wien, A. J. Miles and B. A. Wallace, Anal. Biochem., 2004, 332, 285–289 CrossRef CAS.
- S. Manolopoulos, D. Clarke, G. Derbyshire, G. Jones, P. Read and M. Torbet, Nucl. Instrum. Methods Phys. Res., 2004, 531, 302–306 Search PubMed.
- K. Matsuo and K. Gekko, Carbohydr. Res., 2004, 339, 591–597 CrossRef CAS.
- K. Matsuo, R. Yoneharo and K. Gekko, J. Biochem. (Tokyo), 2004, 135, 405–411 Search PubMed.
- K. Matsuo, T. Fukuyama, R. Yonehara, H. Namatame, M. Taniguchi and K. Gekko, J. Electron Spectrosc. Relat. Phenom., 2005, 144, 1023–1025 CrossRef.
- A. J. Miles, L. Whitmore and B. A. Wallace, Protein Sci., 2005a, 14, 368–374 Search PubMed.
- A. J. Miles, F. Wien and B. A. Wallace, Anal. Biochem., 2004, 335, 338–339 CrossRef CAS.
- A. J. Miles, F. Wien, J. G. Lees and B. A. Wallace, Spectroscopy, 2005b, 19, 43–51 Search PubMed.
- A. J. Miles, F. Wien, J. G. Lees, A. Rodger, R. W. Janes and B. A. Wallace, Spectroscopy, 2003, 17, 653–661 Search PubMed.
- S. Miron, M. Refregiers, A. Gilles and J. Maurizot, Biochim. Biophys. Acta, 2005, 1724, 425–431 CrossRef CAS.
- A. J. W. Orry, R. W. Janes, R. Sarra, M. R. Hanlon and B. A. Wallace, J. Synchrotron Radiat., 2001, 8, 1027–1029 CrossRef CAS.
- C. Panethymitaki, B. A. Wallace, D. I. Svergun, S. Stager, P. M. Kaye, K. A. Brown and D. F. Smith, 3rd International Congress on Leishmania and Leishmaniasis, 2005 Search PubMed in press.
- S. W. Provencher and J. Glockner, Biochemistry, 1981, 20, 33–37 CrossRef CAS.
- X. L. Qi, C. Holt, D. McNulty, D. T. Clarke, S. Brownlow and G. R. Jones, Biochem. J., 1997, 324, 341–346 CAS.
- H. J. Qian, Y. L. Yan and Y. Tao, High Energy Phys. Nucl. Phys.-Chinese Edition, 2003, 27, 125–128 Search PubMed.
- A. L. Rucker and T. P. Creamer, Protein Sci., 2002, 11, 980–985 CAS.
- A. Savitsky and M. J. E. Golay, Anal. Chem., 1964, 36, 1627–1639 CrossRef CAS.
- D. J. Scott, J. G. Grossmann, J. R. H. Tames, O. Byron, K. S. Wilson and B. R. Otto, J. Mol. Biol., 2002, 315, 1179–1187 CrossRef CAS.
- L. Serrano-Andres and M. P. Fülscher, J. Am. Chem. Soc., 1998, 120, 10912–10920 CrossRef CAS.
- R. A. G. Silva, S. C. Yasui, J. Kubelka, F. Formaggio, M. Crisma, C. Toniola and T. Keiderling, Biopolymers, 2002, 65, 229–243 CrossRef CAS.
- P. A. Snyder and E. M. Rowe, Nucl. Instrum. Methods, 1980, 172, 345–349 CrossRef CAS.
- N. Sreerama and R. W. Woody, Anal. Biochem., 2000, 287, 252–260 CrossRef CAS.
- N. Sreerama, S. Y. Venyaminov and R. W. Woody, Protein Sci., 1999, 8, 370–380 CAS.
- E. S. Stevens, in Circular Dichroism and the Conformational Analysis of Biomolcules. ed. G. D. Fasman, Plenum Press, New York, 1996, pp. 501–530 Search PubMed.
- J. C. Sutherland, P. C. Keck, K. P. Griffin and P. Z. Takacs, Nucl. Instrum. Methods Phys. Res., 1982, 195, 375–379 CrossRef CAS.
- J. C. Sutherland, E. J. Desmond and P. Z. Takacs, Nucl. Instrum. Method., 1980, 172, 195–199 Search PubMed.
- T. Takakuwa, T. Konno and H. Meguro, Anal. Sci., 1985, 1, 215–218 CAS.
- A. Toumadje, S. W. Alcorn and W. C. Johnson, Jr., Anal. Biochem., 1992, 200, 321–331 CrossRef CAS.
- B. A. Wallace, Nat. Struct. Biol., 2000a, 7, 708–709 Search PubMed.
- B. A. Wallace, J. Synchroton Radiat., 2000b, 7, 289–295 Search PubMed.
- B. A. Wallace, Aust. Biochem., 2005, 36, 47–50 Search PubMed.
- B. A. Wallace and R. W. Janes, Curr. Opin. Chem. Biol., 2001, 5, 567–571 CrossRef CAS.
- B. A. Wallace and R. W. Janes, Biochem. Trans., 2003, 31, 631–633 Search PubMed.
- B. A. Wallace and D. Mao, Anal. Biochem., 1984, 142, 317–328 CrossRef CAS.
- B. A. Wallace and C. L. Teeters, Biochemistry, 1987, 26, 65–70 CrossRef CAS.
- B. A. Wallace, J. G. Lees, A. J. W. Orry, A. Lobley and R. W. Janes, Protein Sci., 2003, 12, 875–884 CrossRef CAS.
- B. A. Wallace, L. Whitmore and R. W. Janes, Proteins: Struct., Funct., Bioinf, .2005 DOI:10.1002/prot.20676.
- B. A. Wallace, F. Wien, A. J. Miles, J. G. Lees, S. V. Hoffman, P. Evans, G. J. Wistow and C. Slingsby, Faraday Discuss., 2004, 126, 237–243 RSC.
- L. Whitmore and B. A. Wallace, Nucleic Acids Res., 2004, 32, 668–673.
- F. Wien and B. A. Wallace, Appl. Spectrosc., 2005, 59, 1109–1113 CrossRef CAS.
- F. Wien, A. J. Miles, J. G. Lees, S. Vrønning Hoffmann and B. A. Wallace, J. Synchrotron Radiat., 2005, 12, 517–523 CrossRef CAS.
- R. W. Woody, Adv. Biophys. Chem., 1992, 2, 37–79 Search PubMed.
- R. W. Woody, in Circular Dichroism and the Conformational Analysis of Biomolcules. ed. G.D. Fasman, Plenum Press, New York, 1996, pp.25–67 Search PubMed.
- R. W. Woody and A. K. Dunker, in Circular Dichroism and the Conformational Analysis of Biomolcules, ed. G. D. Fasman, Plenum Press, New York, 1996, pp. 109–157 Search PubMed.
- K. Yagi-Watanabe, T. Yamada, M. Tanaka, F. Kaneko, T. Kitada, Y. Ohta and K. Nakagawa, J. Electron Spectrosc. Relat. Phenom., 2005, 144, 1015–1018 CrossRef.
| This journal is © The Royal Society of Chemistry 2006 |