Effect of fingerprint conformation and spectral scaling on the performance of computer screen photo-assisted experiments
D.
Filippini
and
I.
Lundström
Division of Applied Physics, Department of Physics and Measurement Technology, Linköping University, S-581 83, Linköping, Sweden. E-mail: danfi@ifm.liu.se
First published on 28th November 2005
Abstract
The use of computer screens as controlled light sources and web cameras as image detectors (the so-called computer screen photo-assisted technique, CSPT) is an ubiquitous alternative for the evaluation of colorimetric quick tests at homes or in primary care units. The performance of CSPT for such evaluations depends on several factors, from which the most relevant are the composition of illuminating sequences and the conformation of CSPT substance signatures. In this work, with the aid of a CSPT model, the effect of the construction of the substance signatures on the classification performance of different representative substance sets is studied. The correlation of illuminating colors with such classification is investigated, allowing one to determine redundancy and limitations with respect to visible spectroscopy. The concept of spectral scaling is introduced and its properties compared with standard procedures.
Introduction
The computer screen photo-assisted technique (CSPT) utilizes the casual combination of familiar devices such as regular computer sets and web cameras for the evaluation of colorimetric or fluorescent substances. The ubiquity of these elements makes it an attractive alternative for the evaluation of colorimetric tests in the point of care1,2 or home scenario.CSPT is compatible with numerous sensing principles like e.g. ELISA tests,3 cell viability tests,4 fluorescent indicators,5 whole cell assays,6 colorimetric assays,7etc. In a CSPT measurement the tested assay is illuminated by a color sequence displayed by an area of the computer screen, while the image of the assay is recorded by the web camera in synchronism with the illumination. The result is a video stream from which spectral signatures from selected regions of interest (ROI) can be extracted.5
So far CSPT fingerprints (a distinctive spectral signature of the substances) are either difference or ratio fingerprints depending on how the spectral features of the used platform are compensated. The way that these CSPT signals are composed has a main impact on the ability to distinguish the tested substances and consequently to evaluate the tests. The amount of colors used for illumination and the selection of these colors in relation to the evaluated substance sets are also relevant. All these aspects have been acknowledged in a number of studies,3–7,11 however, a deeper understanding of the limitations and possibilities of this method requires a detailed analysis of the operating conditions and the way the CSPT signals are composed.
In this work, the effect of the most common types of CSPT signal compositions on the classification performance is investigated with the aid of a mathematical model. The correlation of illuminating colors with the signal features is established, allowing one to assess the virtues and weaknesses of the different alternatives. The concept of spectral scaling is introduced and compared with standard procedures and with the spectroscopic performance for different operating scenarios.
CSPT model
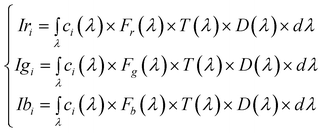
A liquid crystal display (LCD) computer screen is a light source composed of multiple single elements (pixels) with specific emission distributions that constitute a collective source. Also multiple elements compose the image detectors; however, these aspects are not central for the purpose of the present work and a simple single element source and detector model, exclusively considering absorbing substances is implemented.In this context, a color ci displayed on the screen of a computer, and specified by the triplet (ri, gi, bi) that indicates the modulation of the screen primary spectral radiances R(λ), G(λ) and B(λ) produces an intensity in the web camera that can be written as:
 | (1) |
| ci(λ) = riR(λ) + giG(λ) + biB(λ) | (2) |
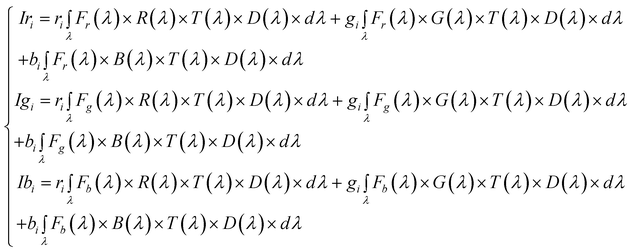
Introducing eqn (2) in eqn (1) and rearranging:
 | (3) |
 | (4) |
The intensities measured in this way contain the spectral information that would allow spectral reconstruction,8–10 but also the spectral characteristics of the platform embedded in the signature. So far, two main approaches have been followed for highlighting the substance features: difference CSPT fingerprints and ratio CSPT fingerprints depending on how a reference measurement for a sample with T(λ) = 1 is used. These two methods give different results such as more or less intuitive fingerprints, different performances with fluorescent substances or diverse classification properties11 that will be analyzed throughout the rest of this contribution.
Difference CSPT fingerprints
In this kind of fingerprint the spectral signature of the substance is highlighted by subtracting the spectral signature of the setup (T(λ) = 1).Eqn (5) and (6) describes this procedure.
 | (5) |
 | (6) |
Naturally, the narrower the spectral window the better separation of the substance from the instrument spectral characteristics, however, these are given features in CSPT setups. As shown in eqn (7) the terms of ΔS[T(λ)] remain functions of the particular screen and camera characteristics used in the experiment.
Although imperfect, the difference fingerprints require less illuminating colors for producing the same classification than the ratio CSPT fingerprints (as discussed later), and provide a clear distinction between predominant emission (positive values of ΔS) and absorption (negative values of ΔS).
Spectral scaling
Overlaps between camera filters and polychromatic primaries cause all the nine terms of S in eqn (4) to have a contribution; however, not all of them have the same magnitude. The approach of spectral scaling consists of re-normalizing all nine windows to rescue their contributions. In a practical CSPT measurement this would consist of scaling the recorded intensities (the spectral windows are not accessible, but only their integral) with those recorded for T(λ) = 1.Considering a three color illuminating sequence that maps the terms of S in the intensity profile, we can write:
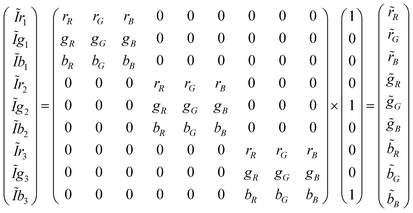 | (7) |
 ) are computed as:
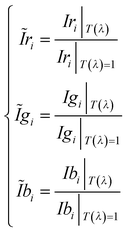 | (8) |
Ratio CSPT fingerprints
The use of ratio fingerprints was the first processing approach in CSPT experiments, and defined several of the involved measuring and analysis procedures. It was based on stressing similarities with visible absorption spectroscopy and with the way that substance signatures such as the spectral transmittances are computed. In this kind of fingerprint the intensities from the three camera channels for a particular illumination i, are composed as:| Ii = ri(rR + gR + bR) + gi(rG + gG + bG) + bi(rB + gB + bB) | (9) |
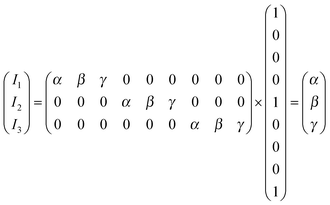 | (10) |
 | (11) |
Ratio CSPT fingerprints are finally computed similarly to spectral transmittances as:
 | (12) |
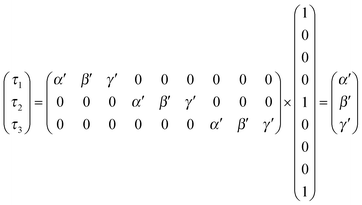 | (13) |
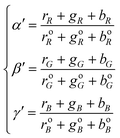 | (14) |
 | (15) |
Results and discussion
Fig. 1 shows the effect of spectral scaling on the difference CSPT fingerprints for a particular illumination composed of the three screen primaries. In Fig. 1a the difference fingerprints of 4 color substances are show together with the corresponding substance spectra. The illuminating colors and camera filters corresponding to each point of the fingerprints is indicated in the figure.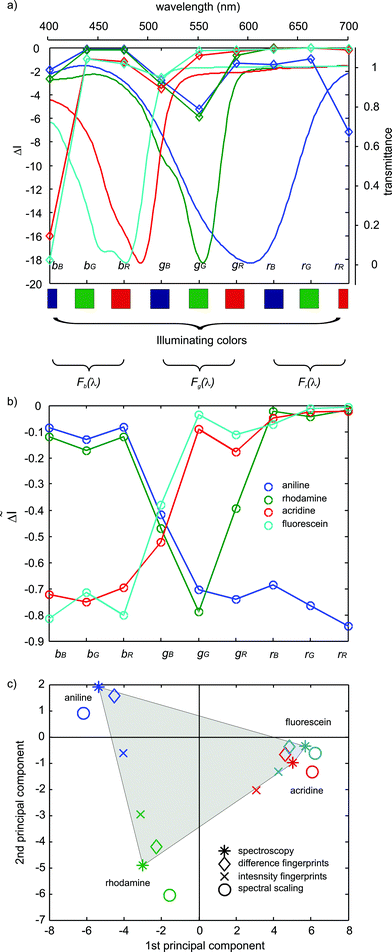 | ||
| Fig. 1 (a) Difference CSPT fingerprints of four substance transmittances obtained by an illuminating sequence composed only of the three primary spectral radiances of the screen. The surface transmittances are displayed as well. (b) Spectrally scaled difference CSPT fingerprints of the substances shown in (a), obtained by a illuminating sequence composed only of the three primary spectral radiances of the screen. (c) First two principal components scores of the difference CSPT fingerprints (◇), the spectrally scaled difference CSPT fingerprints (○), the classification directly from intensity values (×) and the substance spectral transmittances (*). | ||
The different magnitude of the spectral windows can be appreciated in Fig. 1a, since the information is concentrated along the terms corresponding to the main diagonal of S, those formed by blue light-blue filter, green light-green filter, etc. By contrast, in the spectrally scaled fingerprints (Fig. 1b) all terms are well represented and their magnitudes represent the modulation introduced by the tested substances. The scaled fingerprints clearly reflect the shape of the substance spectra, and are even able to reproduce subtle features as the double peak of fluorescein, which is completely lost in the regular difference fingerprints. In order to efficiently compare the ability of such signals to discriminate the different substances principal components analysis (PCA12) of the data is performed, which allows one to represent the same multidimensional vectors by two or three dimensional points that explain more than 80% of the information contained in the original signals. Fig. 1c shows the corresponding principal components (PCs) of the fingerprints, and of the substance transmittances measure by a spectrophotometer. The classification retains the spectral similarities such as in the case of fluorescein and acridine orange, the scores of which are close to each other in the plot. The scores corresponding to the substance transmittances (*) are the reference and its distribution is highlighted by a grey area. From Fig. 1c it becomes evident that the subtraction of the setup spectral features, although not perfect, contributes to a better classification since the scores corresponding to the difference fingerprints (◇) are closer to the spectroscopy. It is convenient to observe that is not just the minimum distance between scores which should be used to define the performance of the classification but the comparison with the spectroscopy, which is the ultimate signature of these substances. In this case it becomes clear that the large distance observed for the intensity fingerprints (× in Fig. 1c) between fluorescein and acridine (even larger than the spectroscopy) is nothing but the spectral contribution of the CSPT platform.
Certainly, the best classification performance is achieved by the spectrally scaled fingerprints which, except from a rotation in the pattern, show a distribution equivalent to the spectroscopy. This remarkable performance can be explained by the rather smooth spectral characteristics of the involved substances that can be accurately reconstructed with a few bands.9,13
It must be noticed regarding the comparison of PC performances that input vectors with a larger number of variables produce larger distances in the PC plots. Accordingly, in order to fairly compare the classification performances all the fingerprints in this work are re-sampled along 150 elements before computing the principal components.
Not shown in Fig. 1c are the scores of spectrally scaled intensity fingerprints which are the same as those of the spectrally scaled difference fingerprints (○ in Fig. 1c).
Fig. 2 illustrates the behavior of intensity fingerprints computed according to eqn (9), which consequently restricts the vectors to just one element per illuminating color (Fig. 2a). The classification performance (○ in Fig. 2b) is pretty poor compared to the spectroscopy (*) and even the nine term intensity fingerprints (×) are significantly better than these added intensity fingerprints, which cannot group acridine and fluorescein. Considering that the purpose of the method is to distinguish color substances, the possibilities of finding a metameric couple9,10 with just three point fingerprints (such as in Fig. 2a) is clearly larger than with nine bands. Since CSPT platforms are a casual assembly of components rather than a strictly defined instrument, the fingerprint constitution becomes vital to improve the robustness of the detection.
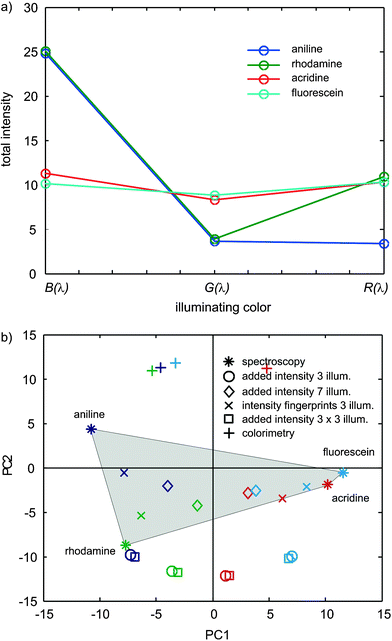 | ||
| Fig. 2 (a) CSPT fingerprints of added intensities for the four considered substances using three primary illuminations. (b) First two principal components corresponding to the fingerprints in Fig. 2a (○), to independent channels composition (×) and to the classification of the substance transmittances (*) used as reference. (◇) Corresponds to total intensity features using seven illuminating colors, □ corresponds to a nine colors sequence composed of the repetition of the three screen primaries and + to the three chromatic evaluations using white illumination. All fingerprints are re-sampled to 150 elements before computing the PCA. | ||
A commonly used approach in CSPT measurements is to illuminate with sequences longer than three colors, which in principle contain redundant colors. By increasing the number of illuminating colors to 7 (◇ in Fig. 2b), the classification of added intensity fingerprints improves (becomes closer to the pattern of the spectroscopic scores).
Although formed by a combination of screen primaries, the considered color sequence can retain, up to certain extent, part of the 9 spectral bands in the added intensities. For instance, an illuminating color j = [1 0 1] will produce parameters such as:
 | (16) |
It is also illustrative to corroborate that not any long sequence contributes additional discrimination. For instance, using a nine color illumination formed by three repetitions of the original three primary illuminations (□ in Fig. 2b), the achieved performances are the same as with the three color illumination (○ in Fig. 2b). The result underscores that a proper illuminating sequence longer than three colors can improve the spectral contents of the measured fingerprints or at least to highlight differences between the compared vectors.
Beyond the fact that repeated sequences are valuable for canceling random noise, the present result also indicates that the length of the illuminating sequence does not guarantee a better performance of the classification by itself. On the other hand sensibly longer sequences do not harm, and offer a valuable degree of freedom in operating scenarios where the optimum sequence for a particular target set of substances is ignored. It must also be noticed that the present model does not consider the noisy illuminating and recording environment, which also implies a certain distribution of optimum conditions than can be supplied by a longer collection of slightly different illuminations.
Fig. 2b (+) also shows the performance of intensity fingerprints obtained from the standard three chromatic evaluation using white illumination, which corresponds to the worst classification performance of all.
Fig. 3a displays the first two principal components of the ratio fingerprints corresponding to the three primary illuminations (□), seven illuminating colors (◇) and three repetitions of the primaries (×). The classification of the transmittance spectra (* and grey area) is used as reference. The same symbols, but with smaller sizes indicate the performance of the difference fingerprints.
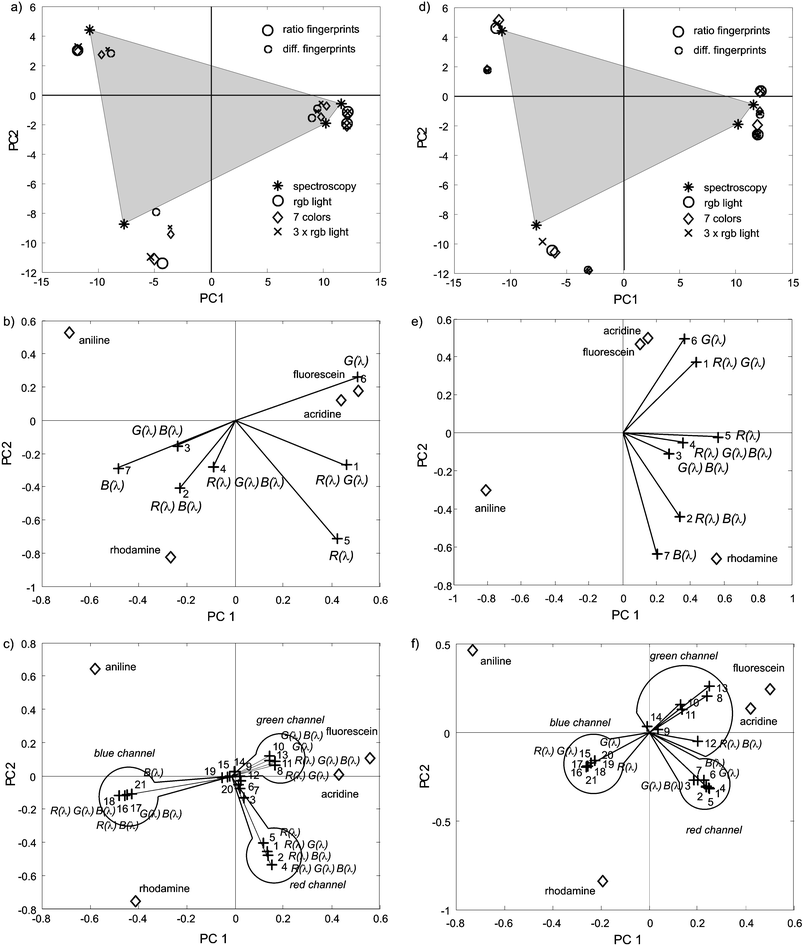 | ||
| Fig. 3 (a) First two principal components of ratio (large symbols) and difference (small symbols) fingerprints obtained for a three primaries illuminating sequence (○), a seven colors illuminating sequence (◇) and for the three times repetition of the primaries (×). The classification of the transmittance spectra (*) and the grey area are used as reference. (b) Biplot of the ratio fingerprints for the case of seven illuminating colors. (c) Biplot of the difference fingerprints for the case of seven illuminating colors. (d) First two principal components of ratio (large symbols) and difference (small symbols) fingerprints with spectral scaling obtained for a three primaries illuminating sequence (○), a seven colors illuminating sequence (◇) and for the three times repetition of the primaries (×). The classification of the transmittance spectra (*) and the grey are used as reference. (e) Biplot of the spectrally scaled ratio fingerprints for the case of seven illuminating colors. (f) Biplot of the spectrally scaled difference fingerprints for the case of seven illuminating colors. | ||
A first observation is that the composition of ratio fingerprints (eqn (12)) has a stronger beneficial effect on the classification with respect to total intensity fingerprints (Fig. 3a and Fig. 2b), than the difference fingerprints with respect to the intensity fingerprints (Fig. 1c). This suggests a more efficient disentanglement of the substance features from the setup. As already shown, difference fingerprints with three illuminating colors (nine terms) produce substance classifications (small ○ in Fig. 3a) closer to the spectroscopy (* in Fig. 3a), however, it must be noticed the rather good performance of the ratio fingerprints with only three element vectors (big ○ in Fig. 3a), which should be mostly attributed to this particular set of substances. For this set of transmittances there are not any dramatic improvements in the classification by increasing the amount of illuminating colors (◇ and × in Fig. 3a), but in general the classifications might involve any collection of color substances, and frequently with only subtle color differences, for which the larger the number of considered spectral terms the more robust the result and the greater the flexibility to choose the best measuring conditions.
For the case of seven illuminating colors (◇ in Fig. 3a) the correlation of the illumination with the ratio and difference fingerprints is examined with the help of the biplot12 representation (Fig. 3b and c for ratio and difference fingerprints respectively). In these graphics lines pointing in the same direction indicate that the corresponding variables are correlated with each other and long lines are more important than the short ones. In Fig. 3b, the lines and scores correspond to the 7 variables (1 to 7) describing each ratio fingerprint. The combination of screen radiances used to produce each of these variables, is also indicated in the figures.
Basically, green illumination, which is less absorbed by the orange–green substances acridine and fluorescein (Fig. 1a), is the dominant for the identification of these substances, whereas rhodamine (a red substance absorbing in the green region (Fig. 1a)) shows a large transmittance for red and blue light, to which it becomes correlated in the biplot. Finally, blue aniline (Fig. 1a) absorbs red light which is inversely correlated with the score of aniline (+5 and ◇ aniline in Fig. 3b). Interestingly, white light (+3 in Fig. 3b) is one of the less significant contributions (closer to the origin), due to its completely unspecific character. White light is always absorbed by any substance, leaving behind just small modulations compared with a specific illuminating radiance maximally absorbed by a target substance.
In the case of difference fingerprints (Fig. 3c), the same illuminating sequence produces three times more loads, determined by the combination of camera filters and illuminating radiances. From Fig. 3c it is possible to identify the camera origin of the signals. In the case of difference fingerprints a subset of relevant screen-camera configurations can be associated with individual substances, allowing a more detailed customization of the measuring conditions, and an optimized management of the available information by dismissing non-significant variables (e.g. those close to the origin in Fig. 3c).
The effect of spectral scaling is illustrated in Fig. 3d to f. Spectral scaling improves the separation of the most similar substances (fluorescein and orange acridine) as can be seen in Fig. 3d. The spectral scaling applied to the ratio fingerprints shows a reorganization of the influence of the different variables (Fig. 3e compared with b), with the red–green illumination more correlated with the fluorescein–acridine classification, as well as the blue and red blue light with rhodamine, whereas aniline is correctly correlated with red and green absorption.
In the case of the scaled difference CSPT fingerprints, new illumination-camera conditions gain relevance (only those are indicated in Fig. 3f) and the loads become clearly separated by their significance (e.g. comparing +8, 10, 11, 13 in Fig. 3f with those in Fig. 3c). This last result also shows a classification pattern closer to the spectroscopic performance.
Fig. 4 corresponds to the biplot analysis of the substance spectra, showing a coincident correlation of illuminating colors (in this case monochromatic lines) with the substance scores. The similarity of this pattern with that of the scaled difference fingerprints (Fig. 3f) is partially allowed by the composition of the considered set of substances that enable one to exploit all the possible screen-camera combinations.
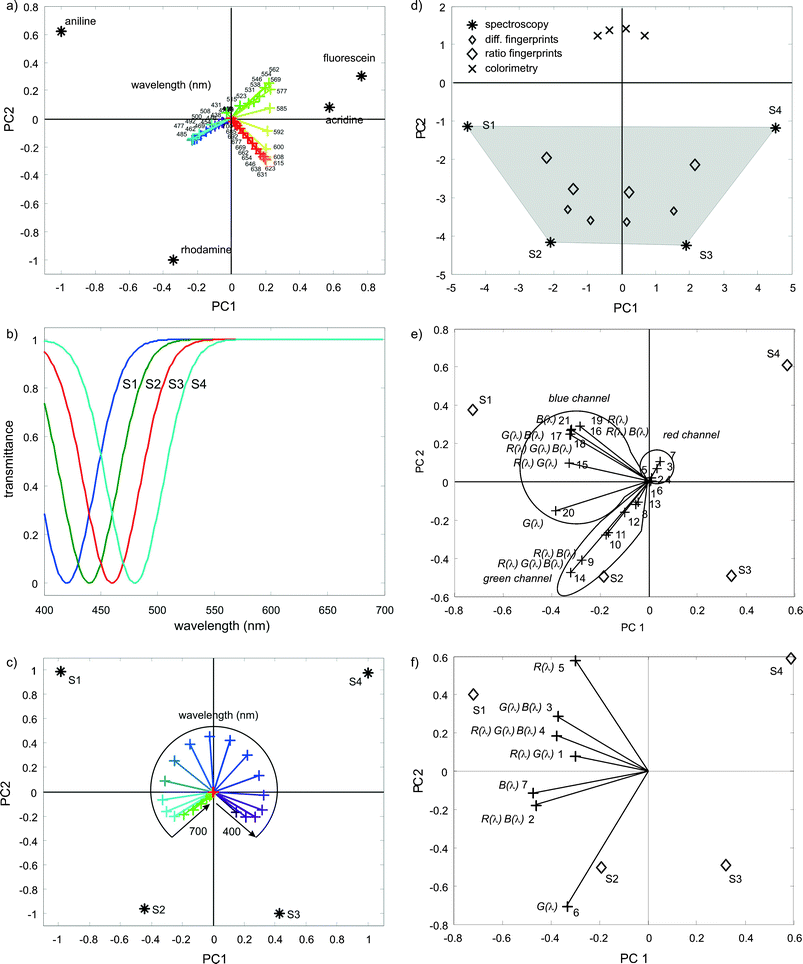 | ||
| Fig. 4 (a) Biplot of the transmittance spectra of blue aniline, rhodamine, fluorescein and orange acridine (*) with the classification of the variables (+, in this case each particular wavelength) displayed with their approximate colors. (b) Set transmittance spectra of four similar blue substances. (c) Biplot of the transmittance spectra of S1, S2, S3 and S4 (*) with the classification of the variables (+, in this case each particular wavelength) displayed with their approximate colors. (d) First two principal components of ratio (large symbols) and difference (small symbols) fingerprints obtained for a seven colors illuminating sequence (◇), and for a three chromatic evaluation (×). The classification of the transmittance spectra (*) and the grey area used as reference. (e) Biplot of the spectrally scaled difference fingerprints for the case of seven illuminating colors. (f) Biplot of the spectrally scaled ratio fingerprints for the case of seven illuminating colors. | ||
Fig. 4a clearly shows three main directions in the biplot with highly correlated (monochromatic) illuminations, except for some particular range of wavelengths that supports the discrimination between fluorescein and acridine. The same behavior can be observed in Fig. 3c and constitutes a clear advantage of CSPT with respect to three chromatic evaluation.
Fig. 4a also suggests that the present set of substances is pretty simple to distinguish, and that using spectroscopy overkills such application. In order to better assess the CSPT limitations a more demanding synthetic set of 4 spectral transmittances (Fig. 4b) just shifted 20 nm from each other is studied.
The biplot of these spectra (Fig. 4c) shows S1 inversely correlated with violet illumination and directly correlated with light blue light, S2 inversely with blue and directly with green light, and so on as the minimum transmittance shift towards longer wavelengths. In the case of counting with monochromatic light it does not matter that yellow or red colors do no participate in the classification since all the spectral lines are available, however, the situation is different in CSPT, since the number of spectral windows is limited and fixed at certain bands. The first consequence is that the CSPT classification will be noticeably poorer than the spectroscopy (* in Fig. 4d), either for scaled difference fingerprints (small ◇ in Fig. 4d) or ratio fingerprints (big ◇ Fig. 4d), although in all cases better than the three chromatic case (× in Fig. 4d).
The ratio fingerprints show a better performance than the difference fingerprints, which can be interpreted as an increased importance of the spectral separation from the setup characteristics in situations where a complete band of observation (e.g. red channel in Fig. 4e) is irrelevant to the classification. The biplot holds (Fig. 4e) some general similarities with respect to the spectroscopic case (Fig. 4f), such as a S1 correlated with the absorption of green-blue light and S2 with green but several direct correlations are missing when compared with the spectroscopy. Beyond these evident limitations, and the fact that for a larger amount of substances the classification is expected to worsen, it must be noticed that actual CSPT experiments typically involve substance sets with 3 to 6 members, for which the present study is representative. These results also suggest that if possible, the substance sets must be composed with substances with maximum absorbencies at the center of the visible spectrum, in order to incorporate most of the spectral bands in the analysis.
Summarizing, difference and ratio fingerprints can be complementary exploited. Scaled difference fingerprints are spectrally richer, require shorter illuminating sequences (that in practical terms enables faster measurements), and provide the best performance for classifying substance sets with substantial differences. On the other hand, the ratio fingerprints allow better substance disentanglement from the platform characteristics, which becomes a dominating feature for classifying sets of similar substances.
Conclusions
Standard CSPT fingerprint composition strategies, their particular characteristics and their effects on the substance classification properties have been analyzed with the help of a CSPT model. From this analysis it can be concluded that for well designed substance sets the spectrally scaled fingerprints provide the spectrally richest fingerprints with the shortest illuminating sequence, whereas ratio fingerprints can be complementarily used for substance sets absorbing at the borders of the visible spectrum. In all cases the classification performance is better than three chromatic evaluations with white illumination.For a noise free system, repeated color sequences have no effect on CSPT classification, but properly chosen long illuminating sequences can help to retain distinctive features. The spectral characteristics of the tested substance set define the classification performance and conveniently chosen substances allow classifications equivalent to regular spectroscopy.
Acknowledgements
This research has been financed by the Swedish Agency for Innovation Systems (VINNOVA) and by the Swedish Research Council.References
- M. Bissell and F. Sanfilippo, Trends Biotechnol., 2002, 20, 269 CrossRef CAS.
- G. J. Fermann and J. Suyama, J. Emerg. Med., 2002, 22, 393 CrossRef.
- D. Filippini, K. Tejle and I. Lundström, Biosens. Bioelectron., 2005, 21, 266 CrossRef CAS.
- D. Filippini, S. P. S. Svensson and I. Lundström, Chem. Commun., 2003, 2, 240 RSC.
- D. Filippini, P. Åsberg, P. Nilsson, O. Inganäs and I. Lundström, Sens. Actuators, B, 2005 DOI:10.1016/j.snb.2005.03.112.
- A. Suska, D. Filippini, T. Andersson and I. Lundström, Biosens. Bioelectron., 2005, 21, 727–734 CrossRef CAS.
- D. Filippini and I. Lundström, Eurosensors XIX, Barcelona, Spain, 2005.
- D. Connah, S. Westland and M. G. A. Thomson, Color. Technol., 2001, 117, 309 CAS.
- S. Westland, J. Shaw and H. Owens, Sens. Rev., 2000, 20, 50 CrossRef.
- S. Westland and C. Ripamonti, Computational colour science, Willey, 2004, ch. 10 Search PubMed.
- D. Filippini, J. Bakker and I. Lundström, Sens. Actuators, B, 2005, 106, 302 CrossRef.
- R. Johnson and D. Wichern, Applied multivariate statistical analysis, Pearson Education Ltd., 2002 Search PubMed.
- L. T. Maloney, J. Opt. Soc. Am., 1986, A3, 1673 Search PubMed.
| This journal is © The Royal Society of Chemistry 2006 |
