DOI:
10.1039/B417653G
(Paper)
Soft Matter, 2005,
1, 69-78
PNA-directed solution- and surface-assembly of shell crosslinked (SCK) nanoparticle conjugates†
Received
26th November 2004
, Accepted 17th February 2005
First published on 10th March 2005
Abstract
The conjugation of complementary peptide nucleic acid (PNA) sequences to well defined shell crosslinked (SCK) nanoparticles is reported as a mechanism by which to direct their self assembly into higher order structures via selective and tunable binding interactions. Base-pairing-driven aggregation of the SCK's occurred for mixtures of SCK's that presented complementary sequences in aqueous sodium chloride solutions and upon mica substrates. The assembly processes were monitored by dynamic light scattering and atomic force microscopy as a function of salt concentration, and by UV-vis spectroscopy as a function of salt concentration and temperature. Moreover, the stoichiometries of the PNA sequences conjugated per SCK nanoparticle and the stoichiometric ratios in the production of mixtures of SCK's bearing complementary PNA sequences were each altered to tune the hierarchical assemblies.
Introduction
Nanofabrication methodologies have advanced rapidly over the past few years,1–6 as a result of improved synthetic nanoparticle preparation methods7–14 and the means by which their assembly can be controlled.15–22 The development of nanoscale materials that are equipped with ligands to mediate their interactions with substrates and direct their self assembly into higher order structures is a promising approach. The production of oligonucleotide derivatized nanoparticles provides a significant advance in programmed materials synthesis, allowing for a ‘building block’ approach, in which the controlled assembly of nanoparticles is facilitated by the oligonucleotide to which they are attached.23,24 Colloidal gold nanoparticles provide a convenient material for use in these assemblies, given the synthetic ease by which the particles are produced with controlled size,11 and have been a primary focus of research thus far.23–29 For example, thiol-modified oligonucleotides tethered to gold nanoparticles have served to promote specific interparticle interactions, maintain particle dispersion, and minimize flocculation in the aqueous environment.24,27 Variants of this process have included more sophisticated methods of attachments,23 including the use of biotin–streptavidin bridges in conjunction with oligonucleotides,26,28 as well as the use of peptide nucleic acids (PNAs) as DNA analogs30,31 to facilitate the selective supramolecular assembly of nanoscopic objects.
Since their introduction in 1991,32 PNAs have received a considerable amount of attention. Owing largely to their peptide-like backbone, PNAs have been shown to bind to complementary single-stranded DNA, RNA, and PNA with high affinity, due in part to a lack of electrostatic interference with the negatively charged phosphate backbone of the native oligonucleotides.33,34 Additionally, PNAs have exhibited greater mismatch selectivity,35 are more enzymatically stable, and are synthesized and derivatized more easily, in comparison to DNA and RNA. As such, PNA represents an ideal material from which robust networks can be fabricated using stoichiometrically functionalized nanoparticles.
Despite this progress, soft materials have been underutilized as potential substrates by which oligonucleotide directed assembly can occur. The conjugation of oligonucleotides to dendritic macromolecules has been demonstrated recently,36 however, the potential of the materials as nanofabrication elements over extended lengths was not explored. Complementary oligonucleotides have also been conjugated to the CowPea Mosaic Virus (CPMV), by virtue of reactive cysteine residues on the surface of the viral capsids, and their resulting assemblies in solution and on surfaces were examined.37
A key advantage resulting from the directed assembly of polymer-based materials is the ability to subsequently manipulate the shape14,38 and composition via physical and chemical modifications,39 to produce highly sophisticated nanostructured materials. Our interest began with the employment of PNAs conjugated to shell crosslinked knedel-like (SCK) nanoparticles for the promotion of selective interactions with biological macromolecules. Fortuitously, however, we observed that even a few PNAs conjugated to a synthetic nanoparticle facilitated their directed assembly to form large nanoparticle arrays in a controlled manner. SCK's40–44 have the added advantage, over other constructs, in that production of the nanoparticles is chemically versatile, which allows for tuning of material properties and sizes.45 The core composition can be varied, to include glassy,38 crystalline,46 or fluid-like materials,47 removed to produce a solvent-filled nanocage,39,46,48 or hydrolyzed to produce an entirely hydrophilic structure.49 Additionally, the shell-layer can be either positively42,43 or negatively charged,50 with reactive functional groups remaining following the crosslinking reaction allowing for subsequent functionalization of the shell layer.47,51 Previous work with SCK's has demonstrated the importance of surface charge on the formation of ordered nanoparticle arrays, in the presence and absence of salts, on hydrophilic and hydrophobic substrates.49,52 Herein, we present the synthesis, characterization, and assembly of PNA-functionalized SCK nanoparticles, under a variety of experimental conditions. The SCK's utilized for this study were comprised of hydrophobic, glassy polystyrene cores covalently attached to a hydrophilic, hydrogel-like poly(acrylic acid-co-acrylamide) shells.
Results and discussion
The strategy for the PNA-directed assembly of organic nanoparticles relied upon a stepwise assembly–stabilization–functionalization–assembly approach. Well-defined polymer micelles are produced in the first assembly step via hydrophobic interactions between amphiphilic block copolymers, which are then stabilized covalently to afford robust nanoscale objects (the SCK nanoparticles)
via crosslinking reactions throughout the coronal chain segments. PNA conjugation then establishes surface functionalities to guide the second assembly process, that of the organic nanostructure. By this process, which can be performed repeatedly, hierarchical assemblies are afforded.
In this report, the synthetic route begins from poly(acrylic acid-b-styrene-D8)
(PAA-b-PS) as the amphiphilic block copolymer precursor to SCK's. PAA58-b-PS135 was prepared by sequential atom transfer radical polymerizations53 of tert-butyl acrylate and styrene-D8, followed by cleavage of the tert-butyl esters using trifluoroacetic acid in dichloromethane. Following purification, the amphiphilic block copolymer was allowed to dissolve in tetrahydrofuran and an equal volume of buffer (5 mM sodium phosphate, 5 mM NaCl, pH 7.4) was added to induce micelle formation. Removal of the organic solvent via dialysis against buffer afforded micelles, which were stabilized by covalently crosslinking nominally 50% of the acrylic acid residues in the shell layer using 2,2′-(ethylenedioxy)-bis(ethylamine) through a coupling reaction with 1-(3′-dimethylaminopropyl)-3-ethylcarbodiimide hydrochloride, and then purified by several cycles (10 × 150 mL) of repeated concentration–diafiltration. Rigorous characterization of the structural and physical properties of the resulting SCK's demonstrated a hydrodynamic diameter of 18 ± 4 nm (dynamic light scattering), zeta potential value of −25 ± 4 mV (electrophoretic light scattering), and a peak average molecular weight of 555 kDa (analytical ultracentrifugation).54
Preparation of the PNA-derivatized SCK's is illustrated in Scheme 1, whereby the four PNA–SCK nanoparticle conjugates were derived from the same parent SCK nanoparticle and designed to include complementary T-rich and A-rich PNA sequences conjugated in few and many copy numbers per particle. The PNAs were synthesized via a solid-state coupling method using standard Fmoc chemistry, utilizing the manufacturer's protocols (Applied Biosystems, Inc., Foster City, CA). Addition of a lysine residue at the carboxy terminus provided a synthetic handle for facile attachment of the PNA to the nanoparticle, once again employing a carbodiimide-mediated coupling facilitated by the presence of 1-[3′-(dimethylamino)propyl]-3-ethylcarbodiimide methiodide (EDC). The number of PNAs attached to the nanoparticles was controlled easily through stoichiometric means by utilizing molar ratios of 5 and 20 PNAs per particle in the presence of a ten-fold excess (vs. PNA) of EDC. The resulting particles were purified via dialysis.
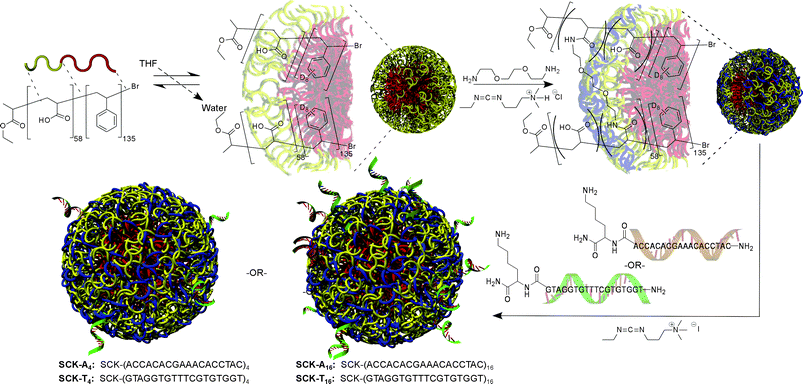 |
| | Scheme 1 Illustration for the production of PNA conjugated SCK nanoparticles. Beginning from a diblock copolymer of polystyrene(D8)-b-poly(acrylic acid), micellization is induced by the addition of water, followed by capture of the nanostructure by crosslinking within the shell layer. Lysine derivatized PNAs are then conjugated to the particle through a carbodiimide coupling reaction with acrylic acids within the shell, with the number of PNAs being on average 4 or 16 per SCK, based upon the stoichiometries used during coupling and confirmed spectroscopically. | |
Quantitative determination of PNA concentration within the solution was obtained from UV-visible spectroscopy. The PNA-conjugated SCK's demonstrated increased absorbances at 260 nm, as compared to the parent particle, indicating that PNA conjugation had successfully occurred (Fig. 1). An average of either 4 or 16 PNAs per particle, were measured from the absorbance values at 260 nm, together with an extinction coefficient of 182![[thin space (1/6-em)]](https://www.rsc.org/images/entities/char_2009.gif) 700 M−1 cm−1,55 for the SCK's having undergone reaction with 5 or 20 equivalents of PNA having T- or A-rich sequences, respectively, corresponding to an 80% coupling efficiency for all reactions. Further characterization of the particles by atomic force microscopy, and dynamic and electrophoretic light scattering, demonstrated little change in size or surface charge density upon PNA conjugation. This is in agreement with the expected minor changes in the overall physical properties of the SCKs, given that only 0.5% and 2.0% of available carboxylate groups in the SCK shell layer were functionalized.
700 M−1 cm−1,55 for the SCK's having undergone reaction with 5 or 20 equivalents of PNA having T- or A-rich sequences, respectively, corresponding to an 80% coupling efficiency for all reactions. Further characterization of the particles by atomic force microscopy, and dynamic and electrophoretic light scattering, demonstrated little change in size or surface charge density upon PNA conjugation. This is in agreement with the expected minor changes in the overall physical properties of the SCKs, given that only 0.5% and 2.0% of available carboxylate groups in the SCK shell layer were functionalized.
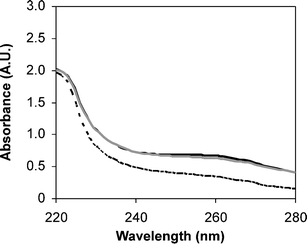 |
| | Fig. 1 UV absorbance scans upon conjugation of PNA to SCK particle demonstrating an increased absorbance for particles SCK-A4
(solid grey line) and SCK-T4
(solid black line), as compared to the parent particle (dashed black line). | |
Supramolecular assembly driven by the base pairing of complementary PNA sequences induced multi-particle aggregates in solution. Solution state assembly of the resultant particles was examined using light scattering at an angle of 90°, which demonstrated that for mixtures of particles with complementary PNAs, (SCK-A4
+ SCK-T4 or SCK-A16
+ SCK-T16) in aqueous solution no aggregation occurred over the course of several days. However, addition of salt to these solutions (100 mM NaCl) induced rapid particulate aggregation as exhibited by an increase in light scattering intensity at 514.5 nm. A control experiment employing either particle SCK-A4 or SCK-A16 at the same salt concentration produced no increased scattering intensity over the same time scale (Fig. 2), indicating that it was the complementary PNA interactions required for the SCK nanoparticle assembly rather than simply the presence of the PNA conjugates.
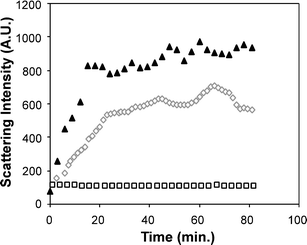 |
| | Fig. 2 A plot of light scattering intensity (514.5 nm)
vs. time for mixtures of particles SCK-A16 and SCK-T16
(solid black triangles) and SCK-A4 and SCK-T4
(open grey diamonds), each at (0.5 mg mL−1) in the presence of 100 mM NaCl, and a mixture of SCK-A16 and SCK-T16 in the absence of salt (open black squares). | |
These results also indicate the importance of salt as a supporting electrolyte on the formation of particle aggregates. While small molecule PNAs have been shown previously to undergo binding in the absence of salt,34 the SCK's are highly negatively charged species, as indicated by their zeta potential values. The apparent lack of interactions for the PNA–SCK nanoparticle conjugates in a salt-free solution is, therefore, most likely a result of electrostatic shielding between the individual particles.52 Because this repulsion can be tuned by the solution electrolyte concentration, it may be possible to alter the rate of particle aggregation, by varying either salt concentrations or surface charge of the particles. This phenomenon is currently under further investigation.
Additional solution characterization of the particles was afforded through examination of the melting transitions of the particle aggregates. Interestingly, comparison of the UV-vis absorbance spectra of a mixture of SCK-T4 and SCK-A4 in 100 mM NaCl at 95 °C with a scan at 25 °C depicted two phenomena: a decreased absorbance at 200 nm at higher temperatures, presumably due to loss of scattering from particle aggregates, and an increased absorbance at 260 nm due to a collapse of the helical PNA structure between particles34
(Fig. 3). UV absorbance measurements at 260 nm were recorded over a range of 25–99 °C at a heating rate of 2 °C min−1, either in the absence of salt, or in the presence of 100 mM NaCl. Non-conjugated PNA in aqueous solution, as a control sample, exhibited a broad transition over this range, consistent with literature values for PNAs of similar length.34 Mixtures of SCK-A4 and SCK-T4 demonstrated a moderately sharp transition beginning at ∼80 °C, in the presence of salt. No melt transition was observed in aqueous solution in the absence of salt, consistent with the data obtained from light scattering measurements, indicating a lack of aggregation. Mixed solutions of SCK-A16 and SCK-T16 demonstrated a sharp transition beginning at ∼90 °C in 100 mM NaCl, and, as before, afforded no transition in a salt-free solution (Fig. 4). A previous study from the groups of Mirkin and Schatz gave similar results with oligonucleotide-labeled gold nanoparticles, for which a sharper melting transition upon conjugation of the DNA to the nanoparticle was observed.56 Additionally, the authors demonstrated that the nanoparticle oligonucleotide melting transitions were dependent upon the number of complementary oligonucleotides on the particle surface, and proposed a thermodynamic model based upon polyvalent interactions as well as local salt concentrations.
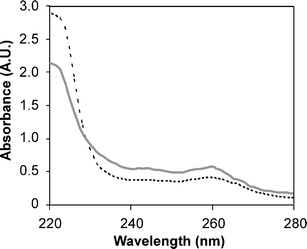 |
| | Fig. 3 UV absorbance scans upon mixtures of SCK-A4 and SCK-T4 at 25 °C (dashed black line) and at 95 °C (solid grey line), demonstrating a loss of scattering at 220 nm and an increase absorbance at 260 nm upon heating. | |
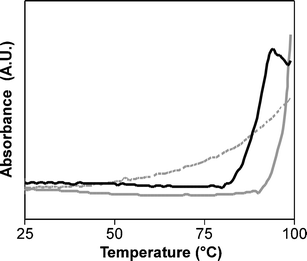 |
| | Fig. 4 UV-vis absorbance (λ260) as a function of temperature to determine the melting behaviors for complementary PNAs (dashed grey line), and for mixtures of particles SCK-A4 and SCK-T4
(solid black line) and SCK-A16 and SCK-T16
(solid grey line) in 100 mM NaCl. | |
Surface assembly of the particles was examined through tapping-mode atomic force microscopy (AFM) under conditions that involved variation in the particle compositions, concentrations and stoichiometries, in an attempt to control feature size and shapes of the particle aggregates. In each case, appropriate volumes of the samples were allowed to mix for 30 seconds prior to deposition of the solution (3 µL) onto the substrate (freshly cleaved mica) and drying under ambient conditions. Mica, due to its wettability, was chosen as the substrate, as it allowed the sample solution to spread over the surface. As was observed for dynamic light scattering and UV melting transitions, it is hypothesized that no aggregation occurred at the concentrations utilized (≤0.5 mg mL−1) in salt-free aqueous solutions, until evaporation occurred, local concentrations of particles increased, and assembly was thereby allowed.49 As observed previously for non-PNA-labeled SCK's of various compositions, a combination of capillary attractive forces and electrostatic repulsive forces strongly influence aggregation and segregation behavior of the nanoparticles upon drying.49,52,57 Thus, although deposition of only particle SCK-A4
(0.1 mg mL−1) from aqueous solution produced particle interactions (Fig. 5A), there is a balance of attractive forces and electrostatic repulsions that retain interparticle spacing.52 However, deposition of a mixture of particles SCK-A4 and SCK-T4 at identical concentrations clearly produces long range aggregations of particles (Fig. 5B). The base pairings that occur for mixtures of nanoparticles having complementary PNA sequences overcome the electrostatic repulsions to allow for the formation of close-packed aggregates as observed by AFM for dried particles upon mica substrates, and was also observed (as noted above) for solution state assemblies.
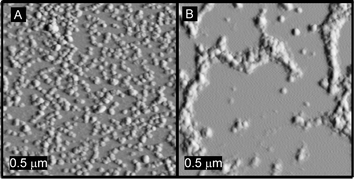 |
| | Fig. 5 Tapping-mode AFM images of (A) SCK-A4 only and (B) a mixture of SCK-A4 and SCK-T4 deposited from aqueous solution (3 µL, 0.2 mg mL−1), upon freshly cleaved mica and allowed to dry under ambient conditions, demonstrating aggregation events due to the complementary PNAs of the particle mixture. | |
As a means of controlling the features of the particles, the effect of concentration on the substrate assembly of the particles was examined, for equimolar amounts of SCK-A4 and SCK-T4 as well as SCK-A16 and SCK-T16 at concentrations of 0.50, 0.25, 0.13 and 0.05 mg mL−1. Similar particle assemblies were observed whether the particles were mixed and subsequently diluted to the lower concentration samples, or whether the solutions were diluted and mixed (images not shown). AFM images of the solutions of mixtures of SCK-A4 and SCK-T4 are shown in Fig. 6. At a concentration of 0.50 mg mL−1
(Fig. 6A), a network of particles was found with continuity existing throughout the area of deposition, most likely representative of a kinetic assembly phenomenon, in which assembly occurred rapidly at a critical solution concentration, and large network formation occurred, preventing the formation of large localized aggregates. Dilution and deposition of this solution (0.25 and 0.13 mg mL−1) resulted in large discontinuities within the network, as larger aggregates appeared (Fig. 6B and C, respectively). Further dilution of this solution (0.05 mg mL−1, Fig. 6D) also produced discrete aggregates, however of smaller size and greater frequency. Examination of the same concentrations for mixtures of particles SCK-A16 and SCK-T16 also revealed smaller aggregate sizes and distributions upon dilution, although clearly the interparticle aggregation was greater than resulted for the mixture of SCK-A4 and SCK-T4
(Fig. 7). Interestingly, mixtures of SCK-A4 and SCK-T4 particles in 100 mM NaCl formed three-dimensional aggregates, even upon high dilution (0.02 mg mL−1), which can be attributed to salt allowing for aggregate formation prior to deposition and drying on the surface (Fig. 8). As a control experiment, solutions of only SCK-T4, lacking the complementary components, failed to undergo aggregation even at high salt concentration.
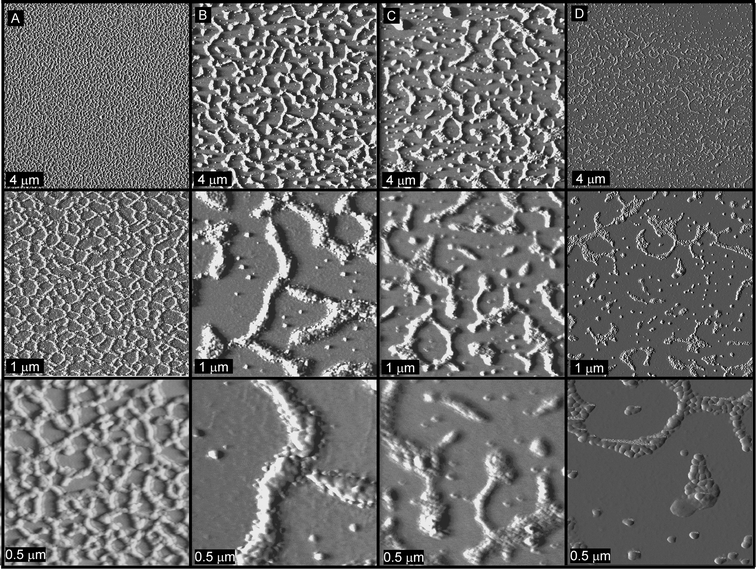 |
| | Fig. 6 Tapping-mode AFM images of mixtures of particles SCK-A4 and SCK-T4 deposited from solutions having concentrations of (A) 0.50 mg mL−1, (B) 0.25 mg mL−1, (C) 0.13 mg mL−1 and (D) 0.05 mg mL−1. | |
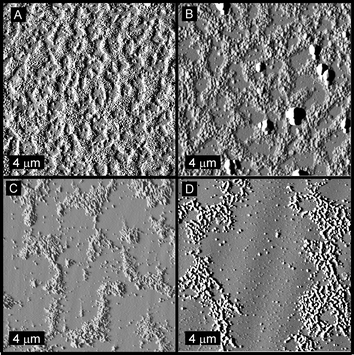 |
| | Fig. 7 Tapping-mode AFM images of mixtures of particles SCK-A16 and SCK-T16 deposited from solutions having concentrations of (A) 0.50 mg mL−1, (B) 0.25 mg mL−1, (C) 0.13 mg mL−1 and (D) 0.05 mg mL−1. | |
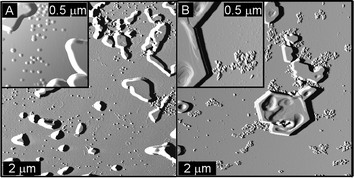 |
| | Fig. 8 Tapping-mode AFM images of (A) SCK-T4 and (B) a mixture of SCK-A4 and SCK-T4 deposited from 100 mM NaCl (0.02 mg mL−1). | |
The assembly process was examined further using mixtures of SCK-A4 and SCK-T16 in an attempt to control the aggregate domain size, based upon stoichiometric balances. Utilizing concentrations of 0.05 mg mL−1, a four-fold excess of SCK-A4
(40 µL) was mixed with SCK-T16
(10 µL) to yield a solution having different particle concentrations, but of approximately equal molarity with respect to PNAs. Uncontrolled growth occurred, as is illustrated by large aggregate formation (Fig. 9A). However, when an equimolar amount of SCK-A16 was mixed with SCK-T4, thus giving a 4 fold excess of the A-rich PNA sequences that are capable of capping the extended aggregate growth, one-dimensional growth predominated with a few small aggregates and a great deal of free individual particles (Fig. 9B). Studies to probe these phenomena, including further variation of the ratios of SCK's and their PNA units, as well as their aggregation behaviors in the presence of DNA and PNA small molecule components, are currently in progress.
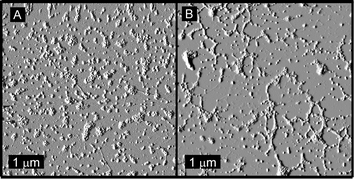 |
| | Fig. 9 Tapping-mode AFM images of (A) four-fold molar excess of SCK-A4 mixed with SCK-T16, giving equimolar PNAs, and (B) equimolar SCK-A16 mixed with SCK-T4, giving a four-fold molar excess of A-rich PNA. | |
Solution state AFM analyses of a mixture of SCK-A16 and SCK-T16, in comparison to a solution of SCK-A16 alone, were undertaken to probe in situ the assembly conditions and behaviors. During these studies, MgCl2 was utilized as a divalent salt to create bridges between the negatively-charged mica substrate and SCK's.49 Incubation of the mica substrate within a 10 mM MgCl2(aq.) solution for 5 minutes was followed by dilution to 5 mM upon introduction of the SCK solution into the fluid cell. At a particle concentration of 0.25 mg mL−1, deposition of particle monolayers occurred within the the time period required for capture of the first image scans (<5 min). The SCK-A16 and SCK-T16 mixture underwent continued surface deposition and adsorbed layer thickening as a function of time, and also reorganized into what appeared to be an aggregation-driven densification within the adsorbed layers to produce pits that grew into crevasses over time (Fig. 10A). This unique behavior is of significant interest, and is undergoing further study. In direct contrast, the solution of SCK-A16 gave only the expected slow deposition of particles with topographic features that remained consistent throughout the experiment (>3 h)
(Fig. 10B), It is also interesting to note that the in situ experimental conditions employed for these studies, including the introduction of MgCl2 and slow deposition, relative to the dry state AFM, altered the resulting particle organization and the final assembly state. Importantly, the assembly process is not promoted by the AFM tip scanning, as expansion to a 10 × 10 µm scan area at a later time point reveals that the surface patterns extend beyond the repeatedly scanned region (Fig. 11).
 |
| | Fig. 10 Solution-state tapping-mode AFM images of (A) a mixture of SCK-A16 with SCK-T16, and (B) SCK-A16. Images were collected in 5 mM MgCl2(aq.) solution. The horizontal axes of the images are 2 µm and the vertical scale bars are 60 nm. | |
 |
| | Fig. 11 Solution-state tapping-mode AFM images of (A) a mixture of SCK-A16 with SCK-T16, and (B) SCK-A16. Images were collected in 5 mM MgCl2(aq.) solution. The horizontal axes of the images are 10 µm and the vertical scale bar denotes 100 nm for image (A) and 50 nm for image (B). | |
Experimental
Materials
Unless otherwise listed, all solvents and reagents were purchased from Aldrich Chemical Co. (St. Louis, MO) and used as received. Monomers were purchased from Aldrich and distilled over calcium hydride.
Measurements
1H NMR (300 MHz) and 13C NMR (75 MHz) spectra were recorded as solutions on a Varian Mercury 300 MHz spectrometer with the solvent signal as standard. IR spectra were obtained on a Perkin-Elmer Spectrum BX FT-IR system using diffuse reflectance sampling accessories. Mass Spectra were obtained from a Voyager DE-RP MALDI-TOF Mass Spectrometer (PE Biosystem).
Size exclusion chromatography (SEC) was conducted on a Model 150-CV (Waters Chromatography Inc., Medford, MA), equipped with a Model 410 differential refractometer, a Model PD2040 dual-angle (15° and 90°) light scattering detector (Precision Detectors Inc., Bellingham, MA), and a three-column set of gel mixed-bed styrene–divinylbenzene columns (Polymer Laboratories Inc., Amherst, MA). The system was equilibrated at 35 °C in anhydrous THF, which served as the polymer solvent and eluent (flow rate set to 1.00 mL min−1 then determined gravimetrically). An injection volume of 400 µL was used and the polymer concentrations ranged from 5 to 10 mg mL−1. Data collection was performed with program Precision Acquire (Precision Detectors Inc., Bellingham, MA). Data analysis was performed with program Discovery32 (Precision Detectors Inc., Bellingham, MA). Inter detector delay volume and the light scattering detector calibration constant were determined from a nearly monodisperse polystyrene calibrant (Mp
= 90![[thin space (1/6-em)]](https://www.rsc.org/images/entities/char_2009.gif) 000 g mol−1, Mw/Mn < 1.04; Pressure Chemical Co., Pittsburgh, PA). The differential refractometer was calibrated with standard polystyrene reference material (SRM 706; NIST, Gaithersburg, MD), of known specific refractive index increment, dn/dc
(0.184 mL g−1). The dn/dc of the analyzed polymers was then determined from the differential refractometer response.
Glass transition temperatures (Tg) were measured by differential scanning calorimetry on a Perkin-Elmer DSC-4 differential scanning calorimeter. Heating rates were 10 °C min−1 and Tg's were taken at the midpoint of the inflection tangent, upon the third heating scan.
000 g mol−1, Mw/Mn < 1.04; Pressure Chemical Co., Pittsburgh, PA). The differential refractometer was calibrated with standard polystyrene reference material (SRM 706; NIST, Gaithersburg, MD), of known specific refractive index increment, dn/dc
(0.184 mL g−1). The dn/dc of the analyzed polymers was then determined from the differential refractometer response.
Glass transition temperatures (Tg) were measured by differential scanning calorimetry on a Perkin-Elmer DSC-4 differential scanning calorimeter. Heating rates were 10 °C min−1 and Tg's were taken at the midpoint of the inflection tangent, upon the third heating scan.
Sedimentation equilibrium (SE)
A Beckman Instruments Co. Model Optima XL-I analytical ultracentrifuge operated with a Model An60-Ti, four-hole rotor was used to centrifuge 50 mM NaH2PO4, 50 mM NaCl, (PBS) pH 7.4 solutions of the SCK to sedimentation equilibrium. All measurements were made at 20 ± 0.1 °C. Rotor speeds of 2000, 3000 and 5000 rpm were used. Sedimentation equilibrium data were obtained for three SCK solution concentrations. Resulting sedimentation equilibrium profiles were recorded with the instrument's Rayleigh interferometric (refractive index) detection optics. The ultracentrifuge sample cell was assembled from an Epon charcoal filled, six channel centerpiece and matched sapphire windows. The solution volume and the cell's optical path length were 110 µL and 12 mm, respectively. The solution volume and optical path length employed corresponded to a “short” column sedimentation equilibrium experiment with a column height of approximately 2.5 mm. A centrifugation time of 3 to 5 days was used to reach sedimentation equilibrium. Partial specific volume (ν) for SCKs was determined via sedimentation equilibrium analysis for protonated and deuterated buffer solutions of SCKs as described previously.58 Solutions of the SCK in deuterated buffer were prepared by exhaustive dialysis of protonated buffer stock solutions of SCKs against 50 mM PBS, pD 7.1 in 99.9 atom% D2O. Calculation of molecular weight employed a built in data analysis program that employed standard multi-component least squares fitting routines. Density at 20.0 ± 0.1 °C for protonated and deuterated buffers was determined with a Mettler-Parr digital density meter. Measurements of ν were reproducible to within ±1% of the mean value given by three determinations.
Sedimentation velocity (SV)
Identical experimental parameters were followed with the following exceptions. A rotor speed of 25![[thin space (1/6-em)]](https://www.rsc.org/images/entities/char_2009.gif) 000 rpm was used. Sedimentation velocity data were obtained for four SCK solution concentrations. Resulting sedimentation velocity profiles were recorded with the instrument's Rayleigh interferometric detection optics. The ultracentrifuge sample cell was assembled from an Epon charcoal-filled, two channel centerpiece and matched sapphire windows. The solution volume and the cell's optical path length were 400 µL and 12 mm, respectively. The sedimentation time-derivative determined ∂c/∂t at every radius, r by pair-wise subtraction of the sedimentation velocity profiles at different times, t. The radius, r was then transformed to s* using:
000 rpm was used. Sedimentation velocity data were obtained for four SCK solution concentrations. Resulting sedimentation velocity profiles were recorded with the instrument's Rayleigh interferometric detection optics. The ultracentrifuge sample cell was assembled from an Epon charcoal-filled, two channel centerpiece and matched sapphire windows. The solution volume and the cell's optical path length were 400 µL and 12 mm, respectively. The sedimentation time-derivative determined ∂c/∂t at every radius, r by pair-wise subtraction of the sedimentation velocity profiles at different times, t. The radius, r was then transformed to s* using:
The ∂c/∂t are averaged at each s* to give g(s*) which represented the mass-weighted distribution of sedimentation coefficients. s* was corrected to its standard value at 20 °C in water using the following formula:
| | | s20,w
=
s*
(ηb/ηw)
[(1 −
ρν)w/(1 −
ρν)b] | (2) |
where,
ν and
ρ in the term, (1 −
ρν)w, correspond to the partial specific volume and the density of water at 20 °C, respectively. The value of
s0 was determined by plotting
s20,wversus concentration and extrapolating to zero concentration. By placing the calculated values of
d0, from
DLS, and
s0 into the Svedberg equation shown below, the peak molecular weight,
Mp, was calculated.
Where, R is the gas constant, T is the absolute temperature, ν is the partial specific volume of the SCK, d0 is the standardized diffusion coefficient, d20,w, extrapolated to zero concentration, and ρ is the density of the buffer. The anhydrous sphere diameter, D0, of the SCK was then estimated using:
Using D0, and the corrected buffer viscosity, ηb, the frictional coefficient of the anhydrous sphere, f0, was determined by:
The standardized frictional coefficient of the solvated particle, f20,w, was calculated using the peak molecular weight, Mp, and the standardized sedimentation coefficient s20,w.
| | | f20,w
=
Mp(1−ρν)/s20,wN0 | (6) |
Using the ratio of the standardized frictional coefficient to the value calculated for the anhydrous sphere using the following formula, the maximum degree of hydration, δm, was determined.
| | | δm
=
{[(f20,w/f0)3−1]ν}/0.998234 | (7) |
Dynamic light scattering (DLS)
Hydrodynamic diameter distribution and distribution averages for the SCKs in PBS solution were determined by dynamic light scattering. A Brookhaven Instruments Co. (Holtsville, NY) Model SM 200 DLS system equipped with a Model BI-9000AT digital correlator, a Model EMI-9865 photomultiplier, and a Model 95-2 Ar ion laser (Lexel Corporation, Fremont, CA), operated at 514.5 nm, was used. Measurements were made at 20 ± 0.1 °C. Nanoparticles were dialyzed into 50 mM PBS, pH 7.1 prior to analysis. Buffered nanoparticle solutions were either centrifuged in a model 5414 microfuge (Brinkman Instrument Company, Westbury, NY) for 4 min or filtered through 0.22 µm poly(vinylidene fluoride) and 0.1 µm ceramic filters (Whatman, Maidstone, UK) to remove dust particles. Scattered light was collected at a fixed angle of 90°. The digital correlator was operated with 522 ratio spaced channels, an initial delay of 1.6 µs, a final delay of 10 ms, and a duration time of fifteen minutes. A photomultiplier aperture of 400 µm was used, and the incident laser power was adjusted to obtain a photon counting rate between 200 and 300 Kcps. Only measurements for which the measured and calculated baselines of the intensity autocorrelation function agreed to within ±0.1% were used to calculate nanoparticle hydrodynamic diameter values. All determinations were made in triplicate. The calculations of the nanoparticle diameter distributions and distribution averages were performed with the ISDA software package (Brookhaven Instruments Co.), which employed single-exponential fitting, cumulants analysis, and non-negatively constrained least-squares particle size distribution analysis routines. The diffusion coefficient, d, was corrected to standard conditions, d20,w, using the following equation:where, ηw is the absolute viscosity of water at 20 °C (1.002 cp) and ηb is the absolute viscosity of the buffer at 20 °C calculated from viscosity increments. The value of d0 is determined by plotting d20,wversus concentration and extrapolating to zero concentration.
Transmission electron microscopy carbon grids were prepared by oxygen plasma treatment to make the surface hydrophilic. Particle samples were diluted 9 ∶ 1 in water and further diluted 1 ∶ 1 with a 1% phosphotungstinic acid (PTA) stain. Micrographs were collected at 100![[thin space (1/6-em)]](https://www.rsc.org/images/entities/char_2009.gif) 000 magnification and calibrated using a 41 nm polyacrylamide bead from NIST. Histograms of particle diameters were generated from the analyses of a minimum of 150 particles from at least three different micrographs.
Tapping-mode AFM measurements were conducted on dried samples in air with a Nanoscope III BioScope system (Digital Instruments, Santa Barbara, CA) operated under ambient conditions with standard silicon tips (OTESPA-70; L, 160 µm; normal spring constant, 50 N/m; resonance frequency, 246–282 kHz). The samples were prepared for AFM analysis by depositing a 2-µL drop of the solution onto freshly-cleaved mica and allowing it to dry freely in air. Histograms of particle heights were generated from the section analysis of a minimum of 150 particles from at least five different analyses regions. Solution-state AFM images were collected in aqueous 5 mM MgCl2 solution with a Nanocope III Multimode system (Digital Instruments, Santa Barbara, CA) operated with 100 µm, wide legged, silicon nitride cantilevers at a resonance frequency of ∼8 Hz. Images were acquired within a fluid cell provided by the manufacturer using a freshly cleaved mica substrate. An O-ring was utilized around the fluid cell to minimize loss of sample through spreading or evaporation.
000 magnification and calibrated using a 41 nm polyacrylamide bead from NIST. Histograms of particle diameters were generated from the analyses of a minimum of 150 particles from at least three different micrographs.
Tapping-mode AFM measurements were conducted on dried samples in air with a Nanoscope III BioScope system (Digital Instruments, Santa Barbara, CA) operated under ambient conditions with standard silicon tips (OTESPA-70; L, 160 µm; normal spring constant, 50 N/m; resonance frequency, 246–282 kHz). The samples were prepared for AFM analysis by depositing a 2-µL drop of the solution onto freshly-cleaved mica and allowing it to dry freely in air. Histograms of particle heights were generated from the section analysis of a minimum of 150 particles from at least five different analyses regions. Solution-state AFM images were collected in aqueous 5 mM MgCl2 solution with a Nanocope III Multimode system (Digital Instruments, Santa Barbara, CA) operated with 100 µm, wide legged, silicon nitride cantilevers at a resonance frequency of ∼8 Hz. Images were acquired within a fluid cell provided by the manufacturer using a freshly cleaved mica substrate. An O-ring was utilized around the fluid cell to minimize loss of sample through spreading or evaporation.
Zeta potential measurements
Zeta potential (ζ) values for the SCKs were determined with a Brookhaven Instrument Co. (Holtsville, NY) Model Zeta Plus zeta potential analyzer. Measurements were recorded at 25 °C in 10 mM phosphate buffered saline (pH = 7.1), utilizing the phase analysis light scattering (PALS) mode.
Poly(tert-butyl acrylate) macroinitiator (1)
A 100 mL Schlenk flask that had been oven dried overnight, flame dried under vacuum, and back filled with argon was charged with copper(I) bromide (891.6 mg, 6.2 × 10⁻³ mol). tert-Butyl acrylate (38.00 mL, 2.6 × 10⁻¹ mol), PMDETA (1.30 mL, 6.2 × 10⁻³ mol), and ethyl-2-bromopropionate (403 µL, 3.1 × 10⁻³ mol), were added via argon washed syringes. The solution was degassed by three cycles of freeze–pump–thaw, and following the final thaw cycle the mixture was allowed to stir for 10 min before being immersed in an oil bath at 50 °C. After 80 min, the polymerization was quenched by immersion in liquid nitrogen. The reaction mixture was dissolved in THF, and passed through an alumina plug to remove the metal–ligand catalyst system. The polymer solution was concentrated and then precipitated into cold methanol. Mn
= 7400 from SEC, based on multi-angle light scattering (MALS). Mw/Mn
= 1.12. The isolated yield was 28.83 g (85%). (Tg)tBA
= 33 °C. IR: 3440, 2980, 1750, 1450, 1380, 1265, 1150, 850, 760, 625 cm−1. 1H NMR (CDCl3)
δ 1.05 (d, CH3CH end group), 1.22 (t, CH3CH2O end group), 1.20–1.50 (br, (CH3)3C), 1.24–1.70 (br, meso and racemo CH2 of the polymer backbone), 1.74–1.94 (br, meso CH2 of the polymer backbone), 2.15–2.35 (br, CH of the polymer backbone), 4.05 (br overlapping m, CH3CH2O and CHBr end groups) ppm. 13C NMR (CDCl3)
δ 27.9–28, 35.5–37.4, 41.5–41.4, 80.3, 173.6, 173.9 ppm.
Poly(tert-butyl acrylate-b-styrene-d8) (2)
A 100 mL Schlenk flask that had been oven dried overnight, flame dried under vacuum, and back filled with argon was charged with copper(I) bromide (45.8 mg, 3.2 × 10⁻⁴ mol) and poly(tert-butyl acrylate) 1
(0.7234 g, 9.77 × 10⁻⁵ mol). PMDETA (66.5 µL, 3.2 × 10⁻⁴ mol), and styrene-d8
(3.000 mL, 2.62 × 10⁻³ mol), were added via argon washed syringes. The solution was degassed by three cycles of freeze–pump–thaw, and following the final thaw cycle the mixture was allowed to stir for 10 min before being immersed in an oil bath at 75 °C. After 150 min, the oil bath was removed and the reaction vessel was immersed in liquid nitrogen to quench the polymerization reaction. The reaction mixture was dissolved in THF, and passed through an alumina plug to remove the metal–ligand catalyst system. The polymer solution was concentrated and then precipitated into a cold methanol–water solution. Mn
= 22![[thin space (1/6-em)]](https://www.rsc.org/images/entities/char_2009.gif) 500 from SEC, based on MALS. Mw/Mn
= 1.06. The isolated yield was 2.0714 g (44%). (Tg)PtBA
= 32 °C. (Tg)PS
= 102 °C. IR: 3647, 3590, 3435, 3020, 2900, 1945, 1725, 1600, 1488, 1450, 1250, 1150, 841, 755, 700, 542 cm−1. 1H NMR (CDCl3)
δ 1.20–1.50 (br, (CH3)3C), 1.24–1.70 (br, meso and racemo CH2 of the polymer backbone), 1.74–1.94 (br, meso CH2 of the polymer backbone), 2.15–2.35 (br, CH of the polymer backbone) ppm. 13C NMR (CDCl3)
δ 27.9–28, 35.5–37.4, 41.5–41.4, 80.3, 108.1, 124.8–129.5, 173.5 ppm.
500 from SEC, based on MALS. Mw/Mn
= 1.06. The isolated yield was 2.0714 g (44%). (Tg)PtBA
= 32 °C. (Tg)PS
= 102 °C. IR: 3647, 3590, 3435, 3020, 2900, 1945, 1725, 1600, 1488, 1450, 1250, 1150, 841, 755, 700, 542 cm−1. 1H NMR (CDCl3)
δ 1.20–1.50 (br, (CH3)3C), 1.24–1.70 (br, meso and racemo CH2 of the polymer backbone), 1.74–1.94 (br, meso CH2 of the polymer backbone), 2.15–2.35 (br, CH of the polymer backbone) ppm. 13C NMR (CDCl3)
δ 27.9–28, 35.5–37.4, 41.5–41.4, 80.3, 108.1, 124.8–129.5, 173.5 ppm.
Poly(acrylic acid-b-styrene-d8) (3)
The poly(tert-butyl acrylate) block of 2 was cleaved by adding 50.00 mL of trifluoroacetic acid to 1.0624 g (4.72 × 10⁻⁵ mol) of the diblock 2 in 150 mL of dichloromethane. After 36 hours, the solvent was evaporated in vacuo, the residue was dissolved in THF and purified by dialysis in presoaked dialysis tubing (MWCO 12–14 k) against nanopure water for 3 days. Lyophilization yielded pure poly(acrylic acid-b-styrene-d8) as a white powder. Yield: 0.8956 g (98%). (Tg)PAA
= 141 °C. (Tg)PS
= 103 °C. IR: 3400, 3010, 2910, 1944, 1800, 1724, 1600, 1490, 1350, 1150, 755, 695, 542 cm−1. 1H NMR (THF-d8)
δ 1.22–1.75 (br, meso and racemo CH2 of the polymer backbone), 1.74–1.94 (br, meso CH2 of the polymer backbone), 2.15–2.35 (br, CH of the polymer backbone) ppm. 13C NMR (THF-d8)
δ 35.5–37.4, 41.5–41.4, 108.1, 124.8–129.5, 173.5 ppm.
Micelle formation
Spherical micelles of narrow size distribution were obtained by dissolving the purified amphiphilic block copolymer 3
(0.5186 g, 2.30 × 10⁻⁵ mol) in 250.00 mL of THF (2.07 mg mL−1) followed by gradual addition (15.00 mL h−1) of an equal volume 5 mM sodium phosphate, 5 mM sodium chloride, pH 7.4 buffer to induce micellization. The micelles were allowed to stir for 12 h before being transferred to a dialysis and concentration cell (MWCO 10 k) and dialyzed with 3.0 L of buffer. The final volume was 650 mL of buffered micelle solution for a final concentration of 0.80 mg mL−1.
Shell crosslinked (SCK) nanoparticle formation
2,2′-(Ethylenedioxy)-bis(ethylamine)
(67 µL, 4.6 × 10⁻⁴ mol) was added to 0.500 L of micelle solution (0.80 mg mL−1) of poly(acrylic acid-b-styrene-d8). After 30 min, an aqueous solution (100 mg mL−1) of 1-(3′-dimethylaminopropyl)-3-ethylcarbodiimide hydrochloride (1.040 g, 5.46 × 10⁻³ mol) was added to the reaction vessel. The reaction mixture was allowed to stir for 24 h, and the SCK nanoparticle solution was concentrated to 200 mL in a concentration cell and washed with 3.0 L of nanopure water to remove the reaction byproducts. (Tg)PS
= 101 °C. IR: 3283, 3070, 2935, 2868, 2269, 2190, 1729, 1692, 1653, 1555, 1452, 1390, 1133, 1096, 839, 822, 551 cm−1. Dh
= 18 ± 4 nm (DLS), ζ
=
−25 ± 4 mV, Havg.
= 9.3 ± 3.6 nm (AFM), Davg.
= 53 ± 17 nm (AFM). Additional data can be found in the ESI.†
PNA–lysine conjugates were synthesized (2 µmol) on an ABI 8909 automated DNA/PNA synthesizer using Fmoc chemistry. The hybrid PNA-peptides were purified by reverse phase chromatography on a Microsorb-MV 300-5 C-18 column (250 × 4.6 mm column, 300 A pore size, Varian Inc.) with a 0–5% B/5 min, 5–60% B/30 min, 60–95% B/5 min, 95% B/5 min, 95%–0%/10 min, where A = 0.1% TFA in water and B = 0.08% TFA in CH3CN. The fractions containing the products were evaporated to dryness in a Savant Speedvac, and redissolved in pure water. MS (MALDI): A-rich sequence: 5131.92 (calculated) 5133.74 (observed, M + 2); T-rich sequence: 4918.78 (calculated), 4916.81 (observed, M + 2).
PNA–lysine conjugation to SCK nanoparticle (SCK-A4 and SCK-T4)
PNA–lysine conjugates in water (0.013 µmol, determined spectrophotometrically) were added to a solution of SCK nanoparticles (2.6 mL, 0.53 mg mL−1, 0.95 µmol acid residues) and allowed to stir for 30 minutes prior to the addition of 1-[3′-(dimethylamino)propyl]-3-ethylcarbodiimide methiodide (37.4 µg, 0.13 µmol) from aqueous solution (37 µL). The resulting solution was allowed to stir for 16 h, transferred to dialysis cups (10 kDa MWCO) and dialyzed for 5 days against nanopure (18 MΩ cm) water. SCK-A4: Dh
= 20 ± 1 nm (DLS), ζ
=
−25 ± 6 mV, Havg.
= 8.3 ± 2.3 nm (AFM), Davg.
= 62 ± 23 nm (AFM); SCK-T4: Dh
= 20 ± 4 nm (DLS), ζ
=
−22 ± 7 mV, Havg.
= 10.7 ± 3.1 nm (AFM), Davg.
= 53 ± 17 nm (AFM).
PNA–lysine conjugation to SCK nanoparticle (SCK-A16 and SCK-T16)
PNA–lysine conjugates in water (0.19 µmol, determined spectrophotometrically) were added to a solution of SCK nanoparticles (10 mL, 0.53 mg mL−1, 7.3 µmol acid residues) and allowed to stir for 30 min prior to the addition of 1-[3-(dimethylamino)propyl]-3-ethylcarbodiimide methiodide (560 µg, 1.9 µmol) dropwise from aqueous solution (0.56 mL). The resulting solution was allowed to stir for 16 h, transferred to dialysis tubing (10 kDa MWCO) and dialyzed for 5 days against nanopure (18 MΩ cm) water. SCK-A16: Dh
= 19 ± 3 nm (DLS), ζ
=
−18 ± 7 mV, Havg.
= 10.5 ± 1.3 nm (AFM), Davg.
= 47 ± 18 nm (AFM); SCK-T16: Dh
= 21 ± 4 nm (DLS), ζ
=
−19 ± 5 mV, Havg.
= 7.3 ± 4.1 nm (AFM), Davg.
= 60 ± 13 nm (AFM).
Conclusions
PNA-functionalized SCK's have been demonstrated as building blocks for controlled assembly. The production of the SCK nanoparticle is facile, and the shell chemistry affords control over the number and type of PNA sequences that are attached to the particle through stoichiometric means. As a result, particle populations possessing different numbers of complementary PNA moieties can be utilized to effectively control the assembly process, and subsequently allow for tuning of domain and feature sizes of the particles. When used in combination with SCK's containing mixtures of PNAs of differing sequences, the assembly process is expected to be further tunable. Additionally, the use of soft materials, that retain chemical functionality allows for further chemical modification following network or aggregate formation. Studies utilizing these concepts, including covalent interparticle crosslinking and/or the attachment of additional ligands are in progress.
Acknowledgements
The authors thank Dr Edward E. Remsen for valuable assistance with analytical ultracentrifugation. This project has been funded in part with federal funds from the National Cancer Institute, National Institutes of Health, under contract no. N01-CO-27103, by a NIH Chemistry–Biology Interface Pathway Training Grant Fellowship for J.L.T. and M.L.B. (5T32GM08785-03) and by the National Science Foundation under grant number 0210247.
References
- Y. Xia, J. A. Rogers, K. E. Paul and G. M. Whitesides, Chem. Rev., 1999, 99, 1823 CrossRef CAS.
- B. D. Gates, Q. Xu, J. C. Love, D. B. Wolfe and G. M. Whitesides, Ann. Rev. Mater. Res., 2004, 34, 339 Search PubMed.
- M. Geissler and Y. Xia, Adv. Mater., 2004, 16, 1249 CrossRef CAS.
- M. Lazzari and M. A. Lopez-Quintela, Adv. Mater., 2003, 15, 1583 CrossRef CAS.
- R. Shenhar and V. M. Rotello, Acc. Chem. Res., 2003, 36, 549 CrossRef CAS.
- J. A. A. W. Elamans, A. E. Rowan and R. J. M. Nolte, J. Mater. Chem., 2003, 13, 2661 RSC.
- A. H. Flood, R. J. A. Ramirez, W.-Q. Deng, R. P. Muller, W. A. G. III and J. F. Stoddart, Aust. J. Chem, 2004, 57, 301 CrossRef CAS.
- D. G. Shchukin and G. B. Sukhorukov, Adv. Mater., 2004, 16, 671 CrossRef CAS.
- C. Park, J. Yoon and E. L. Thomas, Poly., 2003, 44, 6725 Search PubMed.
- B. L. Cushing, V. L. Kolesnichenko and C. J. O'Connor, Chem. Rev., 2004, 104, 3893 CrossRef CAS.
- M.-C. Daniel and A. Didier, Chem. Rev., 2004, 104, 293 CrossRef CAS.
- C. N. R. Rao and A. K. Cheetham, J. Mater. Chem., 2001, 11, 2887 RSC.
- A. Carrillo and R. S. Kane, J. Polym. Sci., Part A: Polym. Chem., 2004, 42, 3352 CrossRef CAS.
- H. Huang, T. Kowalewski and K. L. Wooley, J. Polym. Sci., Part A: Polym. Chem., 2003, 41, 1659 CrossRef CAS.
- D. S. Ginger, H. Zhang and C. A. Mirkin, Angew. Chem., Int. Ed., 2004, 43, 30 CrossRef.
- S. Hecht, Angew. Chem., Int. Ed., 2003, 42, 24 CrossRef CAS.
- M. A. Burns, Science, 2002, 296, 1818 CrossRef CAS.
- S. Kramer, R. R. Fuierer and C. B. Gorman, Chem. Rev., 2003, 103, 4367 CrossRef.
- Y. Xia, Y. Yin, Y. Lu and J. McLellan, Adv. Funct. Mater., 2003, 12, 907 CrossRef CAS.
- K. Velonia, A. E. Rowan and R. J. M. Nolte, J. Am. Chem. Soc., 2002, 124, 4224 CrossRef CAS.
- J. J. L. M. Cornelissen, M. Fischer, R. van Waes, R. van Heerbeek, P. C. J. Kamer, J. N. H. Reek, N. A. J. M. Sommerdijk and R. J. M. Nolte, Polymer, 2004, 45, 7417 CAS.
- P. Samorì, J. J. J. M. Donners, N. Severin, M. B. J. Otten, J. P. Rabe, R. J. M. Nolte and N. A. J. M. Sommerdijk, Langmuir, 2004, 20.
- A. P. Alivisatos, K. P. Johnsson, X. Peng, T. E. Wilson, C. J. Loweth, M. P. Bruchez, Jr. and P. G. Schultz, Nature, 1996, 382.
- C. A. Mirkin, R. L. Letsinger, R. C. Mucic and J. J. Storhoff, Nature, 1996, 382, 607 CrossRef CAS.
- J. Liu and Y. Lu, J. Fluorescence, 2004, 14, 343 CrossRef CAS.
- S. Cobbe, S. Connolly, D. Ryan, L. Nagle, R. Eritja and D. Fitzmaurice, J. Phys. Chem. B, 2003, 107, 470 CrossRef CAS.
- Z. Li, S. w. Chung, J.-M. Nam, D. S. Ginger and C. A. Mirkin, Angew. Chem., Int. Ed., 2003, 42, 2306 CrossRef CAS.
- S.-J. Park, A. A. Lazarides, C. A. Mirkin and R. L. Letsinger, Angew. Chem., Int. Ed., 2001, 40, 2909 CrossRef CAS.
- J. J. Storhoff and C. A. Mirkin, Chem. Rev., 1999, 99, 1849 CrossRef CAS.
- R. Chakrabarti and A. M. Klibanov, J. Am. Chem. Soc., 2003, 125, 12531 CrossRef CAS.
- D. Murphy, G. Redmond, B. G. d. l. Torre and R. Eritja, Helv. Chim. Acta, 2004, 87, 2727 CrossRef.
- P. E. Nielsen, M. Egholm, R. H. Berg and O. Buchardt, Science, 1991, 254, 1497 CrossRef CAS.
- B. A. Armitage, Drug Discovery Today, 2003, 8, 222 CrossRef CAS.
- S. Tomac, M. Sarkar, T. Ratilainen, P. Wittung, P. E. Nielsen, B. Nordén and A. Gräslund, J. Am. Chem. Soc., 1996, 118, 5544 CrossRef CAS.
- T. Ratilainen, A. Holmén, E. Tuite, P. E. Nielsen and B. Nordén, Biochemistry, 2000, 19, 7781 CrossRef CAS.
- C. R. Demattei, B. Huang and D. A. Tomalia, Nano Lett., 2004, 4.
- E. Strable, J. E. Johnson and M. G. Finn, Nano Lett., 2004, 4, 1385 CrossRef CAS.
- K. S. Murthy, Q. Ma, E. E. Remsen, T. Kowalewski and K. L. Wooley, J. Mater. Chem., 2003, 13, 2785 RSC.
- J. L. Turner and K. L. Wooley, Nano Lett., 2004, 4, 683 CrossRef CAS.
- V. Bütün, A. B. Lowe, N. C. Billingham and S. P. Armes, J. Am. Chem. Soc., 1999, 121, 4288 CrossRef.
- F. Henselwood and G. Liu, Macromolecules, 1997, 30, 488 CrossRef CAS.
- V. Bütün, N. C. Billingham and S. P. Armes, J. Am. Chem. Soc., 1998, 120, 12135 CrossRef.
- K. B. Thurmond, II, T. Kowalewski and K. L. Wooley, J. Am. Chem. Soc., 1996, 118, 7239 CrossRef.
- S. Liu, J. V. M. Weaver, M. Save and S. P. Armes, Langmuir, 2002, 18, 8350 CrossRef CAS.
- E. E. Remsen, K. B. Thurmond, II and K. L. Wooley, Macromolecules, 1999, 32, 3685 CrossRef CAS.
- Q. Zhang, E. E. Remsen and K. L. Wooley, J. Am. Chem. Soc., 2000, 122, 3642 CrossRef CAS.
- D. Pan, J. L. Turner and K. L. Wooley, Chem. Commun., 2003, 2400 RSC.
- H. Huang, E. E. Remsen, T. Kowalewski and K. L. Wooley, J. Am. Chem. Soc., 1999, 121, 3805 CrossRef.
- Q. Ma, E. E. Remsen, T. Kowalewski, J. Schaefer and K. L. Wooley, Nano Lett., 2001, 1, 651 CrossRef CAS.
- F. Henselwood and G. Liu, Macromolecules, 1997, 30, 488 CrossRef CAS.
- M. L. Becker, E. E. Remsen, D. Pan and K. L. Wooley, Bioconjugate Chem., 2004, 15, 699 CrossRef CAS.
- Q. Ma, E. E. Remsen, T. Kowalewski and K. L. Wooley, J. Am. Chem. Soc., 2001, 123, 4627 CrossRef CAS.
- K. Matyjaszewski and J. Xia, Chem. Rev., 2001, 109, 2921 CrossRef CAS.
- Full material synthesis and purification protocols, as well as characterization data are provided in the ESI.
- S. A. Kushon, J. P. Jordan, J. L. Seifert, H. Nielsen, P. E. Nielsen and B. A. Armitage, J. Am. Chem. Soc., 2001, 123, 10805 CrossRef CAS.
- R. Jin, G. Wu, Z. Li, C. A. Mirkin and G. C. Schatz, J. Am. Chem. Soc., 2003, 125, 1643 CrossRef CAS.
- M. L. Becker, E. E. Remsen and K. L. Wooley, J. Polym. Sci., Part A: Polym. Chem., 2001, 39, 4152 CrossRef CAS.
- K. S. Murthy, Q. Ma, C. G. Clark, Jr., E. E. Remsen and K. L. Wooley, Chem. Commun., 2001, 773 RSC.
|
| This journal is © The Royal Society of Chemistry 2005 |
Click here to see how this site uses Cookies. View our privacy policy here. 
![[thin space (1/6-em)]](https://www.rsc.org/images/entities/char_2009.gif) 700 M−1 cm−1,55 for the SCK's having undergone reaction with 5 or 20 equivalents of PNA having T- or A-rich sequences, respectively, corresponding to an 80% coupling efficiency for all reactions. Further characterization of the particles by atomic force microscopy, and dynamic and electrophoretic light scattering, demonstrated little change in size or surface charge density upon PNA conjugation. This is in agreement with the expected minor changes in the overall physical properties of the SCKs, given that only 0.5% and 2.0% of available carboxylate groups in the SCK shell layer were functionalized.
700 M−1 cm−1,55 for the SCK's having undergone reaction with 5 or 20 equivalents of PNA having T- or A-rich sequences, respectively, corresponding to an 80% coupling efficiency for all reactions. Further characterization of the particles by atomic force microscopy, and dynamic and electrophoretic light scattering, demonstrated little change in size or surface charge density upon PNA conjugation. This is in agreement with the expected minor changes in the overall physical properties of the SCKs, given that only 0.5% and 2.0% of available carboxylate groups in the SCK shell layer were functionalized.


![[thin space (1/6-em)]](https://www.rsc.org/images/entities/char_2009.gif) 000 g mol−1, Mw/Mn < 1.04; Pressure Chemical Co., Pittsburgh, PA). The differential refractometer was calibrated with standard polystyrene reference material (SRM 706; NIST, Gaithersburg, MD), of known specific refractive index increment, dn/dc
(0.184 mL g−1). The dn/dc of the analyzed polymers was then determined from the differential refractometer response.
000 g mol−1, Mw/Mn < 1.04; Pressure Chemical Co., Pittsburgh, PA). The differential refractometer was calibrated with standard polystyrene reference material (SRM 706; NIST, Gaithersburg, MD), of known specific refractive index increment, dn/dc
(0.184 mL g−1). The dn/dc of the analyzed polymers was then determined from the differential refractometer response.
![[thin space (1/6-em)]](https://www.rsc.org/images/entities/char_2009.gif) 000 rpm was used. Sedimentation velocity data were obtained for four SCK solution concentrations. Resulting sedimentation velocity profiles were recorded with the instrument's Rayleigh interferometric detection optics. The ultracentrifuge sample cell was assembled from an Epon charcoal-filled, two channel centerpiece and matched sapphire windows. The solution volume and the cell's optical path length were 400 µL and 12 mm, respectively. The sedimentation time-derivative determined ∂c/∂t at every radius, r by pair-wise subtraction of the sedimentation velocity profiles at different times, t. The radius, r was then transformed to s* using:
000 rpm was used. Sedimentation velocity data were obtained for four SCK solution concentrations. Resulting sedimentation velocity profiles were recorded with the instrument's Rayleigh interferometric detection optics. The ultracentrifuge sample cell was assembled from an Epon charcoal-filled, two channel centerpiece and matched sapphire windows. The solution volume and the cell's optical path length were 400 µL and 12 mm, respectively. The sedimentation time-derivative determined ∂c/∂t at every radius, r by pair-wise subtraction of the sedimentation velocity profiles at different times, t. The radius, r was then transformed to s* using:![[thin space (1/6-em)]](https://www.rsc.org/images/entities/char_2009.gif) 000 magnification and calibrated using a 41 nm polyacrylamide bead from NIST. Histograms of particle diameters were generated from the analyses of a minimum of 150 particles from at least three different micrographs.
000 magnification and calibrated using a 41 nm polyacrylamide bead from NIST. Histograms of particle diameters were generated from the analyses of a minimum of 150 particles from at least three different micrographs.
![[thin space (1/6-em)]](https://www.rsc.org/images/entities/char_2009.gif) 500 from SEC, based on MALS. Mw/Mn
= 1.06. The isolated yield was 2.0714 g (44%). (Tg)PtBA
= 32 °C. (Tg)PS
= 102 °C. IR: 3647, 3590, 3435, 3020, 2900, 1945, 1725, 1600, 1488, 1450, 1250, 1150, 841, 755, 700, 542 cm−1. 1H NMR (CDCl3)
δ 1.20–1.50 (br, (CH3)3C), 1.24–1.70 (br, meso and racemo CH2 of the polymer backbone), 1.74–1.94 (br, meso CH2 of the polymer backbone), 2.15–2.35 (br, CH of the polymer backbone) ppm. 13C NMR (CDCl3)
δ 27.9–28, 35.5–37.4, 41.5–41.4, 80.3, 108.1, 124.8–129.5, 173.5 ppm.
500 from SEC, based on MALS. Mw/Mn
= 1.06. The isolated yield was 2.0714 g (44%). (Tg)PtBA
= 32 °C. (Tg)PS
= 102 °C. IR: 3647, 3590, 3435, 3020, 2900, 1945, 1725, 1600, 1488, 1450, 1250, 1150, 841, 755, 700, 542 cm−1. 1H NMR (CDCl3)
δ 1.20–1.50 (br, (CH3)3C), 1.24–1.70 (br, meso and racemo CH2 of the polymer backbone), 1.74–1.94 (br, meso CH2 of the polymer backbone), 2.15–2.35 (br, CH of the polymer backbone) ppm. 13C NMR (CDCl3)
δ 27.9–28, 35.5–37.4, 41.5–41.4, 80.3, 108.1, 124.8–129.5, 173.5 ppm.
