The metabonomics of aging and development in the rat: an investigation into the effect of age on the profile of endogenous metabolites in the urine of male rats using 1H NMR and HPLC-TOF MS
R. E.
Williams
,
E. M.
Lenz
,
J. S.
Lowden
,
M.
Rantalainen†
and
I. D.
Wilson
*
Department of Drug Metabolism and Pharmacokinetics, AstraZeneca Pharmaceuticals, Mereside, Alderley Park, Macclesfield, UK SK10 4TG. E-mail: ian.wilson@astrazeneca.com
First published on 22nd April 2005
Abstract
The effect of aging and development in male Wistar-derived rats on the profile of endogenous metabolites excreted in the urine was investigated using both 1H NMR spectroscopy and HPLC-TOF MS using electrospray ionisation (ESI). The endogenous metabolites were profiled in samples collected from male rats every two weeks from just after weaning at 4 weeks up to 20 weeks of age. Multivariate data analysis enabled clusters to be visualised within the data according to age, with urine collected at 4 and 6 weeks showing the greatest differences by both analytical techniques. Markers detected by 1H NMR spectroscopy included creatinine, taurine, hippurate and resonances associated with amino acids/fatty acids, which increased with age, whilst citrate and resonances resulting from glucose/myoinositol declined. A number of ions were detected by HPLC-MS that were only present in urine samples at 4 weeks of age in both positive and negative ESI, with a range of ions, including e.g. carnitine, increasing with age. Age predictions by PLS-regression modelling demonstrated an age-related trend within these data, between 4 and 12 weeks for HPLC-MS and 4–16 weeks for NMR. The possible utility of these techniques for metabonomic investigations of age-related changes in the rat is discussed and the importance of employing suitable control animals in pharmacological and toxicological studies is highlighted.
Introduction
The use of comprehensive “global metabolite” profiling methods of analysis for biological fluids and tissues employed in metabonomic studies can provide novel insights into biological processes. Typically such studies have been performed using 1H NMR spectroscopy combined with multivariate data analysis and this methodology is now well established for the evaluation of metabolic perturbations associated with organ-specific toxicity,1–10 or differences between genders, strains and diurnal effects in rodents11–18etc.1H NMR Spectroscopy is particularly useful as a profiling technique because it enables the multicomponent analysis of proton-containing low molecular weight metabolites to be carried out simultaneously, without the need for metabolite pre-selection. More recently HPLC–MS has emerged as an additional technique, complementary to NMR spectroscopy.19–26 HPLC-MS-based techniques can offer increased sensitivity for certain molecules compared to NMR, and can detect “NMR-invisible” moieties such as sulfates. When applied together NMR and HPLC-MS have the power to provide a more comprehensive metabolic fingerprint than either alone, that better reflects the composition of the sample under investigation. The complementary nature of the combination of NMR and HPLC-MS for metabonomics has been demonstrated by several toxicological studies.24,25Whilst the identification of biomarkers for overt toxicity can be relatively straightforward, the successful exploitation of these biomarkers can be compromised by a lack of appreciation of factors that affect the urinary profile of control animals and inappropriate use of experimental controls. For example, in the case of C57BL10J mice, urine samples collected in the morning were found to contain higher concentrations of creatine, hippurate, trimethylamine, succinate, citrate and α-ketoglutarate and decreased amounts of taurine, trimethylamine-N-oxide, spermine and 3-hydroxy-iso-valerate than samples collected in the afternoon.16 Similarly, urine samples collected from C57BL10J and Alpk∶ApfCD mice were distinguished based on differences in the TCA cycle intermediates and metabolites of the methylamine pathway.13 Such studies have demonstrated the sensitivity of NMR-based metabonomics to detect metabolic differences as a result of subtle perturbations within the same species. Similar work has demonstrated that HPLC-MS can also successfully discriminate samples based on strain and diurnal variation.21,26
The importance of using age-matched controls for NMR-based metabonomic analysis has previously been alluded to with respect to age.27,28 Decreases in citrate and α-ketoglutarate and increases in taurine and creatinine were observed in aging rats, whilst young rats were reported to excrete significant amounts of betaine and trimethylamine N-oxide.27 Such changes, albeit based on sparse sampling over a 20 month period, suggest that the global metabolite profiling techniques used for metabonomic studies may offer new insights into the changes that occur during growth and development, and may offer an interesting approach to studying the metabolic changes that characterise the process of maturation and aging. In addition metabonomics may also offer an interesting means of distinguishing between normal age related changes and changes in diseases whose onset/progression is associated with ageing (e.g. neuro-degenerative diseases, osteoporosis etc.).
Here we describe the 1H NMR and HPLC-MS-observed changes in the urinary endogenous metabolic profile associated with aging in male rats, from a Wistar-derived strain, over a 5 month period.
Experimental
Chemicals
Acetonitrile, HPLC grade, was purchased from Riedel-de Haën (Sigma Aldrich, GmbH); HPLC grade water was purchased from Fisher Scientific (Loughborough, UK). Leucine enkephalin, sodium phosphate, D2O (99 atom%), formic acid and sodium trimethylsilylpropionic acid-[2H4] (TSP) were purchased from Sigma-Aldrich (Poole, UK). The metabonomics performance test mix, used for verification of the LC-MS system (containing theophylline, caffeine, nortriptyline, hippuric acid, and 4-nitrobenzoic acid), was obtained from Waters Corporation (MA, USA).Animals and sample collection
Fortnightly urine samples were collected from male Alderley Park (Wistar-derived) rats (n = 6) by bladder manipulation at the same time each morning from 4 to 20 weeks of age. Food (standard rat and mouse diet) and water was available ad libitum throughout the time course. Samples were stored at −20 °C prior to analysis.Sample analysis
Urine samples were analysed by 1H NMR spectroscopy within 2 weeks of each collection; HPLC-MS analysis was carried out as a single batch at the end of the collection period.1H NMR spectroscopy
Urine was buffered 2 ∶ 1 with phosphate buffer (0.2 M in D2O; pH 7.4) containing TSP (0.5 mg ml−1) prior to analysis by 1H NMR spectroscopy. Analysis was carried out using a Bruker DRX500 NMR spectrometer (Bruker Spectrospin Ltd., Coventry, UK) operating at 500 MHz 1H resonance frequency. 1H NMR spectra were acquired at 30 °C, with a 90° pulse width over a spectral width of 9980.04 Hz into 64 K data points. Typically, 128 or 256 transients were collected with an acquisition time of 3.28 s and a relaxation delay of 1 s. Solvent suppression was achieved by applying the standard ‘Noesypresat’ pulse sequence (Bruker Spectrospin Ltd.). All spectra were manually phase and baseline corrected and the TSP resonance was set to 0.00 ppm.HPLC-MS
For analysis by HPLC-MS, urine samples were centrifuged (13![[thin space (1/6-em)]](https://www.rsc.org/images/entities/char_2009.gif) 000 rpm; 5 min; room temperature) to remove debris and then analysed neat. Chromatography was performed on a Waters Alliance® 2795 HPLC system (Waters Corporation, Milford, USA) equipped with a column oven. The HPLC system was coupled to a Waters Micromass QTof-micro™
(Manchester, UK) equipped with an electrospray source operating in either positive or negative ion mode. The source temperature was set at 120 °C with a cone gas flow of 50 l h−1, a desolvation gas temperature of 250 °C and a desolvation gas flow of 400 l h−1 were employed. The capillary voltage was set at 3.2 kV for positive ion mode and 2.6 kV in negative ion mode and the cone voltage to 30 V. A scan time of 0.4 s with an inter-scan delay of 0.1 s was used throughout, with a collision energy of 4 eV using argon as the collision gas. A lock-mass of leucine enkephalin at a concentration of 0.2 ng µL−1, in 50 ∶ 50 acetonitrile–water + 0.1% formic acid for positive ion mode ([M + H]+
= 556.2771) and 1.0 ng µL−1 in 50 ∶ 50 acetonitrile–water for negative ion mode ([M − H]−
= 554.2615), was employed via a lock spray interface. Data were collected in centroid mode, the lock spray frequency was set at 5 s and the lock mass data were averaged over 10 scans for correction.
000 rpm; 5 min; room temperature) to remove debris and then analysed neat. Chromatography was performed on a Waters Alliance® 2795 HPLC system (Waters Corporation, Milford, USA) equipped with a column oven. The HPLC system was coupled to a Waters Micromass QTof-micro™
(Manchester, UK) equipped with an electrospray source operating in either positive or negative ion mode. The source temperature was set at 120 °C with a cone gas flow of 50 l h−1, a desolvation gas temperature of 250 °C and a desolvation gas flow of 400 l h−1 were employed. The capillary voltage was set at 3.2 kV for positive ion mode and 2.6 kV in negative ion mode and the cone voltage to 30 V. A scan time of 0.4 s with an inter-scan delay of 0.1 s was used throughout, with a collision energy of 4 eV using argon as the collision gas. A lock-mass of leucine enkephalin at a concentration of 0.2 ng µL−1, in 50 ∶ 50 acetonitrile–water + 0.1% formic acid for positive ion mode ([M + H]+
= 556.2771) and 1.0 ng µL−1 in 50 ∶ 50 acetonitrile–water for negative ion mode ([M − H]−
= 554.2615), was employed via a lock spray interface. Data were collected in centroid mode, the lock spray frequency was set at 5 s and the lock mass data were averaged over 10 scans for correction.
An aliquot of urine (5 or 10 µl for negative or positive ion mode respectively) was injected onto a 2.1 mm × 10 cm Symmetry® C18 3.5 µm column (Waters Corporation) held at 40 °C. The column was eluted with a linear gradient of 0–20% B over 0.5–4 min, 20–95% B over 4–8 min, the composition was held at 95% B for 1 min then returned to 100% A at 9.1 min at an eluent flow rate of 600 µl min−1; where A = 0.1% formic acid (aq) and B = 0.1% formic acid in acetonitrile. A “purge–wash–purge” cycle was employed on the autosampler, with 90% aqueous methanol used for the wash solvent and 0.1% aqueous formic acid used as the purge solvent, this ensured that the carry-over between injections was minimized. The mass spectrometric data was collected in full scan mode from m/z 50 to 850 from 0–10 min, in positive and negative ion mode. The column eluent was split such that approximately 100 µl min−1 were directed to the mass spectrometer. Retention time consistency and mass accuracy were confirmed throughout the run by injection of the metabonomics performance test mix (Waters MA, USA), comprising a mixture of theophyline, caffeine, nortryptillyne and hippuric acid, and repeat injection of a “standard” urine sample after every 10 samples.
Data analysis
1H NMR spectroscopy
Using the AMIX software package (version 2.7.5, Bruker Analytische Meßtechnik, Germany), each spectrum was segmented into regions of 0.04 ppm (from 0.2 ppm–10.0 ppm; 256 segments) and the integral value for each segment was calculated.5,6 The regions of the spectrum associated with water and urea (4.5–5.05 and 5.5–6.05 ppm) were then removed and the segmented data were exported into Microsoft Excel (version 7.0a), where the integral values were scaled to the total of the summed integrals of each spectrum in order to partially compensate for differences in urinary dilution. To compensate for peak shift occurring for citrate the spectral regions describing half of the AB resonance were averaged (2.50; 2.54 and 2.58 buckets) whilst the regions from the second half were deleted (2.62; 2.66; 2.70; 2.74). The two buckets describing allantoin were also averaged (5.38; 5.42) for the same reason. The scaled data were then imported into SIMCA-P (version 10.0.2; Umetrics, Sweden) for analysis by pattern recognition methods including PCA and PLS-DA. For this analysis Pareto scaling was employed. In addition, the data was averaged at each time point within Excel and imported into SIMCA-P (version 10.0.2; Umetrics, Sweden). PCA was carried out, using Pareto scaling, to generate a time-related metabolic trajectory.Within the data set four outliers (rat 2, 6 weeks; rat 4, 18 and 20 weeks; rat 6, 10 weeks) were identified due to excessive urinary dilution leading to experimental noise. These samples were removed from the analysis. Rat 6 died between the 10 and 12 week collections.
Age prediction by PLS was undertaken on the NMR data which was mean centred and pareto scaled prior to age predictions by PLS regression.29 The PLS model was calculated by regression against rat age at the time of urine collection. Predictive performance of the PLS model was evaluated by n-fold cross validation with n = 5. PLS modelling and visualisation were carried out in R30 using in-house routines.
HPLC-MS
The LC-MS data were analysed using the Micromass MarkerLynx Applications Manager version 1.0 (Waters Ltd.). MarkerLynx incorporates a peak deconvolution package that allows detection of the mass, retention time and intensity of the peaks eluting in each chromatogram. The data were combined into a single matrix by aligning peaks with the same mass/retention time pair together from each data file in the dataset. The intensities for each peak were normalised to the sum of the peak intensity for each data set. The processed data list was then analysed by PCA and PLS-DA using SIMCA-P (version 10.0.2; Umetrics, Sweden) and employing unit variance scaling.Age prediction by PLS analysis was performed on positive ion HPLC-MS data which was mean centred and Pareto scaled prior to age predictions by PLS regression.29 The PLS model was calculated by regression against rat age at the time of urine collection. Predictive performance of the PLS model was evaluated by n-fold cross validation with n = 5. PLS modelling and visualisation were carried out in R28 using in-house routines as for the NMR data.
Results
1H NMR spectroscopy
Age-related alterations to the urinary profile were readily apparent in the NMR spectra following visual examination, with increases in creatinine and taurine being observed (Fig. 1). Such age-related increases have been noted previously in the rat using 1H NMR.27,28 In order to fully characterise the metabolic changes PCA was employed revealing a clear clustering of the data according to age, with the urine samples collected from rats at 4 and 6 weeks old clustering most prominently (Fig. 2A). Removal of the 4 and 6 week data sets from the analysis demonstrates that whilst clustering of samples still exists according to age, specifically at 8 weeks, the progression of samples with time is less apparent (Fig. 2B). This is further demonstrated with the mean trajectory obtained from this data (Fig. 2C) where after 8 weeks the data points locate largely within the same region of the scores plot. The variables that contributed to the clustering were investigated in order to define metabolic changes associated with age. Increases in creatinine and taurine were observed (Fig. 3A and B respectively, see also the NMR spectra shown in Fig. 1) as well as a general decline in citrate (Fig. 3C) (also noted by previous workers27). A general increase in signals arising from low molecular mass compounds such as amino acids/fatty acids (0.80–1.04) was also observed with increasing age, particularly at 0.86 ppm (Fig. 3F). | ||
| Fig. 1 1H NMR spectroscopy: 1H NMR spectra (0.5–4.6 and 6.4–8.1 ppm) obtained from urine samples collected from a male AP rat at (A) 4 weeks (B) 12 weeks and (C) 20 weeks of age. | ||
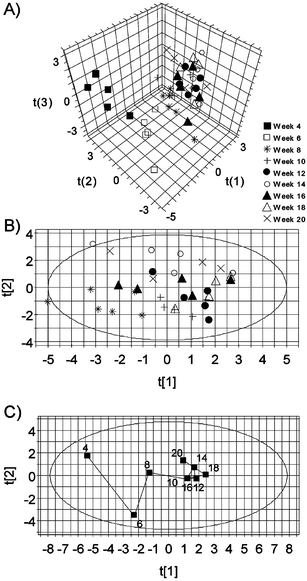 | ||
| Fig. 2 1H NMR spectroscopy and PCA: (A) scores plot (t(1) versust(2) versust(3)) obtained from 1H NMR spectra of individual urine samples collected from male AP rats between 4 and 20 weeks of age; (B) scores plot (t(1) versust(2)) obtained from 1H NMR spectra of individual urine samples collected from male AP rats between 8 and 20 weeks of age; (C) scores plot (t(1) versust(2)) obtained from 1H NMR spectra of mean urine samples collected from male AP rats aged between 4 and 20 weeks demonstrating a time-related mean trajectory. | ||
 | ||
| Fig. 3 1H NMR spectroscopy—metabolic alterations: (A–F) normalised intensities obtained from specific spectral regions, with corresponding metabolite identity, obtained from 1H NMR spectra of urine samples collected from male AP rats aged between 4 and 20 weeks old. Data expressed as mean ± standard deviation. | ||
Some age-related variability in the urinary hippurate concentration was observed (Fig. 3D) with its excretion being relatively low, and variable, in urine from animals aged 4 and 6 weeks, but becoming present in increased (and less variable) amounts with increasing age. Furthermore, resonances resulting from the presence of glucose/myoinositol (between ∼3.52 and 3.72 ppm) declined with age (Fig. 3E), being most prominent at 4 and 6 weeks. Similarly unassigned resonances at 4.24–4.32 ppm, 2.38 and 2.20 ppm, present at low concentrations in the urine even at the 4 and 6 week time-points also declined with age.
Given the clear observation of age-related changes in the urine of these animals shown in Fig. 1–3 further analysis of the data was undertaken using PLS regression30 in order to determine if it might be possible to model and predict the age of the animals based on the urinary NMR spectra. The results of this approach are shown in Fig. 4, in which a clear, almost linear, trend is seen from 4 to ca. 16 weeks after which the rate of change appears to be more modest.
 | ||
| Fig. 4 1H NMR spectroscopy and PLS regression: cross validated age predictions by a PLS model with three components. Data expressed as mean ± standard deviation. | ||
HPLC-MS
The urine samples were also analysed using gradient reversed-phase HPLC with detection via both positive and negative electrospray ionisation mass spectrometry (ESI-MS). | ||
| Fig. 5 HPLC-MS, positive ion mode: 2-dimensional mass chromatogram (m/z 50–600; 1.0–8.0 min) obtained from HPLC-MS analysis of urine samples collected from (A) a 4 week old rat and (B) a 20 week old rat. | ||
 | ||
| Fig. 6 HPLC-MS, positive ion mode, and PLS-DA: scores plots (t(1) versust(2) versust(3)) obtained from positive ion HPLC-MS analysis of individual urine samples collected from (A) male AP rats between 4 and 20 weeks old and from (B) male AP rats between 10 and 20 weeks old. | ||
Ions which have the highest influence on the model, according to the PLS weights, are shown in Table 1. A significant number of ions appeared to be present specifically in the 4 week urine samples only, including ions at m/z 181, 199, 229, 237, 239, 248, 285, 299 respectively (accurate mass, postulated atomic composition and retention times for these compounds are given in Table 1). At 6 and 8 weeks, an increase in an ion of m/z 127 was observed, whilst the ions m/z 136 and 162 (identified as carnitine by standard addition) were seen to increase over the whole time course. The time course for three of these ions (m/z 162, 181 and 299) is shown in Fig. 7. The identity of the majority of these compounds is as yet undetermined and work to further characterise these molecules is on going.
 | ||
| Fig. 7 HPLC-MS, positive ion—metabolic alterations: (A–C) normalised peak intensities obtained for specific m/z values obtained from positive ion HPLC-MS analysis of urine samples collected from male AP rats between 4 and 20 weeks old. Data expressed as mean ± standard deviation. The ion m/z 162.1111 represents carnitine. | ||
| Trend | RT/min | m/z | Postulated atomic composition (accurate mass) | Suggested metabolite identity |
|---|---|---|---|---|
| Increasing at 4 weeks | 3.0 | 181.0874 | C10H13O3 (181.0865) | — |
| Increasing at 4 weeks | 5.4 | 229.1469 | C12H21O4 (229.1440) | — |
| Increasing at 4 weeks | 4.4 | 199.0988 | C10H15O4 (199.0970) | — |
| Increasing at 4 weeks | 5.7 | 237.1524 | C11H25O3S (237.1524) | — |
| C14H21O3 (237.1491) | — | |||
| Increasing at 4 weeks | 4.1 | 285.1296 | C11H26O4PS (285.1289) | — |
| C10H17N6O4 (285.0311) | — | |||
| Increasing at 4 weeks | 5.4 | 248.1721 | C11H24N2O4 | |
| Increasing at 4 weeks | 4.4 | 239.0946 | CPH1PO5S (239.0953) | — |
| C12H15O5 (239.0919) | — | |||
| Increasing at 4 weeks | 5.7 | 299.1296 | C18H19O4 (299.1283) | Enterolactone |
| Increasing at 6 and 8 weeks | 2.7 | 127.0384 | C6H7O3 (127.0395) | — |
| Increasing with age | 0.6 | 136.04977 | C3H8N2O4 (136.0484) | — |
| Increasing with age | 0.6 | 162.1111 | C7H16NO30 (162.1130) | Carnitine |
Age prediction by PLS as undertaken for the NMR data was also applied to the positive ESI HPLC-MS results as shown in Fig. 8. In this case, although the PLS model shows a pronounced age-related trend it is less striking than that produced by the NMR data.
 | ||
| Fig. 8 HPLC-MS, positive ion mode, and PLS regression: cross validated age predictions by a PLS model with three components. Data expressed as mean ± standard deviation. | ||
 | ||
| Fig. 9 HPLC-MS, negative ion mode: 2-dimensional mass chromatogram (m/z 50–600; 1.0–8.0 min) obtained from HPLC-MS analysis of urine samples collected from (A) a 4 week old rat and (B) a 20 week old rat. | ||
 | ||
| Fig. 10 HPLC-MS, negative ion mode, and PLS-DA: scores plots (t(1) versust(2) versust(3)) obtained from negative ion HPLC-MS analysis of individual urine samples collected from (A) male AP rats between 4 and 20 weeks old (B) male AP rats between 10 and 20 weeks old. | ||
A number of ions were found predominantly in the urine samples collected from 4 week old animals, including m/z (RT, mins): 189 (3.47); 197 (5.22), 208 (3.31), 215 (4.53), 289 (5.33), 317 (5.71), 369 (5.25), 399 (4.98), 413 (5.39), 439 (5.55) and 473 (5.70). At 6 weeks of age, ions of m/z 219 (4.25), 125 (3.53),168 (2.76), 265 (5.21), 373 (5.15), 203 (4.98), 218 (3.91) and 301 (2.79). Proposed atomic compositions for a number of these ions are shown in Table 2, however metabolite identifications have not been possible, despite searches of available databases using accurate masses and atomic compositions. Ions that increased over time included 294 (0.49), 175 (1.86) and 167 (0.79). The postulated atomic compositions for two of these metabolites are C6H7O6 (m/z 175.0272) and C5H4N4O3 (m/z 167.0248) which correspond to ascorbic acid and urate respectively. However, as was the case with many of the ions detected by HPLC with positive ESI-MS the identity of many of these compounds is as yet undetermined and work to characterise these structures is on going.
| m/z (RT/min) | Proposed atomic composition (ppm error) |
|---|---|
| 125.0265 (3.53) | C3H9O3S (5.60) |
| 168.0327 (2.76) | C4H10NO4S (2.38) |
| 197.0870 (5.22) | C7H17O4S (11.16) |
| C4H13N4O5 (8.12) | |
| 289.1680 (5.33) | C14H25O6 (10.02) |
| C15H21N4O2 (5.19) | |
| 317.2009 (5.71) | C19H27NO3 (5.04) |
| 369.1226 (5.25) | C18H25O4S2 (8.67) |
| C18H17N4O5 (7.31) |
Age prediction by PLS was also performed on the negative ESI HPLC-MS data with the results shown in Fig. 11. Once again an age-related progression can be observed over the 6 to 12 week period.
 | ||
| Fig. 11 HPLC-MS, negative ion mode, and PLS regression: cross validated age predictions by a PLS model with three components. Data expressed as mean ± standard deviation. | ||
Discussion
Both high resolution 1H NMR spectroscopy and HPLC-ESI-MS, in positive and negative ionisation mode were able to detect clear, age-related, changes in urinary composition. These changes were initially rapid, but by ca. 12–16 weeks (depending upon the analytical technique employed) the composition of the urine stabilised and was more constant, providing relatively stable profiles. The largest differences between samples, detected by both NMR spectroscopy and HPLC-MS techniques, were seen for the early samples (4 and 6 weeks) perhaps reflecting changes corresponding to a changeover of the animals from weaning to weaned. Indeed, the changes in urinary metabolite profiles that were observed in this study no doubt reflect a large number of processes that will have been taking place during the development of these animals. Previous studies with NMR spectroscopy have demonstrated a dependence of the excretion profile in the aromatic region of the spectrum on the gut microflora. In particular, it has been demonstrated that the excretion of hippurate and m-hydroxyphenylpropionic acid (m-HPPA) can alter according to diet and environment.12,33–35 Rats that are void of gut microflora, either due to the use of antibiotics, or establishment of germ-free strains, take about three to four weeks to establish a stable urinary aromatic profile.35,36 The proposed excretion of large amounts of phenolic acid-derived components in the urine at 4 weeks by HPLC-MS, coupled with the instability observed in hippurate excretion (by NMR), suggest that at this age the gut microflora are rapidly altering in the young rat. These animals were weaned at three weeks of age, thus it is probable that the observed changes reflect, at least in part, the maturation of the gut microflora as it adapts to an adult diet. So, in addition to the maturation of the gut microflora reflected in the changes in the profile of aromatic components such as hippurate there will also have been the development of the urine concentrating ability by the kidney with its associated age-related changes in renal function.31,32 Clearly changes in kidney function can be expected to be reflected in urinary composition. Newborn rats are not capable of producing concentrated urine which is consistent with the expression of transporter proteins that mediate urea transport in the kidney increasing during postnatal development.31 Furthermore, it has been demonstrated that the water channel aquaporin-2 is expressed at low levels in the kidney during early postnatal life, reaching maximal expression at 10 weeks of age associated with a concurrent increase in urine osmolality32 suggesting a role in urine concentrating abilities. The urinary concentrations of the renal enzyme, β-N-acetylglucosaminidase (NAG), in rat urine increase significantly in adult rats (3–6 months) compared to young rats (1 month old), whilst from 3 months of age, increases in urinary protein and creatinine have been reported demonstrating changes in renal function with age.36 Much evidence exists for age-related changes in creatinine excretion in humans, with increases being observed in children as they progress to adulthood34 with concentrations declining later in life37,38 correlating with changes in muscle mass and nutritional status. Hence the changes observed regarding the excretion of creatine in this study, and previously by Bell et al.,27 using 1H NMR spectroscopy probably reflect the growth of the animals. Other developmental events that will have been taking place will have included changes in xenobiotic metabolising capabilities, reflected in differing susceptibilities to toxins. In the liver there will also have been age-related metabolism differences for metabolites such as free fatty acids; changes in taurine and creatinine etc. Sexual maturation will also, no doubt, have made a contribution to the changes in these profiles.In addition to the potential for using these techniques as a means of studying aging in rodents these data highlight the great care that must be taken when performing metabonomic studies in animals for e.g., toxicologlogical or pharmacologoical purposes. Thus, in toxicological studies in the rat an increase in the urinary excretion of taurine has been associated with liver injury, e.g., following exposure to chemicals such as hydrazine and carbon tetrachloride.39,40 Often preliminary toxicology studies are performed in animals of 8 to10 weeks in age and reproductive toxicity studies may also start in relatively young anuimals. The pronounced increase in taurine excretion observed here must therefore be taken into account when using this metabolite as a marker and the importance of ensuring adequate control animal data cannot be overemphasised. Clearly pre-dose samples for each animal will not provide suitable controls for a long term/chronic study, or indeed even for a 1–2 week study if undertaken in the first 4 to 16 weeks of life.
Conclusions
Both of the analytical technologies were capable of detecting age-related differences in the urinary metabolic profile of rats with the changes being most pronounced in the younger animals (ca. 4–16 weeks). As a result of the maturity of 1H NMR spectroscopy as a technique for metabonomic research many of the metabolites responsible for the age-related urinary metabolite profiles could be identified. However, in the case of HPLC-MS, whilst the detection of biomarkers was facile, the process of identification currently remains much more demanding, due in part to the limited databases available. Significant effort must be directed towards defining the urinary MS-detected metabonome if HPLC-MS-based approaches are to fulfil their potential.As well as demonstrating the potential of these techniques for studying aging and development the significant changes in profile over 2 week periods highlights the importance of ensuring that suitable age matched controls are employed for metabonomic studies in e.g., toxicology and pharmacology.
References
- J. K. Nicholson, J. C. Lindon and E. Holmes, Xenobiotica, 1999, 29, 1181 CrossRef CAS.
- K. P. R. Gartland, F. W. Bonner and J. K. Nicholson, Mol. Pharmacol., 1989, 5, 242.
- E. Holmes, F. W. Bonner, B. C. Sweatman, J. C. Lindon, C. R. Beddell, E. Rahr and J. K. Nicholson, Mol. Pharmacol., 1992, 42, 922 CAS.
- M. L. Anthony, C. R. Beddell, J. C. Lindon and J. K. Nicholson, Arch. Toxicol., 1994, 69, 99 CrossRef CAS.
- E. Holmes, A. W. Nicholls, J. C. Lindon, S. Ramos, M. Spraul, P. Neidig, S. C. Connor, J. Connelly, S. J. P. Damment, J. Haselden and J. K. Nicholson, NMR in Biomed., 1998, 11, 235 Search PubMed.
- B. M. Beckwith-Hall, J. K. Nicholson, A. W. Nicholls, P. J. Foxall, J. C. Lindon, S. C. Connor, M. Abdi, J. Connelly and E. Holmes, Chem. Res. Toxicol., 1998, 11, 260 CrossRef CAS.
- D. G. Robertson, M. D. Reily, R. E. Sigler, D. F. Wells, D. A. Paterson and T. K. Braden, Toxicol. Sci., 2000, 57, 326 CrossRef CAS.
- E. M. Lenz, I. D. Wilson, J. A. Timbrell and J. K. Nicholson, Biomarkers, 2000, 5, 424 CrossRef CAS.
- R. E. Williams, M. Jacobsen and E. A. Lock, Chem. Res. Toxicol., 2003, 16, 1207 CrossRef CAS.
- R. E. Williams, L. Cottrell, M. Jacobsen, L. R. Bandara, M. D. Kelly, S. Kennedy and E. A. Lock, Biomarkers, 2003, 8, 472 CrossRef CAS.
- M. Yasuda, S. Tsunoda and H. Nagasawa, In Vivo, 1997, 11, 109 Search PubMed.
- C. L. Gavaghan, J. K. Nicholson, S. C. Connor, I. D. Wilson, B. Wright and E. Holmes, Anal. Biochem., 2001, 291, 245 CrossRef CAS.
- C. L. Gavaghan, E. Holmes, E. Lenz, I. D. Wilson and J. K. Nicholson, FEBS Lett., 2000, 484, 169–174 CrossRef CAS.
- A. R. Tate, S. J. P. Damment and J. C. Lindon, Anal. Biochem., 2001, 291, 17 CrossRef CAS.
- M. E. Bollard, E. Holmes, J. C. Lindon, S. C. Mitchell, D. Branstetter, W. Zhang and J. K. Nicholson, Anal. Biochem., 2001, 295, 194 CrossRef CAS.
- C. L. Gavaghan, I. D. Wilson and J. K. Nicholson, FEBS Lett., 2002, 530, 191 CrossRef CAS.
- J. L. Griffins, L. A. Walker, S. Garrod, E. Holmes, R. F. Shore and J. K. Nicholson, Comp. Biochem. Physiol B., 2000, 127, 3, 357.
- E. Holmes, J. K. Nicholson and G. Tranter, Chem. Res. Tox., 2001, 14, 182 Search PubMed.
- R. S. Plumb, C. L. Stumpf, J. H. Granger, J. Castro-Perez, J. N. Haselden and G. J. Dear, Rapid Commun. Mass Spectrom., 2003, 17, 2632 CrossRef CAS.
- R. S. Plumb, C. L. Stumpf, M. V. Gorenstein, J. M. Castro-Perez, G. J. Dear, M. Anthony, B. C. Sweatman, S. C. Connor and J. N. Haselden, Rapid Commun. Mass Spectrom., 2002, 16, 1991 CrossRef CAS.
- R. Plumb, J. Granger, C. Stumpf, I. D. Wilson, J. A. Evans and E. M. Lenz, Analyst, 2003, 128, 819 RSC.
- H. Idborg-Bjorkman, P.-O. Edlund, O. M. Kvalheim, I. Schuppe-Koistinen and S. P. Jacobsson, Anal. Chem., 2003, 75, 4784 CrossRef.
- A. Lafaye, C. Junot, B. Ramounet-Le Gall, P. Fritsch, J.-C. Tabet and E. Ezan, Rapid Commun. Mass Spectrom., 2003, 17, 2541 CrossRef CAS.
- E. M. Lenz, J. Bright, R. Knight, I. D. Wilson and H. Major, Analyst, 2004, 129, 535 RSC.
- E. M. Lenz, J. Bright, R. Knight, I. D. Wilson and H. Major, J. Pharm. Biomed. Anal., 2004, 35, 599–608 CrossRef CAS.
- R. E. Williams, I. D. Wilson, E. M. Lenz, J. H. Granger, R. S. Plumb and C. L. Stumpf, J. Pharm. Biomed. Anal. Search PubMed , accepted for publication.
- J. D. Bell, P. J. Sadler, V. C. Morris and O. A. Levander, Mag. Res. Med., 1991, 17, 414 Search PubMed.
- D. G. Robertson, M. D. Reilly, J. C. Lindon, J. C. Holmes and J. K. Nicholson, Compr. Toxicol., 2002, 14, 583 Search PubMed.
- H. A. Martens and T. Naes, Multivariate calibration, Chichester, Wiley, 1991 Search PubMed.
- R Development Core Team, R: A language and environment for statistical computing, R Foundation for statistical Computing, Vienna, Austria, 2004, ISBN 3-900051-00-3, http://www.R-project.org. Search PubMed.
- Y. H. Kim, D. U. Kim, K. H. Han, J. Y. Jung, J. M. Sands, M. A. Knepper, K. M. Madsen and J. Kim, Am. J. Physiol. Renal. Physiol., 2002, 282, F530 Search PubMed.
- M. Bonilla-Felix and W. Jiang, J. Am. Soc. Nephrol., 1997, 8, 1502 Search PubMed.
- A. N. Phipps, J. Stewart, B. Wright and I. D. Wilson, Xenobiotica, 1998, 28, 527 CrossRef CAS.
- R. E. Williams, H. W. Eyton-Jones, M. J. Farnworth, R. Gallagher and W. M. Provan, Xenobiotica, 2002, 32, 783 CrossRef CAS.
- A. W. Nicholls, R. J. Mortishire-Smith and J. K. Nicholson, Chem. Res. Toxicol., 2003, 16, 1395 CrossRef CAS.
- C. Sanchez-Bernal, A. Martin-Gonzalez, J. A. Cabezas, E. Villar and N. Perez-Gonzalez, Mech. Ageing Dev., 1992, 66, 121 CrossRef CAS.
- A. M. Skinner, G. M. Addison and D. A. Price, Eur. J. Pediatr., 1996, 155, 596 CrossRef CAS.
- K. M. Davies, R. P. Heaney and K. Rafferty, Metabolism, 2002, 51, 935 CrossRef CAS.
- S. M. Sanins, J. K. Nicholson, C. Elcombe and J. A. Timbrell, Arch. Toxicol., 1990, 64, 407 CAS.
- T. A. Clayton, J. C. Lindon, J. R. Everett, C. Charuel, G. Hanton, J-L. Le net, J-P. Provost and J. K. Nicholson, Arch. Toxicol., 2003, 77, 208 CAS.
Footnote |
| † Present address, Biological Chemistry, Imperial College, London, UK |
| This journal is © The Royal Society of Chemistry 2005 |