Biomolecule detection via target mediated nanoparticle aggregation and dielectrophoretic impedance measurement
Philip J.
Costanzo†
a,
Enzhu
Liang†
b,
Timothy E.
Patten
a,
Scott D.
Collins
ce and
Rosemary L.
Smith
*bde
aChemistry Department, University of California at Davis, One Shields Ave., Davis, CA 95616, USA
bElectrical and Computer Engineering Department, University of California at Davis, One Shields Ave., Davis, CA 95616, USA
cChemistry Department, University of Maine, Sawyer Research Center, Orono, ME 04469-5764, USA
dElectrical and Computer Engineering Department, University of Maine, Sawyer Research Center, Orono, ME 04469-5764, USA
eLaboratory for Surface Science and Technology, University of Maine, 5764 Sawyer Research Center, Orono, ME 04469-5764, USA. E-mail: rosemary.smith@maine.edu; Tel: 207 581 336
First published on 29th April 2005
Abstract
A new biosensing system is described that is based on the aggregation of nanoparticles by a target biological molecule and dielectrophoretic impedance measurement of these aggregates. The aggregation process was verified within a microchannel via fluorescence microscopy, demonstrating that this process can be used in a real time sensor application. Positive dielectrophoresis is employed to capture the nanoparticle aggregates at the edge of thin film electrodes, where their presence is detected either by optical imaging via fluorescence microscopy or by measuring the change in electrical impedance between adjacent electrodes. The electrical detection mechanism demonstrates the potential for this method as a micro total analysis system (µTAS).
Introduction
The analysis of biological molecules has become increasingly important over the past few years, due in part to the potential threat that deadly toxins, viruses, and bacteria pose as warfare agents. Consequently, the science and engineering of detection, identification and quantification of small quantities of target biomolecules are rapidly expanding fields of endeavor.In this paper, a sensing mechanism for biomolecules that is based on nanoparticle aggregation is presented. This method is demonstrated to be capable of detecting nanomolar concentrations of a target biomolecule by the dielectrophoretic impedance measurement method. The positive dielectrophoretic force is utilized to capture suspended nanoparticle aggregates onto an interdigitated, electrode array. As a proof of principle, the aggregation of biotinylated nanoparticles in the presence of avidin and their collection by dielectrophoresis (DEP) within a microchannel are demonstrated as the basis of an automated, biomolecular detection microsystem.
Principal mechanisms
Dielectrophoresis (DEP) is the movement of polarizable particles in non-uniform, alternating electric fields.1 The time-dependent DEP force for a spherical particle suspended in an electrolyte is given by2| 〈FDEP〉 = 2πa3εm Re[fCM] Δ|Erms|2 | (1) |
 | (2) |
 | (3) |
 , ω is the angular frequency of the electric field, ε is the permittivity and σ is the conductivity.
From eqn. (1) to (3), it is readily apparent that the DEP force is a function of particle size, the electric field gradient, the frequency of the applied signal, and the dielectric properties of the materials. The positive DEP force, which collects the nanoaggregates at the electrode edges, is achieved when the real part of fCM is positive; while the negative DEP, which pushes the nanoaggregates away from the electrode edges, occurs if fCM is negative.
In this paper, positive DEP forces are used to selectively capture and concentrate nanoparticle aggregates containing a target biomolecule, over individual nanoparticles. This is possible because the aggregates only form in the presence of the target and because of the dependence of the force magnitude on particle radius cubed. Alternatively, by preparing nanoparticles of a different composition, negative DEP can be achieved and used to levitate and transport aggregates to a collection/detection site.
Fluorescent nanoparticles are attractive alternatives to organic dyes as biological labels due to their stability, resistance to photobleaching and tunability of photoemission. Additionally, their surfaces can be conjugated with biologically active small molecules, DNA, and proteins with specific binding properties as well as polymers that are inert to biological adhesion.3–8 As part of a detection scheme, they provide a robust platform for chemical/biological information and signal detection.
In prior work, it was demonstrated that nanoparticles with surfaces that were modified with a ligand for proteins (biotin) would aggregate in the presence of the complementary protein (avidin). This process emulates the well known Latex® agglutination test,9 used in a number of commercially available immunoassays. The nanoparticles (Fig. 1, top) were composed of a 40 nm diameter CdS@SiO2 inorganic core, surface-grafted with water solubilizing poly(ethylene glycol) (PEG) chains via a monosiloxane linkage. The PEG chain ends carried a biotin group (Fig. 1, bottom left). The kinetics of aggregate growth rate were studied using dynamic light scattering (DLS), and the rate of aggregation was shown to depend upon the nanoparticle surface biotin content and the initial concentration of avidin.10 Under optimal conditions, micron sized aggregates formed within several minutes (Fig. 1, bottom right), promoted by avidin concentrations down to nanomolar levels.
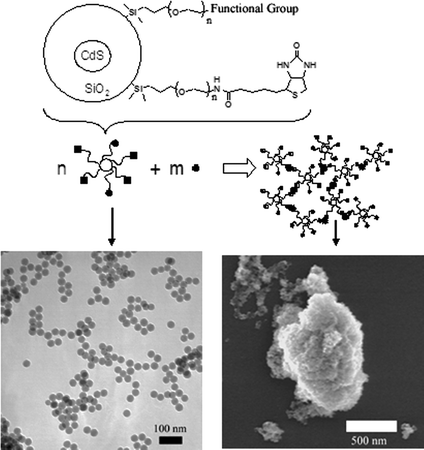 | ||
| Fig. 1 Top: schematic representation of biotinylated nanoparticle structure and the formation of aggregates upon addition of avidin. Functional group: 5-fluorescein or carboxamidoferrocene. Bottom, left: TEM of nanoparticles. Bottom, right: SEM of nanoparticle–avidin aggregates. | ||
The dielectrophoretic impedance measurement (DEPIM) method was reported by Suehiro11–13 for bacteria detection. This method utilizes positive dielectrophoresis to attract polarized particles to the edges of an interdigitated electrode array, resulting in an end-to-end alignment of particles that is similar to a pearl chain. If the pearl chains bridge the electrode gap, the admittance between the electrodes increases. By monitoring the change in impedance, the bacteria can be detected and its population can be evaluated by the magnitude of the change. In this paper, the DEPIM method is employed to detect the presence of collected nanoparticle aggregates.
Materials and methods
Materials
All materials were purchased from commercially available sources and used without further purification. Depending upon the detection method, some of the chain ends of the surface grafted PEGs were conjugated with functional groups in addition to biotin. Due to the low quantum yields of silica coated CdS nanoparticles prepared using the reverse micelle method, a fluorescent dye, 5-fluorescein isothiocyante (FITC), was attached to some of the chain ends to enhance the fluorescence intensity of the particles. This procedure has been described previously.9 For another set of particles, some of the PEG chain ends were conjugated with ferrocene carboxylic acid in order to impart redox activity to the particles. The N-hydroxysuccinimide ester of carboxyferrocene was prepared14 and allowed to react with some of the amine-terminated PEGs on the particle surface to yield ferrocene carboxamide chain ends. The reaction was allowed to proceed for 24 h, and the particles were then isolated by five centrifuge/decant/resuspend cycles with CH3OH/hexane/THF (1 ∶ 1 ∶ 3).CV of ferrocene-containing nanoparticles
Electrochemical measurements were performed using a PAR model 263 pontentiostat/galvanostat using a gold film working electrode, a silver wire counter electrode and 0.1 M (nBu4N+)(PF6−) supporting electrolyte in dry acetonitrile solution. Potentials were recorded vs a standard calomel reference electrode (SCE). The solution was purged with N2 for 10 min prior to recording the voltammogram. Functionalized nanoparticles were deposited onto the gold electrode to produce a thin film. Free ferrocene was added to the solution of each experiment as an internal standard.Fabrication of DEP electrodes
A standard, lift-off process was used to pattern the metal electrodes, as described below. The electrode area was photolithographically defined on the surface of standard, borosilicate glass microscope slides. Then, a 150 Å chrome adhesion layer was deposited, followed by the deposition of a 150 nm thick platinum layer by sequential e-beam evaporation in a single pump-down. The resulting length and width of the electrodes and the gap between two adjacent electrode edges were 1.8 mm, 50 µm and 5 µm, respectively.Fabrication of a DEP microchannel
A convenient way to construct sealed and optically clear chambers for dielectrophoretic applications has been developed using SU-8, the details of which are to be published elsewhere.15 Briefly, the process starts by photolithographically defining an open channel, 50 to 100 µm wide, in a 20 µm thick layer of SU-8 directly above the electrode array, then mechanically drilling 1 mm diameter, inlet and outlet ports into the glass slide, and finally bonding a thin (100 µm) glass cover on top, using a thin, intermediate layer of prebaked SU-8 (about 3 µm). After exposure through a mask, the unexposed, intermediate SU-8 is developed from the glass surface within the chamber, leaving a clean glass surface for optimal transparency. Tubing and electric wiring are then connected for supplying solution and electric signal, respectively.DEPIM equipment and test setup
The dielectrophoresis channel and electrodes were connected to peripheral measurement, imaging and actuation instruments as shown in Fig. 2. The fluidic samples were pumped into the inlet tubing with a desired flow rate controlled by a syringe pump, with the waste directed into a bottle through the outlet tubing. The behaviour of the nanoparticles/nanoaggregates in the system was observed and recorded with a fluorescence microscope (Nikon Microphot SA) equipped with a digital camera. The waveforms of the applied AC signal and the voltage drop on RL were monitored using a digital oscilloscope (HP54610B). The AC signal generated by a function generator (HP3310A) had a frequency range of 150 kHz to 5 MHz and a magnitude range of 2.5 to 10 V. An equivalent circuit for the DEPIM experiment is shown in the upper left corner of Fig. 2. | ||
| Fig. 2 Experimental setup and equivalent circuit model for dielectrophoresis and impedance measurement. | ||
Results and discussion
CV of redox active nanoparticles
Confirmation of the presence of ferrocene groups on the nanoparticle surface via elemental analysis or UV/Vis spectroscopy failed due to the small number of ferrocene groups per particle and light scattering from suspensions of the particles. However, cyclic voltammetry (CV) proved to be effective. A film of derivatized nanoparticles was deposited onto a gold film working electrode, and the film was submerged into an electrolyte solution containing ferrocene as an internal standard. Fig. 3 shows the results of three experiments. In the control experiment, the electrode film contained particles without carboxamide chain ends. The corresponding voltammogram only showed a redox wave corresponding to the ferrocene internal standard at 448 mV. The CV of the particle film containing the ferrocene carboxamide chain ends showed two redox waves at 448 and 668 mV. The oxidation potential of carboxylate derivatives of ferrocene is known to be higher than that of ferrocene due to the electron withdrawing nature of the functional groups.16 Confirmation that the new signal at the higher oxidation potential corresponded to that of the conjugated ferrocene derivative came from a repetition of the experiment with ferrocene carboxylic acid added to the electrolyte solution. In this third experiment, the intensity of the redox wave at 668 mV increased after the solution was spiked.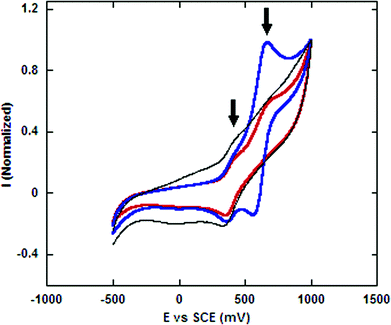 | ||
| Fig. 3 Cyclic voltammetry of nanoparticles conjugated with carboxylic ferrocene confirming the attachment of ferrocene to the particles. Black: nanoparticles without carboxamidoferrocene. Red: carboxamidoferrocene functionalized nanoparticles. Blue: carboxamidoferrocene functionalized nanoparticles and free ferrocenyl carboxylic acid. Free ferrocene was added to all experiments as an internal standard. | ||
Microchannel experiments
When suspensions of biotinylated nanoparticles ([nanoparticle]0 = 0.15 mg mL−1) were mixed with solutions of avidin ([avidin]0 = 10 to 1500 nM), in a mL sample volume, large nano- and micron-sized aggregates resulted, as verified by SEM images of dried samples (Fig. 1). In order to demonstrate and verify that the aggregation process would also take place within the <100 nL volume of the microchannel, fluorescence microscopy was utilized. Although individual nanoparticles are smaller than the limit of resolution of the microscope camera and are therefore unresolvable, the large aggregates are clearly visible due to the high concentration of the FITC within those structures. Also, the microchannel confines the nanoparticles to a relatively small region and volume, which greatly simplified locating the aggregates within the small field of view of the microscope at 400× magnification.Before each fluorescence imaging experiment, the microchannel and reservoirs were cleaned and checked in the microscope to ensure the absence of fluorescence from contaminants or other artifacts. First, premixed solutions of avidin (100 nM) and the nanoparticles were added to the microchannel. After several minutes, bright fluorescing spots, of several micron radii, appeared, randomly dispersed within the microchannel. In order to verify that the appearance of the bright fluorescent spots was caused by avidin promoting the formation of aggregates, a laminated flow experiment was carried out. Two syringes and a hand driven syringe pump were attached to the inlet reservoir of the microchannel. One syringe contained biotinylated nanoparticles dispersed in water while the other contained an aqueous solution of avidin. The two solutions were introduced simultaneously into the microchannel, forming laminating flow columns as shown in Fig. 4, top. The microchannel was continuously imaged during the experiment using the fluorescence microscope. The flow was stopped, allowing the two solutions to mix at their interface by diffusion. After approximately ten minutes, bright, luminescent spots appeared along the center of the microchannel. A photomicrograph of the luminescent spots inside the microchannel is shown in Fig. 4, bottom.
![Fluorescent microscopy of nanoaggregation within a microchannel. Top: schematic representation of laminar flow experiment. Bottom: fluorescent image of microchannel filled with nanoaggregates comprised of nanoparticles and avidin. Conditions: [nanoparticles]0
= 0.15 mg mL−1; [avidin]0
= 100 nM.](/image/article/2005/LC/b417535b/b417535b-f4.gif) | ||
| Fig. 4 Fluorescent microscopy of nanoaggregation within a microchannel. Top: schematic representation of laminar flow experiment. Bottom: fluorescent image of microchannel filled with nanoaggregates comprised of nanoparticles and avidin. Conditions: [nanoparticles]0 = 0.15 mg mL−1; [avidin]0 = 100 nM. | ||
After demonstrating aggregation within a microchannel, a series of experiments were performed to demonstrate collection of the aggregates with DEP. Preliminary DEP experiments used solutions of pre-formed nanoaggregates. The solutions were injected into the microchannel at a flowrate of 40 µL min−1 using a syringe pump while a DEP signal of 5 volts ac at 1 MHz was applied. After six minutes, aggregates were observed to collect at the electrodes via fluorescence microscopy (Fig. 5A and 5B).
![Photographs of electrodes after DEP showing (A) background fluorescence of nanoparticles (no avidin present) and (B) nanoaggregates (avidin present) over 6 minutes. (C) Impedance measurements displaying an increase in conductance over time when avidin is present in solution. Conditions: [nanoparticles]0
= 0.15 mg mL−1; [avidin]0
= 100 nM; magnitude of AC signal =
−5 V; frequency = 1 MHz.](/image/article/2005/LC/b417535b/b417535b-f5.gif) | ||
| Fig. 5 Photographs of electrodes after DEP showing (A) background fluorescence of nanoparticles (no avidin present) and (B) nanoaggregates (avidin present) over 6 minutes. (C) Impedance measurements displaying an increase in conductance over time when avidin is present in solution. Conditions: [nanoparticles]0 = 0.15 mg mL−1; [avidin]0 = 100 nM; magnitude of AC signal = −5 V; frequency = 1 MHz. | ||
Electrical detection of the collected nanoaggregates, e.g. by DEPIM, is much simpler to integrate into a sensing microsystem than fluorescence detection. Unfortunately, the insulating properties of the preliminary nanoparticle system, i.e. SiO2 and PEG, prevented any detectable electrical pathways from being generated. Therefore, the nanoparticles were additionally functionalized with ferrocene groups in order to increase their conductivity. Initial impedance experiments demonstrated a comparable increase in conductance for both the nanoparticles alone (no avidin) and nanoaggregates. It was concluded that oxidation of the neutral ferrocene groups to ferrocinium ions charged the surface of the particles to a significant extent. DEP will mobilize all charged species, thus eliminating the possibility of distinguishing between individual nanoparticles and nanoaggregates. To alleviate this problem, a mixture of nanoparticles functionalized with and without ferrocene groups were utilized. Various ratios were tried before arriving at an optimum formulation of a 1 ∶ 40 ratio of ferrocene labeled nanoparticles to non-ferrocene labeled nanoparticles. Larger amounts of ferrocene labeled nanoparticles yielded invalid control experiments while lesser amounts did not provide a significant impedance response. Fig. 5C displays a typical impedance change over time between two adjacent electrodes, obtained during DEP capture of nanoparticles. Nanoparticles without avidin cannot generate the large aggregates needed for efficient capture and building electrical bridges between electrodes. Hence, there is very little change in conductance for the control. When avidin is present in the nanoparticle solution, the resulting aggregates are captured and create electrical bridges that increase the conductance over time.
While the ligand/protein system of biotin and avidin provide excellent proof of principle, more noteworthy analytes are envisioned. For example, the conjugation of antibodies and proteins to the nanoparticle would allow for aggregation to be induced by either proteins, antibodies, or small molecules. Therefore, a series of systems were explored to exploit the versatility of this sensing mechanism.
First, aggregation of biotinylated CdS@SiO2 nanoparticles was induced with anti-Biotin IgG antibodies to demonstrate the ability to use antibodies. Next, avidin and anti-Biotin antibodies were independently conjugated to SiO2 nanoparticles. A water-soluble bis-biotin compound was prepared to serve as a small molecule analyte. Upon introduction of the small molecule analyte to a suspension of SiO2 particles conjugated with either avidin or anti-Biotin IgG antibodies, aggregation was induced.17 Although each system has not yet been tested in the DEPIM apparatus, it can be concluded that this method provides sufficient versatility to be applied to a variety of analytes.
A final point to be addressed is the ultimate sensitivity of this device. Preliminary DEPIM experiments employed analyte concentrations that were determined from dynamic light scattering (DLS) experiments to yield ideal aggregation conditions. In testing the ability for other analytes to induce aggregation, DLS results indicated that the analyte concentration needed to induce aggregation varied from system to system, ranging from as high as 300 nM to as low as 800 pM. Therefore, further testing is necessary in order to optimally apply this technique to different analytes.
In addition, the range of analyte concentration which can induce aggregation can be expanded. Initial DLS experiments that used 40 nm particles resulted in an analyte concentration range from 50 to 200 nM. By using formulations of particles of various sizes within the aggregation process,18 the analyte concentration range for DLS experiments was expanded to 10–500 nM.
One problem encountered with the preliminary system was the precipitation of large aggregates from solution. Therefore, PEG linkers of large molecular weight were prepared to improve the dispersability of larger aggregates. The kinetic growth mechanism was not altered, which allows for direct implementation of this improved system.19
Conclusions
Selective, biomolecule detection by the target mediated aggregation of nanoparticles was demonstrated using a model system of biotinylated nanoparticles and avidin. Formation of the aggregates within a microchannel of volume less than 100 nL was conclusively demonstrated in a laminated flow experiment. Aggregates were dielectrophoretically captured between thin film electrodes residing inside a microchannel and detected by both fluorescence microscopy and a change in interelectrode impedance. Further study is required to determine the detection limit capability of this system. Based on DLS analysis of different analyte systems and the utilization of nanoparticles of various sizes and longer PEG linkers, the formation of aggregates at picomolar concentrations is deemed plausible. It remains to be determined how few aggregates need to be formed in order to detect their presence by DEPIM. Smaller electrode spacing would require fewer aggregates to be formed for detection, and would also lower the detection limit. Finally, work is currently being completed to prepare nanoparticles with higher quantum yield photoemission than CdS@SiO2 nanoparticles, i.e. water-soluble CdSe.Acknowledgements
The authors thank Mike Dunlap (UCDavis) for his assistance with the electron microscopes, Dwight Howard (UCDavis) for his assistance with the set-up for the laminated flow experiment, and Professor Frank Osterloh (UCDavis) for help with the CV work. This work was supported by NSF (DMR-0306055, NEAT-IGERT DGE-9972741) and DARPA-BioFLIPS contract N66001-00-C-8091.References
- H. Pohl, Dielectrophoresis, Cambridge University Press, New York, 1978 Search PubMed.
- N. G. Green and H. Morgan, J. Phys. D: Appl. Phys., 1997, 30, 2626 CrossRef CAS.
- W. J. Parka, D. Gerion, D. Zanchet, A. S. Woerz, T. Pellegrino, C. Micheel, S. C. Williams, M. Seitz, R. E. Bruehl, Z. Bryant, C. Bustamante, C. R. Bertozzi and A. P. Alivisatos, Chem. Mater., 2002, 14, 2113 CrossRef CAS.
- H. Mattoussi, J. M. Mauro, E. R. Goldman, G. P. Anderson, V. C. Sundar, F. V. Mikulec and M. G. Bawendi, J. Am. Chem. Soc., 2000, 122, 12142 CrossRef CAS.
- D. Gerion, F. Pinaud, S. C. Williams, W. J. Parak, D. Zanchet, S. Weiss and A. P. Alivisatos, J. Phys. Chem. B, 2001, 105, 8861 CrossRef CAS.
- R. Chakrabarti and A. M. Klibanov, J. Am. Chem. Soc., 2003, 125, 12531 CrossRef CAS.
- M. Bruchez, M. Moronne, P. Gin, S. Weiss and A. P. Alivisatos, Science, 1998, 281, 2013 CrossRef CAS.
- C. K. Perruchot, M. A. Kahn, A. Kamitsi, S. P. Armes, T. von Werne and T. E. Patten, Langmuir, 2001, 17, 4479 CrossRef CAS.
- J. M. Singer and C. M. Plotz, Am. J. Med., 1956, 21, 888 CrossRef.
- P. J. Costanzo, T. E. Patten and T. A. P. Seery, Chem. Mater., 2004, 16, 1775 CrossRef CAS.
- J. Suehiro, R. Yatsunami, R. Hamada and M. Hara, J. Phys. D: Appl. Phys., 1999, 32, 2814 CrossRef CAS.
- J. Suehiro, R. Hamada and D. Noutomi, J. Electrostat., 2003, 57, 157 CrossRef.
- J. Suehiro, M. Shutou, T. Hatano and M. Hara, Sens. Actuators B, 2003, 96, 144 CrossRef.
- W. Bannwarth and R. Knorr, Tetrahedron Lett., 1991, 32, 1157 CrossRef CAS.
- E. Liang, D. Howard, E. S. Lee, Y. Zhou, S. D. Collins and R. L. Smith, Sens. Actuators B, submitted Search PubMed.
- R. Frantz, J.-O. Durand and G. F. Lanneau, J. Organomet. Chem., 2004, 689, 1867 CrossRef CAS.
- P. J. Costanzo, T. E. Patten and T. A. P. Seery, Polym. Prepr., 2004, 45, 742 CAS.
- P. J. Costanzo, T. E. Patten and T. A. P. Seery, manuscript in preparation.
- P. J. Costanzo, N. Dan and T. E. Patten, manuscript in preparation.
Footnote |
| † These authors contributed equally to the paper. |
| This journal is © The Royal Society of Chemistry 2005 |