Vapor swellable colloidal photonic crystals with pressure tunability†
André C.
Arsenault
a,
Vladimir
Kitaev
a,
Ian
Manners
a,
Geoffrey A.
Ozin
*a,
Agustín
Mihi
b and
Hernán
Míguez
b
aPolymer and Materials Chemistry Research Groups, University of Toronto, 80 St. George Street, Toronto, Canada M5S 3H6. E-mail: gozin@chem.utoronto.ca
bCentro de Tecnología Nanofotónica, Edificio I-4, Universidad Politécnica de Valencia, Camino de Vera s/n, 46022 Valencia, Spain
First published on 17th November 2004
Abstract
Polyferrocenylsilane gel photonic crystals have been reversibly swollen using solvent vapors, and exhibit precise pressure tunability over a wavelength range of greater than 100 nm.
Introduction
Photonic crystals are an exciting new class of materials, which interact with electromagnetic radiation through a periodic spatial modulation in their refractive index.1,2 When the scale of this modulation coincides with the scale of the radiation wavelength certain frequency ranges cannot propagate through the crystal due to coherent scattering. To fabricate a material periodically structured on the scale of light is a challenge. Self-assembly of monodisperse microspheres into colloidal crystals has emerged as an experimentally straighforward contender for this purpose,3 since self-assembly is well suited to the construction of periodic arrays.4 Spheres of many compositions are available commercially or by established synthetic protocols,5 and these can be assembled in a variety of ways to form colloidal crystal monoliths, supported films,6 or surface patterns.7 In addition, there is a growing set of reproducible methods for the infiltration of these crystals with a wide range of materials, providing composite colloidal crystals, or so-called “inverse opals” if the template spheres can be etched away selectively.8Templating strategies for making colloidal-based photonic crystals have had much success and research has focused to an increasing extent on functional systems. Particularly interesting are dynamically tunable colloidal photonic crystals, those that are responsive in some way to their environment or an applied stimulus.9 If the stimulus can be intentionally applied in a controlled fashion, the colloidal photonic crystal becomes an optical element with transmission or reflectance features tunable across any given wavelength range. Conversely, if the stimulus applied to the material is an analyte, these materials can be used as sensors with an optically recorded or user-friendly color-based readout. Seminal studies on the use of swellable polymers in photonic crystals have been made by Asher and coworkers.10,11 Their diffractive system consists of highly charged microspheres assembled in a rigorously deionized medium into which are incorporated polyacrylate hydrogel precursors, such that the whole structure can be frozen in place through polymerization. These polymerized colloidal crystalline arrays can swell in a liquid, and take advantage of the swelling properties of the polyacrylates or incorporated chemical receptors. Increases or decreases in swelling are manifested as an expansion or contraction of the crystalline lattice, respectively, leading to red or blue shifts of the main Bragg diffraction peak.
In this report we demonstrate vapor-pressure tunable, planar polymer-gel colloidal photonic crystals, which can increase or decrease their refractive indices and lattice constants through sorption of a gas-phase solvent. These materials display a well-defined Bragg diffraction peak that shifts in shape and position in response to organic vapors at different vapor pressures, through simple condensation and condensation–swelling processes. The materials respond in a highly reproducible and cyclable fashion, making them potentially useful as reliable vapor-tunable optical filters and sensors for vapors. The entire optical spectral profiles obtained during vapor swelling were fitted to theory using a scalar wave approximation method, allowing us to accurately correlate optical features to structural changes in the material. Such an understanding, along with reversibility, is essential for implementation of the material in optical devices. Photonic stop-band and Fabry–Perot oscillation position, width, and shape were quantitatively explained based on refractive index contrasts, anisotropic lattice constant expansions, volume filling fractions, and substrate and superstrate effects. We provide a novel, convenient and potentially general method for forming these composite colloidal photonic crystals as a high quality optical coating without a thick polymer overcoating. This is important both for understanding of the swelling behavior as well as increasing the mechanical stability of samples upon repeated cycling.
We have recently developed a material, dubbed Photonic Ink (P-Ink),12 that may enable a variety of optical functions from a common material platform. This material consists of an array of silica spheres embedded in a matrix of lightly crosslinked polyferrocenylsilane, produced as a planar coating for ease of integration into optical devices. The degree of swelling of the metallopolymer was found to be dependent on the solvent and the oxidation state of the metals in its backbone, providing a material whose structural color can be tuned by either chemical or electrochemical means. Based on these studies, the polymer gel we chose for this study consisted of a polyferrocenylsilane (PFS) crosslinked network. PFS is a metallopolymer, built of alternating substituted silicon atoms and ferrocene groups comprising the polymer backbone. Thermal treatment of bridged sila-[1]-ferrocenophanes results in the release of ring strain through ring-opening polymerization,13 affording linear polymer or a crosslinked polymer network if a difunctional monomer such as sila(cyclobutyl)-[1]-ferrocenophane is used.14 In this work a mixture of a methylethyl substituted sila-[1]-ferrocenophane15 and the sila(cyclobutyl) substituted crosslinker were used to obtain a lightly crosslinked, responsive metallopolymer gel. These are hereby referred to as monomer and crosslinker, respectively, and are shown in Scheme 1.
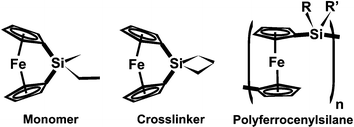 | ||
| Scheme 1 | ||
Experimental
All chemicals were obtained from Aldrich and used as received unless otherwise stated. All manipulations involving the monomers described herein and their precursors were performed using standard Schlenk techniques, or in a nitrogen-filled glovebox (Mbraun) containing <1 ppm of both oxygen and water vapor. No special precautions were needed, however, once the monomers had been polymerized.Self-assembly of oriented silica microsphere multilayers
Monodisperse silica spheres were prepared by the controlled hydrolysis of tetraethyl orthosilicate according to the Stöber method.16 Planar silica colloidal crystals were fabricated using the previously published evaporative deposition method,17 which results in an essentially single-crystal colloidal crystal film of controlled thickness with a lateral area of ∼2 cm2. For the growth of colloidal crystals on ITO-coated glass slides, 0.1 mL of diisopropylethylamine was added to a 15 mL ethanol suspension of microspheres before crystal growth. This step was found to substantially increase the thickness of films deposited on these substrates.Monomer synthesis
The synthesis of monomers was performed using previously published protocols.14,15 Briefly 1,1′-dilithioferrocene, synthesized from ferrocene and n-butyl lithium with N,N,N′N′-tetramethylethylenediamine as catalyst, was treated with a 1.3 molar excess of ethylmethyldichlorosilane or silacyclobutyldichlorosilane (chlorosilanes obtained from Gelest) in dry diethyl ether to give, respectively, crude ethylmethylsila-[1]-ferrocenophane (monomer) and silacyclobutylsila-[1]-ferrocenophane (crosslinker). Crude products were crystallized from dry hexanes, and pure monomers were obtained following two crystallization/sublimation cycles.Fabrication of silica–PFS network photonic crystal composites
For the fabrication of composite copper coated substrates used in the melt-infiltration step, a glass slide was cleaned in an oxygen plasma for 30 minutes then was coated with a thin film of PDMS prepolymer (Sylgard 184 PDMS kit obtained from Corning) by casting against a fluorinated silicon wafer (obtained from WaferWorld Inc., and treated with gas-phase 1,1,2,2-tetrahydroperfluorooctyl trichlorosilane) using 0.15 mm thick microslip spacers. Following curing at 60 °C overnight, the silicon wafer was separated, and the PDMS-coated side of the glass slide Ar-ion sputtered with 100 nm Cu.Prior to monomer infiltration, the silica colloidal crystal films were treated with oxygen plasma for 5 minutes, then oven-dried at 90 °C for 30 minutes. The film was then taken into a nitrogen-filled glovebox, where it was treated with a solution of crosslinker in dichloromethane (approximately 10 mg mL−1) for 20 minutes, followed by washing thoroughly in dichloromethane. This creates a monolayer of polymerizable groups on the sphere and substrate surfaces.18 Once dry, the film was placed on a hot plate equilibrated at 110 °C, and after 5 minutes about 20 mg of a solid mixture of 90 wt% monomer and 10 wt% crosslinker (evaporated from a solution in dichloromethane and placed under vacuum for 2 hours) was dropped onto the film and allowed to melt. Prior to this step, the copper-coated composite substrate had been placed on the hot plate as well, and allowed to equilibrate for 5 minutes. Approximately 5 seconds after the monomers had melted, the copper-coated slide was placed face-down against the molten monomer droplet, and light pressure (applied with hand-held tweezers) was applied to squeeze out excess molten monomers. The sample was then removed from the hot plate, allowed to cool for 5 minutes, then bound together with binder clips. The assembly was then placed in a Schlenk tube and polymerized at 180 °C for 12 under nitrogen. Following polymerization, the glass slides were separated by sliding a scalpel blade between them, resulting in the clean removal of the PDMS-coated glass top slide and leaving a copper coating on the composite colloidal crystal film. The copper was then etched for 5–10 minutes in an aqueous solution of FeCl3 (0.2 g) and NH4Cl (3.5 g) in 150 mL water.
Electron microscopy
SEM measurements were performed on a Hitachi S-5200 scanning electron microscope operating at 1 kV, imaging the cross-section perpendicular to the electron beam. No conductive coating was applied to the sample prior to imaging.Optical characterization
In order to record the optical spectra of the sample under different pressures, we used a custom-built apparatus consisting of an open top 5 × 10 × 20 cm optical cell (Helma), which was epoxied to a main chamber made of glass. To the main chamber was fitted a vacuum gauge, and a glass arm with two stopcocks in series with a small volume between them. This volume could be filled with solvent vapor, sealed off, then opened to the main chamber in order to increase the solvent vapor pressure. Conversely, the small volume could be evacuated under vacuum and opening it to the main chamber resulted in a lowering of solvent vapor pressure to which the sample was exposed. Optical spectra were taken with a Fourier transform microspectrometer Bruker IF 66/S in the range of 500 to 1100 nm, adjusting the focus by raising or lowering the cell with an external height control.Results and discussion
Sample preparation
The procedure used to fabricate the samples used in this study is shown schematically in Fig. 1. In this synthesis, a copper-coated PDMS layer is used to squeeze out any excess molten monomer from the top of the film. The PDMS serves as a compliant layer, which reduces the deleterious effects of dust or other particulates, and allows the copper coating to press down against the top layer of spheres. Following polymerization the two glass slides are separated, leaving an easily etched copper film19 adhered to the metallopolymer filled colloidal crystal. This thermal transfer of copper is analogous to the transfer printing of metal films using interfacial chemistries,20 but in this case the adhesion used is physical rather than chemical. A cross-sectional SEM of a sample is shown in Fig. 2, illustrating the homogeneous filling and an absence of a significant polymer overlayer. As seen in the figure, the polymer overcoating is well below a sphere diameter, which minimizes optical scattering and absorption losses.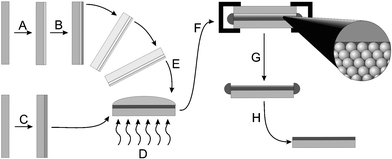 | ||
| Fig. 1 Schematic of material synthesis. A. Coating of glass microslide with 0.15 mm PDMS layer. B. Sputtering of 100 nm Cu onto PDMS. C. Evaporative deposition of thin colloidal crystal film onto glass microslide, followed by surface anchoring of polymerizable monolayer. D. Melt infiltration of crosslinked polymer precursors at approximately 110 °C. E. Application of Cu-coated substrate onto melt-infiltrated opal. F. Binding of assembly with binder clips, thermal polymerization at 180 °C under N2. G. Removal of PDMS-coated glass. H. Etching of copper in FeCl3–NH4Cl bath, removal of excess polymer on sides of sample. | ||
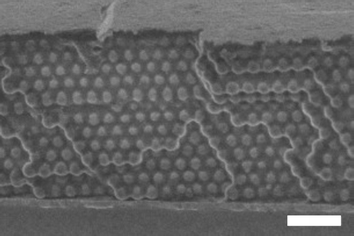 | ||
| Fig. 2 Cross-sectional scanning electron micrograph of a silica–PFS composite colloidal crystal film. Note the homogeneous infiltration as well as the smooth top surface free of significant polymer overlayer. White scale bar represents 1 μm. | ||
Optical characterization of vapor swelling
The measurement of the optical response of the materials to solvent vapor was performed in a specially designed optical cell. This cell allowed for controlled addition or removal of solvent vapor from the sample chamber, thereby the ability to expose the sample to any given solvent vapor pressure. For each incremental increase or decrease in vapor pressure, a spectrum was taken immediately after the pressure equilibrated. Spectra taken at longer times after pressure equilibration were identical to those taken immediately, confirming that the sample reaches equilibrium within one second. Previous studies on these types of materials also confirm their sub-second response time.12 A portion of the experimental plots for increasing pressures of dichloromethane vapor is shown in Fig. 3A. These measurements have been repeated several times, and the materials were found to display highly reproducible changes in the optical spectra upon cycling between vacuum and a saturated solvent vapor atmosphere. As can be seen, the samples are of very high optical quality, with well-defined stop bands as well as side-lobes arising from crystal finite size effects. Along with peak position, peak widths also change in a controlled fashion, as shown by a gap to mid-gap ratio versus pressure plot (see electronic supplementary information†). There are several factors giving rise to the position, shape, and intensity of experimentally observed features: The average refractive index of the composite colloidal crystal, refractive index contrast inside the crystal, as well as interference from a thin excess polymer layer superstrate and a thin ITO layer on the substrate.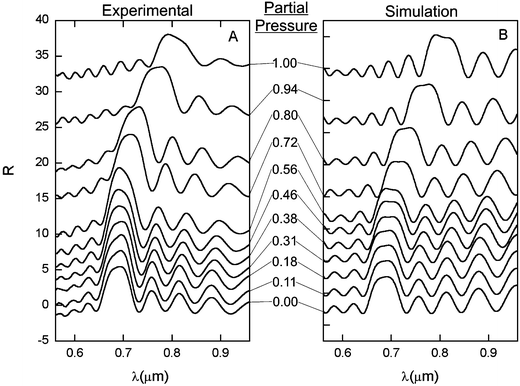 | ||
| Fig. 3 (A) Experimental spectra for the swelling of samples in increasing dichloromethane solvent vapor pressure. (B) Theoretically fitted curves for the experimental spectra in A. | ||
Optical analysis
To understand the effect of vapor sorption in these materials, we have analyzed experimental results using a theoretical model based on a scalar wave approximation.21 This method is appropriate and precise for describing the transmittance and reflectance of lower energy photonic bands in finite size photonic crystals such as the ones we investigate here.22–24 By simulation of the spectrum obtained under vacuum, we can estimate the porosity of the polymer inside the opal void spaces, determined to be approximately 50%. The volume of the pore space is estimated from the fittings, assuming a refractive index of 1.6 for PFS.25 During melt infiltration of the molten monomer mixture, the pores in the colloidal crystal will be completely filled with the melt due to capillary forces. The high polymerization temperatures have a number of effects: any volatiles escaping the polymerization mixture (solvent, monomer) create voids in the polymer, and the thermal contraction and monomer-to-polymer contraction both contribute to the apparent porosity. In addition, any soluble material not bound to the polymer network is removed in the post-synthesis washing step. Since the polymer is synthesized in the interstices of a stabilizing array of silica spheres, these various stresses do not cause cracking or delamination of the colloidal crystal film. We could also estimate a thickness for the polymer overlayer of 50 nm, as well as a 153 nm thickness of ITO for this sample (value from the supplier).We then simulated the remainder of the experimental spectra by considering incrementally greater amounts of solvent incorporated into the polymer network. The first step of this process is the swelling of the polymer resulting in the closing of the pores within it. After this, any further solvent absorption causes an increase in polymer gel volume in both the colloidal crystal, causing an increase in lattice constant, and the polymer superstrate. A very interesting feature of this system is the inherent structural anisotropicity due to a covalent binding to a planar substrate. Because one side of the film is pinned through chemical anchoring to the immobile substrate, swelling occurs entirely in the direction perpendicular to it. Based on the fittings of all experimental curves, we obtained plots of the lattice constant and degree of swelling anisotropicity of the polymer network versus solvent vapor pressure. Models evaluated were isotropic, partly anisotropic, and fully anisotropic, and only the latter was able to fully reproduce the experimentally observed optical features. These results for swelling by dichloromethane are shown in Fig. 4.
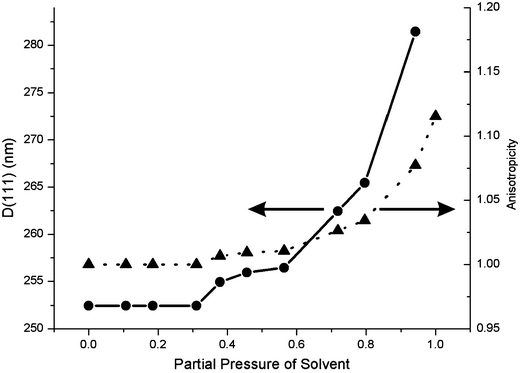 | ||
| Fig. 4 Plot showing how the lattice constant perpendicular to the substrate (D(111)) changes with increasing partial pressure of dichloromethane vapor (circles). Also shown is the anisotropicity, which is the ratio of the lattice constant perpendicular to the substrate and the lattice constant parallel to the substrate (triangles). | ||
While dichloromethane swells the polymer to increase the lattice spacing, hexane is not a sufficiently good solvent for the polymer and simply sorbs into the pores in the network. Both types of phenomena can be accurately monitored. In Fig. 5 we show the experimental results for the swelling and deswelling of these samples in dichloromethane and hexane vapors for two complete swelling–deswelling cycles. As can be seen the shift in peak position is highly reproducible: several cycles can be performed with no degradation or change in optical properties. Only a small hysteresis is observed in the case of dichloromethane at the high vapor pressure region, while no hysteresis is observed for hexane. While the stop band of the material may be at the same position for a high pressure of hexane vs. a low pressure of dichloromethane, there are further differences allowing us to distinguish them. The width, intensity, and shape of the peaks are quite different, and these factors are all taken into account in our theoretical model.
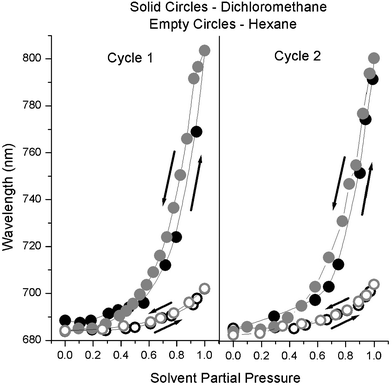 | ||
| Fig. 5 Experimental results showing the position of the Bragg diffraction peak of the swellable thin film colloidal photonic crystals when exposed to two cycles of increasing and decreasing pressures of organic solvents. Data collected upon increasing the vapor pressure are shown in black, while decreasing pressure data are shown in gray. A good solvent, dichloromethane, is shown as solid circles, while a poor solvent, hexane, is shown as empty circles. The mean peak position is plotted relative to the solvent partial pressure, showing very little hysteresis in the sorption–desorption behavior and reversible swelling behavior. | ||
As is apparent from Fig. 5, there seems to be a threshold for the vapor pressure to start swelling the polymer. At a very low partial pressure of solvent, it is thermodynamically unfavorable to swell the polymer since the concentration in the gas phase is so low. Still in this range there is a minute red shift in the photonic stop band, but it is overshadowed by the larger shifts when the solvents start swelling the polymer.
It is worth noting that other researchers have observed spectral shifts of diffracting structures in response to solvent vapor pressure, but these suffer deficiencies in optical quality as well as response range making them unsuitable for device applications. One-dimensional Bragg stacks made by the anodic etching of silicon with a sinusoidal voltage profile showed a shift in the Bragg peak within a very small pressure range corresponding to capillary condensation of condensable vapors.26 Colloidal crystals made of core–shell particles also showed the shifting of a broad Bragg peak upon exposure to toluene vapor, but above a certain pressure the samples underwent an irreversible rearrangement.27
Conclusion
In summary, we have disclosed here a reproducible method for the synthesis of planarized colloidal photonic crystals composed of a silica microsphere array embedded in a self-limiting thickness of metallopolymer gel. Upon exposure to solvent vapor, the samples were found to undergo highly reproducible and repeatable changes in optical spectra due to swelling of the polymer by vapor uptake. This swelling both changes the refractive index of the polymer network as well as causing an increase in the lattice spacing of the photonic crystal at higher vapor pressures. Theoretical fitting of the entire profile of the experimental spectra allowed us to understand explicitly the changes occurring to the material upon solvent sorption at different vapor pressures, making these samples appropriate for selective sensing of organic vapors. Furthermore, by encapsulating these samples in a cell where the solvent pressure can be changed by a controlled stimulus, compression or temperature for instance, the materials can provide reliable optical switching through pressure actuation.Acknowledgements
G. A. O. and I. M. are Government of Canada Research Chairs in Materials and Polymer Chemistry. They thank NSERC Canada and the University of Toronto for support of their research. H. M. thanks the Spanish Ministry of Science and Technology for a Ramón y Cajal fellowship, as well as Generalitat Valenciana for financial support under project CTDIA/2002/29 and Universidad Politécnica de Valencia. A. A. thanks NSERC for financial supportReferences
- E. Yablonovitch, Phys. Rev. Lett., 1987, 58, 2059 CrossRef CAS.
- S. John, Phys. Rev. Lett., 1987, 58, 2486 CrossRef CAS.
- Y. N. Xia, B. Gates and Z. Y. Li, Adv. Mater., 2001, 13, 409 CrossRef CAS.
- G. M. Whitesides and M. Boncheva, Proc. Natl. Acad. Sci. USA, 2002, 99, 4769 CrossRef CAS.
- P. C. Hiemenz and R. Rajagopalan, Principles of Colloid and Surface Chemistry, Marcel Dekker, New York, 1997 Search PubMed.
- V. L. Colvin, MRS Bull., 2001, 26, 637 CAS.
- S. M. Yang, H. Míguez and G. A. Ozin, Adv. Funct. Mater., 2002, 12, 425 CrossRef CAS.
- B. T. Holland, C. Blanford and A. Stein, Science, 1998, 291, 538 CrossRef CAS.
- K. Busch and S. John, NATO ASI Ser., Ser. C: Math, Phys. Sci., 2001, 563, 41 Search PubMed.
- J. M. Weissman, H. B. Sunkara, A. S. Tse and S. A. Asher, Science, 1995, 274, 959 CrossRef CAS.
- J. H. Holtz and S. A. Asher, Nature, 1997, 389, 829 CrossRef CAS.
- A. Arsenault, H. Míguez, V. Kitaev, G. A. Ozin and I. Manners, Adv. Mater., 2003, 15, 503 CrossRef CAS.
- D. A. Foucher, B. Z. Tang and I. Manners, J. Am. Chem. Soc., 1992, 114, 6246 CrossRef CAS.
- M. J. MacLachlan, A. J. Lough and I. Manners, Macromolecules, 1996, 29, 8562 CrossRef CAS.
- K. Temple, J. A. Massey, Z. Chen, N. Vaidya, A. Berenbaum, M. D. Foster and I. Manners, J. Inorg. Organomet. Polym., 1999, 9, 189 CrossRef CAS.
- W. Stöber, A. Fink and E. J. Bohn, J. Colloid Interface Sci., 1968, 26, 62 CrossRef.
- P. Jiang, J. F. Bertone, K. S. Hwang and V. L. Colvin, Chem. Mater., 1999, 11, 2132 CrossRef CAS.
- M. J. MacLachlan, P. Aroca, N. Coombs, I. Manners and G. A. Ozin, Adv. Mater., 1998, 10, 144 CrossRef CAS.
- Y. N. Xia, E. Kim, M. Mrksich and G. M. Whitesides, Chem. Mater., 1996, 8, 601 CrossRef CAS.
- Y. L. Loo, R. L. Willett, K. W. Baldwin and J. A. Rogers, J. Am. Chem. Soc., 2002, 124, 7654 CrossRef CAS.
- K. W.-K. Shung and Y. C. Tsai, Phys. Rev. B, 1993, 48, 11265 CrossRef.
- I. I. Tarhan and G. H. Watson, Phys. Rev. B, 1996, 54, 7593 CrossRef CAS.
- J. F. Bertone, P. Jiang, K. S. Hwang, D. M. Mittleman and V. L. Colvin, Phys. Rev. Lett., 1999, 83, 300 CrossRef CAS.
- H. Miguez, S.-M. Yang and G. A. Ozin, Appl. Phys. Lett., 2002, 81, 2483.
- C. Paquet, P. W. Cyr, E. Kumacheva and I. Manners, Chem. Commun., 2004, 234 RSC.
- Y. Y. Li, F. Cunin, J. R. Link, T. Gao, R. E. Betts, S. H. Reiver, V. Chin, S. N. Bhatia and M. J. Sailor, Science, 2003, 299, 2045 CrossRef CAS.
- A. Rugge, W. T. Ford and S. H. Tolbert, Langmuir, 2003, 19, 7852 CrossRef CAS.
Footnote |
| † Electronic supplementary information (ESI) available: plot of the gap-to-midgap ratio of the first Bragg diffraction peak vs. pressure for one of the pressure-sensitive colloidal photonic crystals. See http://www.rsc.org/suppdata/jm/b4/b410284n/ |
| This journal is © The Royal Society of Chemistry 2005 |
