Gold nanoparticle-based competitive colorimetric assay for detection of protein–protein interactions†
Charng-Sheng
Tsai
,
Ting-Bin
Yu
and
Chao-Tsen
Chen
*
Department of Chemistry, National Taiwan University, Taipei, Taiwan. E-mail: chenct@ntu.edu.tw; Fax: 886 2 23636359; Tel: 886 2 23645819
First published on 28th July 2005
Abstract
A gold nanoparticle-based competitive colorimetric assay uses the ensemble of Concanavalin (ConA) and mannopyranoside-encapsulated gold nanoparticles (Man-GNPs) to identify the binding partners for ConA and the binding constants are determined based on the wavelength shifts.
Protein–protein interactions play key roles in structural and functional organization of living cells. A variety of techniques have been developed for the investigation of these interactions including protein microarrays, two-hybrid analysis, immunoassays, mass spectrometric analysis by affinity capture, fluorescence spectroscopy, and calorimetry.1 However, development of facile and sensitive identification of protein–protein interactions, especially in high-throughput, is still one of the most challenging as well as important tasks in proteomics research.2
Gold nanoparticles (GNPs) smaller than 60 nm have extremely high extinction coefficients at ∼520 nm.3 Moreover, different agglomeration states of GNPs can result in distinctive color changes. These extraordinary optical features make GNPs an ideal color reporting group for signaling molecular recognition events and render the nanomolar concentration detection possible.4 While elegant biosensor designs utilizing these concepts, such as DNA-functionalized GNPs for colorimetric detection of DNA5 and Pb(II)6 as well as carbohydrate-modified GNPs for selectively sensing lectins,7 have been demonstrated, it is desirable to expand this rather facile/sensitive detection methodology to new applications. In this communication we would like to describe an adequate technique based on the cognate substrate-modified gold nanoparticles, namely gold nanoparticle-based competitive colorimetric assay, for sensitive and expedient detection of protein–protein interactions in solution. Direct visualization without the need for protein labeling or the aid of instruments is possible.
A detection scheme for protein–protein interactions is illustrated in Fig. 1. A protein, denoted by X, binds the ligands protruding from the GNP surface and promotes agglomeration of the particles via multivalent ligand–protein interactions giving rise to a blue colored solution (Fig. 1b). However, the addition of a putative protein, denoted by Y, capable of interacting with protein X, could influence the binding between X and GNPs. It is therefore possible to undo the agglomeration of GNPs and cause the dissipation of GNPs. As a result, the color of the solution can change from blue to the original burgundy color (Fig. 1c)

Lectins are carbohydrate-binding proteins and most of them are multivalent and capable of agglutinating cells. Interaction of cellular proteoglycans, glycoproteins and glycolipids with carbohydrate-binding proteins is involved in a number of important biological processes.8 Accordingly, we have exploited concanavalin (ConA) and mannose modified-GNP (Man-GNP) to demonstrate proof-of-concept of the methodology. Thyroglobulin, a glycoprotein known to bind ConA strongly,9 was selected to verify the mode of sensing. Six lectins along with three other proteins10 were tested for their capability of interacting with ConA.
The Man-GNP used in the present work comprised a thiol appended mannose ligand attached to 32-nm-diameter gold nanoparticles.11 The Man-GNPs in 0.01% aqueous sodium citrate solution showed an absorption band with λmax at 528 nm and displayed the largest red-shifts and the most pronounced change of absorption intensity in the presence of ConA, whereas there was no appreciable absorption change upon the addition of other proteins (see ESI†), indicating Man-GNPs specific binding to ConA. The spectral changes are attributed to a severe aggregation of GNPs mediated by ConA.12

We next evaluated the possibility of using the preformed Man-GNPs/ConA complex for a competitive colorimetric assay. Among 10 proteins considered herein, four proteins i.e. thyroglobulin, BS-I, SBA, and MAL are found to have very drastic effects on the absorption spectrum of Man-GNPs/ConA compared to the remaining proteins tested. For these proteins, the wavelength was blue-shifted and the absorption intensity increased. The color changed from blue to burgundy indicating these four proteins were able to compete with Man-GNPs binding to ConA and disrupt agglomeration of the particles. In fact, the color change can be easily detected by the naked eye within 2 min and the detection limit can be as low as 5 nM. When the sequential addition order of Man-GNPs was changed so that ConA first mixed with these four proteins followed by the addition of Man-GNPs, the color of Man-GNPs remained burgundy. The result indicates that the presence of a binding partner prevents ConA from cross-linking Man-GNPs (Fig. 2).
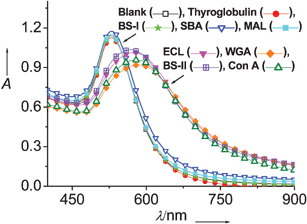 | ||
| Fig. 2 Overlaid absorption spectra of Man-GNPs (0.29 nM) in the presence of the premixed ConA and tested proteins. The spectra of RNaseA, trypsin inhibitor, and BSA were similar to the one displayed by ECL, and thus omitted for clarity. | ||
In accordance with our expectation, thyroglobulin disrupts the agglomeration of the particles giving rise to a burgundy color. We demonstrate that BS-I, SBA, and MAL are capable of interacting with ConA for the first time. To provide further support for this result, we examined the interactions by SDS-PAGE. The GNPs can penetrate a gel under the correct conditions and the proteins that entered the gel were separated as shown in Fig. 3. Two bands are evidenced in lanes 3, 4, and 5, respectively, and the color of the corresponding solutions is burgundy. In contrast, only one band corresponding to ConA is observed in lanes 6, 7, and 8 and the color of the solutions is blue. The results demonstrated that the tested proteins-BS-I, SBA, and MAL interacted with ConA, which is consistent with spectroscopic studies.
 | ||
| Fig. 3 12% SDS-PAGE used to identify the existence of interactions between ConA and various proteins. Lane 1: protein markers; Lane 2: ConA alone; Lane 3: ConA + BS-I; Lane 4: ConA + SBA; Lane 5: ConA + MAL; Lane 6: ConA + ECL; Lane 7: ConA + WGA; Lane 8: ConA + BS-II. The inset shows the photoimages of the corresponding solutions for each lane. Thyroglobulin was not used in SDS-PAGE due to its rather large molecular weight (∼670 kDa). | ||
To further validate some aspects of the data, matrix-assisted laser desorption ionization-time of flight-MS was employed to analyze the components of biomolecules adsorbed on the Man-GNPs.13 The mass traces (see ESI†) clearly provided evidence for the formation of a ConA and BS-I complex. This result along with the gel analysis allows us to confirm that the protein–protein interactions can indeed be evaluated by direct color visualization of the surface plasmon change.
The new technology that we have developed here provides not only qualitative but also quantitative evaluation of protein–protein interactions. Fig. 4a shows representative UV-vis spectra of ConA (98 nM) with various concentrations of BS-I in the presence of a constant concentration of Man-GNP. A clear color progression from blue to purple to burgundy with increasing concentrations of BS-I can be observed since disruption of the cross-linked particles is induced by ConA/BS-I interaction influencing the interactions between ConA and Man-GNP. The extent of particle dissipation, in terms of wavelength changes at maximum absorption, is proportional to the BS-I concentration added and leveled off once the concentration of BS-I reaches 49 nM; half of the concentration of ConA used in the study. It indicates the stoichiometry for the binding of BS-I to ConA as 1 : 2 (Fig. 4b). Job's plot also confirms the stoichiometry and the Hill plot further shows that the binding is cooperative with Hill's coefficient close to 1.8 (see ESI†).14 Based on the wavelength changes, the binding constant of ConA/BS-I is calculated to be 1.5 × 10¹⁵ by a nonlinear regression curve fitting program (see ESI†). The rather large binding constant is not surprising if the large surface area of proteins possible for interactions and the 1 : 2 stoichiometry for the binding of BS-I to ConA are taken into account.
 | ||
| Fig. 4 (a) Surface plasmon bands of Man-GNPs (0.29 nM) after the addition of different ratios of ConA and BS-I: Man-GNP alone (△); BS-I 10 µg mL−1 (●); ConA 10 µg mL−1 + BS-I 10 µg mL−1 (1 : 1 wt/wt) (♦); ConA 10 µg mL−1 + BS-I 5 µg mL−1 (2 : 1 wt/wt) (□); ConA 10 µg mL−1 + BS-I 2.5 µg mL−1 (4 : 1 wt/wt) (■); and ConA 10 µg mL−1 (*). (b) Absorption wavelength changes (Δλ) relative to 528 nm is plotted as a function of BS-I concentrations (0, 9, 22, 31, 44, 66, 88, 132 nM). | ||
An independent determination of the binding constant between ConA and BS-I was obtained from Biacore surface plasmon resonance (SPR) biosensor.15 ConA was immobilized to a CM5 sensor chip through amine coupling and BS-I solution was injected over the immobilized Con A. The resultant SPR sensorgrams are shown in Fig. 5. As the concentration of BS-I increases, the response is proportionally increased. The binding constant assuming 1 : 1 stoichiometry determined from SPR data is 1.9 × 10⁶, which is weaker than that determined by the Man-GNPs methodology. The disparity in the binding magnitude can be largely attributed to the intrinsic nature of these two methodologies. In the case of the SPR measurement, immobilizing one of the interacting proteins on the chip blocks one side of the proteins. As a result, only one side of the proteins is exposed for interacting with the binding partners. In contrast, proteins of interest can interact with each other in any direction in the case of the Man-GNP system and the local density of ConA is probably higher than it is on the CM5 sensor chip, rendering 1 : 2 binding possible. It is reasonable that the cooperative binding strength of divalent (1 : 2) binding is much greater than monovalent (1 : 1) binding. The concentration of BS-I used in these studies also reflects the binding strength. Only nanomolar quantities of BS-I were required to influence the Man-GNP absorbance, whereas micromolar amounts of BS-I were needed in the Biacore studies.
 | ||
| Fig. 5 (a) SPR sensorgrams for binding of BS-I to the immobilized ConA in PBS buffer at 25 °C. (b) The change in the response signal is plotted against the concentration of BS-I. | ||
We have shown convincingly that protein–protein interactions can be evaluated qualitatively as well as quantitatively by using gold nanoparticle-based competitive colorimetric assays. The methodology does not require any special protein modifications and is very sensitive; only nanomolar concentrations of proteins are required. Moreover, color changes are conspicuous and readily perceived by the naked eye. There is also no need to use analytical instruments or labeled lectins. By using this expedient methodology, a broad range of proteins can be rapidly evaluated for their abilities to interact with the protein of interest in real time. The method is easily generalized for studying other protein–protein interactions simply by capping GNPs with corresponding cognate substrates, rendering high-throughput screening of protein–protein interactions possible. It should also be straightforward to use this methodology to screen molecular libraries containing potential drugs to disrupt cell–cell adhesion mediated by lectins. Further work in this direction and the application of this colorimetric assay in proteomic analysis are underway.
The authors gratefully acknowledge the National Science Council and Ministry of Education, Taiwan for financial support and Prof. Sunney Chan for suggestions.
Notes and references
- Y. C. Cao, R. Jin, J.-M. C. Nam, S. Thaxton and C. A. Mirkin, J. Am. Chem. Soc., 2003, 125, 14676–14677 CrossRef CAS and references therein; J. R. Newman and A. E. Keating, Science, 2003, 300, 2097–2101 Search PubMed; T. Ito, T. Chiba, R. Ozawa, M. Yoshida, M. Hattori and Y. Sakaki, Proc. Natl. Acad. Sci. USA, 2001, 98, 4569–4574 CrossRef CAS; J. R. Birch and E. S. Lennox, Monoclonal Antibodies: Principles and Applications, Wiley, New York, 1995 CrossRef CAS; J. H. Lakey and E. M. Raggettt, Curr. Opin. Struct. Biol., 1998, 8, 119–123 CrossRef CAS.
- I. Remy and S. W. Michnick, Proc. Natl. Acad. Sci. USA, 1999, 96, 5394–5399 CrossRef CAS.
- ε520 for 13-nm and 50-nm diameter gold nanoparticles are 2.7 × 10⁸ and 1.5 × 10¹⁰ M−1 cm−1, respectively. For details see R. Jin, G. Wu, Z. Li, C. A. Mirkin and G. C. Schatz, J. Am. Chem. Soc., 2003, 125, 1643–1654 Search PubMed.
- C. M. Niemeyer, Angew. Chem., Int. Ed., 2001, 40, 4128–4158 CrossRef CAS.
- R. Elghanian, J. J. Storhoff, R. C. Mucic, R. L. Letsinger and C. A. Mirkin, Science, 1997, 277, 1078–1081 CrossRef CAS.
- J. Liu and Y. Lu, J. Am. Chem. Soc., 2004, 126, 12298–12305 CrossRef CAS.
- H. Otsuka, Y. Akiyama, Y. Nagasaki and K. Kataoka, J. Am. Chem. Soc., 2001, 123, 8226–8230 CrossRef CAS; D. C. Hone, A. H. Haines and D. Russell, Langmuir, 2003, 19, 7141–7144 CrossRef CAS; A. J. M. de la Fuente, A. G. Barrientos, T. C. Rojas, J. Rojo, J. Caňada, A. Fernámdez and S. Penadés, Angew. Chem., Int. Ed., 2001, 40, 2258–2260 CrossRef.
- H. Lis and N. Sharon, Chem. Rev., 1998, 98, 637–674 CrossRef CAS; M. Mammen, S.-K. Choi and G. M. Whitesides, Angew. Chem., Int. Ed., 1998, 37, 2754–2794 CrossRef.
- J. T. Dulaney, Anal. Biochem., 1979, 99, 254–267 CrossRef CAS.
- Six lectins are bandeiraea simplicifolia lectin I (BS-I), soybean agglutinin (SBA), maackia amurensis (MAL), erythrina cristagalli lectin (ECL), wheat germ agglutinin (WGA), bandeiraea simplicifolia lectin II (BS-II). Three other proteins are RNaseA, trypsin inhibitor, bovine serum albumin (BSA).
- Spectroscopic data for the mannopyranoside thiol derivative used in the preparation of Man-GNP: 1H-NMR (400 MHz, CD3OD, 25 °C, TMS): δ = 8.02 (bs, 1 H, NH), 4.81 (d, J = 1.5 Hz, 1 H), 3.88–3.80 (m, 3 H), 3.74–3.52 (m, 13 H), 3.39–3.32 (m, 2 H), 2.68 (t, J = 7.3 Hz, 2 H), 2.49 (t, J = 7.3 Hz, 1 H, SH), 2.20 (t, J = 7.5 Hz, 2 H), 1.70–1.56 (m, 4 H), 1.42–1.26 (m, 12 H); 13C-NMR (CD3OD, 100 MHz): δ = 175.5, 101.4, 74.4, 72.4, 72.0, 71.5, 71.3, 71.2, 70.6, 68.5, 67.6, 62.9 ,40.5, 39.9, 37.2, 35.4, 30.8, 30.7, 30.6, 30.4, 29.7, 29.7, 27.3; IR (KBr) 3416, 3323, 2925, 2859, 1646, 1553, 1467, 1135, 1062 cm−1; FAB-MS : m/z 512.3 (M+ + 1), 534.2 (M + Na+); FAB-HRMS calcd for C23H45NO9S (M+ + 1) 512.2894, found 512.2885.
- Different sizes of Man-GNPs were prepared. It turns out that 32-nm Man-GNPs give the best optical signals in our studies. Transmission electron microscopic images of synthesized 32-nm Man-GNP alone and in the presence of ConA are included in the ESI†.
- J. Su and M. Mrksich, Angew. Chem., Int. Ed., 2002, 41, 4715–4718 CrossRef CAS.
- K. A. Connors, Binding Constants, The Measurement of Molecular Complex Stability, Wiley-Interscience, New York, 1987 Search PubMed.
- R. L. Rich, L. R. Hoth, K. F. Geoghegan, T. A. Brown, P. K. LeMotte, S. P. Simons, P. Hensley and D. G. Myszka, Proc. Natl. Acad. Sci. USA, 2002, 99, 8562–8567 CrossRef CAS.
Footnote |
| † Electronic supplementary information (ESI) available: Synthetic procedures for mannopyranoside, UV-vis spectra of Man-GNPs in the presence of individual tested protein, MALDI-TOF-MS spectra, Job's plot, Hill plot for stoichiometry determination and the curve fitting for the binding constant. See http://dx.doi.org/10.1039/b507237a |
| This journal is © The Royal Society of Chemistry 2005 |