Design and simulation of sample pinching utilizing microelectrodes in capillary electrophoresis microchips
Yu-Cheng
Lin
*,
Wei-Ming
Wu
and
Chun-Sheng
Fan
Department of Engineering Science, National Cheng Kung University, 1 University Road, Tainan, Taiwan
First published on 5th January 2004
Abstract
The paper proposed novel designs to pinch the transverse diffusion of the sample in the injection mode using microelectrodes to generate the potential difference at the channel intersection in the capillary electrophoresis (CE) microchip. A pair of microelectrodes was used to conduct the injection channel and the separation channel, which directly provided the potential to pinch the sample without using a power supply. These new designs of the CE microchip simplify the electric circuitry and improve performance. Simulations were performed using the CFD-ACE™ software. The mechanisms of diffusion and electrophoresis were employed in the numerical simulation. The injection and separation processes of the sample were simulated and the parameters of the present design were investigated numerically.
1 Introduction
Miniature and microfabricated devices have been developed for applications in biology and biochemistry.1 Great progress has been made in improving the integration and increasing the functionality of MEMS-based microfluidic devices for biological and biochemical applications. The separation techniques for these micro-devices include capillary gel electrophoresis,2–7 electrochromatography,8–10 capillary electrophoresis (CE),1,11–14 and others. Capillary electrophoresis (CE) has been implemented into microchips which require a smaller sample amount and a shorter separation time.15,16 Electrokinetic manipulations transport charged samples, cations or anions, in microfluidic devices. Electrokinetic manipulations include electroosmosis, electrophoresis, and diffusion effect. The charged particles are driven in the direction according to their polarity as an external electric field is applied. The electric field in the capillary would induce a double layer which causes fluid motion outside its boundary and the migration of charged particles. The electroosmotic and electrophoretic manipulations are used to handle bulk fluid motion and control the migration velocity of charged particles. The electrokinetic sample loading and dispensing have been studied theoretically using computer simulation17,18 and experimentally by fluorescent materials.19,20 There were a variety of methods reported using polymeric coatings to decrease or eliminate the influence of electroosmosis manipulation on microchips21 for use in determining the electrophoretic mobility and diffusivity,22 rapid separation, and other inquiries.21The pinching (valving) phenomenon of charged samples is very important for both sample injection and dispensing in the microchip. For the geometry of the channel intersection, many kinds of valve designs have been reported and organized into several types;20 T-type valve, double T-type valve, pinched valve and gated valve. The T-type valve has been used in CE systems designed on a glass chip23 and with a sample preconcentrator.16 The double T-type valve has been used in immunoassay for serum cortisol and others.24–26 The pinched valve design has been used with on-line precolumn reactions,27 and with a microchannel to permit the low electric field strength.28 A number of methods for increasing the pinching (valving) performance have been demonstrated, such as using different electric field strengths for both sample loading and dispensing19 and using different pinched injection schemes.19,20 The previous studies have used numerical simulation and theoretical study to determine the electric field distribution in the microchannel of CE chips with electrodes.29,30
In this paper, the detailed study was conducted for the designs which use a pair of microelectrodes to provide extra electric fields to confine the sample plug in injection mode and dispense the sample in the separation mode. Unlike traditional microchips in which two pairs of electric powers are used, the study employs a single pair of confining electric potentials applied at the inlet and the outlet of the sample. The electrokinetic loading and dispensing processes were numerically simulated by CFD-ACE™ (CFD Research Corporation, Alabama, USA) software. Understanding the electric field distribution inside the injection and separation channels is essential in designing appropriate electrode layouts to generate appropriate electric field strengths for confining the sample injection and dispensing used in CE chips. This work demonstrates novel designs for sample confinement in CE chips.
2 Theory
The mathematical model of electrophoresis describes the physical phenomena in fluids containing ions affected under an applied electric field. The theoretical model of the diffusion of charged particles has been reported.31,32 The mass conservation of a particle “i” is given as | (1) |
| Ji = Vci − ziωici▽Φ − Di▽ci | (2) |
Here V is the velocity vector, r reaction term (which is usually neglected when the equilibrium assumption is made), ci the concentration of the charged particles, zi the valence, ωi the electrophoretic mobility, Φ the electric potential and Di the diffusion coefficient.
The electric field is calculated to get the electromigration term,
| E = −▽Φ | (3) |
The potential term is calculated by Laplace equation
| ▽(σ▽Φ) = 0 | (4) |
 | (5) |
3 Design
Anions migrate from low potential to high potential purely under electrophoretic manipulation. One possible method of pinching the diffusion of the sample along the separation channel in the injection mode is by creating a lower potential at both sides of the injection channel. The study designed several new layouts for CE chips to generate the potential difference at the channel intersection to pinch the transverse sample diffusion in the injection mode. Different layouts were designed and simulated. Fig. 1a shows the conventional design (assigned as Case 1) of the cross-type CE chip with straight channels of 1.5 mm long and 30 µm wide. The conventional CE chip needs two power supplies or a complex electric circuit to pinch the sample in the injection mode, then switch to separate the sample in the separation mode. In the injection mode, electric potentials are applied to points A and B at 150 V and ground, respectively. Points C and D are fixed at the potential of 75 V to create enough potential difference to pinch the anion sample. In the separation mode, a potential of 150 V is applied to point D with point C grounded, while the voltage of the points A and B is fixed at 75 V. To reduce equipment cost and simplify the electric circuit, this paper proposes a series of improved designs, Fig. 1b–f, where a pair of microelectrodes connects the injection channel to the separation channel, directly provides divided potential to deliver the necessary potential to pinch the sample thereby forgoing the use of a power supply. The proposed designs can be microfabricated into real devices using microfabrication techniques. The microchips can be fabricated with glass or PMMA substrates. The microelectrodes can be fabricated onto the bottom substrate using the thermal evaporation and photolithography. Wet-etching or hot embossing techniques can be used to fabricate the microchannels and via holes on the top substrate. Bonding the top and bottom substrates with the thin-film electrodes in between can be achieved using the bonding methods, i.e. fusion bonding or others. Fig. 1b shows the improved structure of a CE chip (Case 2), of whose basic geometry and channel dimensions are the same as Case 1 with the addition of a pair of 30 µm wide microelectrodes. The transverse and vertical intercepts of the microelectrodes to the injection and separation channels are defined as A′E x and C′E (or D′E) y, which are 0.5 mm long in Case 2. Anions flow from lower potential to higher potential under an external electric field in the CE microchip. This design conducts point A′, the low potential, to points C′ and D′. Therefore, the potential gradient is generated in the vertical direction near the intersection. The potential gradient results in the pinching of the sample due to the electrokinetic focusing.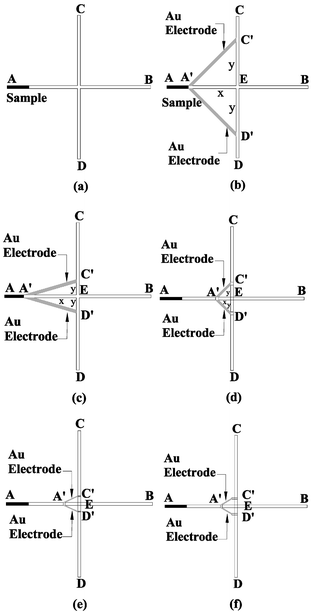 | ||
| Fig. 1 Schematic drawings of CE chips with added microelectrodes: (a) Case 1 represents the conventional cross type CE microchip, (b) Case 2 adds two Au electrodes of equal length x = y = 0.5 mm, (c) Case 3 reduces y to enhance the pinching effect, (d) Case 4 reduces x to shorten the loading time, (e) Case 5 uses further narrowed electrodes to improve the formation of the sample plug, and (f) Case 6 adds two side-channels to the separation channel to increase the sample flow uniformity in the separation channel. | ||
To further improve the sample pinching effect, different chip layouts were designed and analyzed. Fig. 1c, Case 3, shows the design in which the length y is reduced from 0.5 mm (Case 2) to 0.16 mm. Fig. 1d, Case 4, investigates the relationship between the distance x and the pinching effect, where the distance x is reduced from 0.5 mm to 0.16 mm long. In order to strengthen the pinching effect and analyze the effect of the electrode width, Case 5 (Fig. 1e) reduces the electrode-distance y to 80 µm without changing the length x. In Case 5, the width of the electrode is also reduced to 10 µm. All the above designs (Cases 1–5) create potential gradient around point D′, which results in difficulty for the sample plug to flow through point D′ uniformly. Case 6 adds two small side-channels at points C′ and D′ to avoid the potential gradient in the separation channel and reduce the blocking effect due to the bubble generated from the electrochemical reaction at the contact area of the electrodes and buffer solution. Both the lengths of x and y are 30 µm. All the dimensions of Cases 1–6 are shown in Table 1. CFD-ACE™ software running on a personal computer was used for the analysis. The electrophoretic mobility and diffusivity used for the negatively-charged sample analyzed in this study are −2.53×10⁻⁸ m2V−1s−1,22 and 1 × 10⁻¹⁰ m2s−1,33 respectively.
4 Results and discussion
This study analyzes the sample confinement in both sample injection and separation modes, which focuses on the sample's concentration and position in the intersection of the microchip. In the sample injection mode, the anion sample in a conventional microchip diffuses in the vertical direction to the separation channel at the intersection, as shown in Fig. 2a. The applied electric potentials to points A and B are at 150 V and ground, respectively, and points C and D are fixed at the potential of 75 V. To improve the sample confinement, microelectrodes are added as mentioned above. Fig. 2b shows the simulated result of Case 2, which demonstrates a better pinching effect than that of the conventional design (Case 1). The potential difference of C′E (and D′E) increases as y shortens, which results in a better pinching effect. | ||
| Fig. 2 Simulated results of normalized sample concentration distributions (Cases 1–6) in the injection mode: (a) Case 1, (b) Case 2, (c) Case 3, (d) Case 4, (e) Case 5, and (f) Case 6. | ||
The following design, Case 3, shortens y to 0.16 mm, which generates a larger potential difference than that of Case 2. Therefore, Case 3 shows a better sample confinement than that of Case 2, as shown in Fig. 2c. The disadvantage of Case 3 is that the sample flows very slowly from point A′ to the junction E in the injection mode due to the small potential gradient between points A′ and E. The electric field strength can be increased by shortening the distance x. Case 4 is designed to improve upon such conditions, but slightly weakens the pinching effect, shown in Fig. 2d. The distance of A′E, i.e.x, is 0.16 mm, while maintaining y at 0.16 mm. The width of the microelectrode would create different potential distribution around the contact points of the electrodes and the separation channel, which would dramatically affect the size and shape of the sample plug when switching from the injection mode to separation mode. Case 5 has a narrower electrode width, 10 µm, than Cases 2–4 (30 µm). The sample pinching effect is illustrated in Fig. 2e. While narrowing the electrode width does indeed improve the potential distribution around the contact points of the electrode and separation channel, the sample plug is still affected by the electrodes. Case 6 adds two small side-channels to the separation channel for connecting the electrodes. Its sample confining effect is similar to that of Case 5, shown in Fig. 2f, with even greater sample dispensing. The comparison of the sample plug in the separation mode will be discussed later.
The potential distributions of all cases within the interval C′D′ are similar but possess different magnitudes. Here Case 3 is used to illustrate the potential distribution, as shown in Fig. 3. The maximum potential is approximately 60 V at point E (channel intersection) and the potential decreases progressively to approximately 40 V from point E to points C′ and D′.
 | ||
| Fig. 3 (a) Potential distribution of Case 3 with VB = 150 V and VA = 0 V, and (b) potential profile from point C to point D, original is set at point E. | ||
To compare the sample concentration distribution at the intersection of all cases in the injection mode, the sample concentrations of all cases along the LL′ in Fig. 2 are normalized and plotted in Fig. 4. A sample concentration value of 1.0E-4 is chosen as the cut-off point for the lowest sample concentration. The maximum diffusion distance is measured from point E (highest concentration) to the position of the cut-off concentration. Case 1 has the broadest diffusion distance of the sample in all cases, which is ±88.3 µm. The sample in Case 2, where microelectrodes are introduced, is pinched into ±40.6 µm. Compared to Case 2, Case 3 shortens the distance y and has an even better pinching effect. In Case 3, the maximum diffusion distance of the sample is ±21.9 µm. The disadvantage of the Case 3 design is that the sample has very low flow speed within the interval of A′E. To accelerate the sample speed, Case 4 shortens the A′E distance to increase the potential gradient between points A′ and E, which yields a maximum diffusion length of ±30.8 µm. The sample confinement effect is better than that of Case 2, but it is inferior to Case 3. Cases 5–6 have slightly better sample confinement effects than that of Case 4. Cases 5 and 6 were designed to improve the sample flow in the separation mode. The sample confinement performance based upon the sample diffusion distance from the best to the worst is Case 3 > Case 5 > Case 6 > Case 4 > Case 2 > Case 1.
 | ||
| Fig. 4 Simulated results of pinched sample concentration for Cases 1–6 and the sample confinement performance based on the sample diffusion length (from best to worst): Case 3 > Case 5 >Case 6 > Case 4 > Case 2 > Case 1. | ||
Fig. 5a depicts the sample being deflected to the right side of the channel near point D′ in Case 4 when switching to the separation mode. The sample deflection phenomena is due to a rising potential gradient at the electrode site from left to right across the separation channel, resulting in the sample passing through the channel near the point D′ non-uniformly. In this way, the dispensed sample plug becomes very broad. To overcome this problem, the improved design, Case 5, narrows the electrode width to further reduce the influence of the non-uniform electric field to the sample plug in the separation mode. Fig. 5b shows the sample flow in the separation mode. Adding two side-channels at the contact points of the electrodes and the separation channel can diminish the potential gradient around the contact points and further increase the sample plug uniformity, as shown in Fig. 5c. However, the addition of the side-channels decreases the sample confinement performance slightly, from ±27.9 µm (Case 5) to ±28.5 µm. Table 1 summarizes the sample confinement performance of all cases.
 | ||
| Fig. 5 Simulation results of normalized sample concentration distributions in the sample dispensing process: (a) Case 4 indicates the non-uniform sample flow through point D′, (b) Case 5 sample is deflected to the right side of the channel near point D′ due to potential gradient, and (c) Case 6 sample plug passes point D′ more uniformly than Cases 4 and 5. | ||
5 Conclusions
The sample confinement effects using additional microelectrodes were studied using numerical simulation. A pair of electrodes was introduced to connect the injection channel to the separation channel, which directly provided divided potential to deliver the necessary potential to pinch the sample without using a power supply. The designs used in this study simplified the electric circuit and increased the sample pinching effect of the CE microchip. Different sample pinching effects in the injection mode were analyzed using the electrode widths, different transverse and vertical intercepts of the electrodes to the injection and separation channels, and the addition of side-channels as parameters. The sample-plug uniformity in the separation mode was investigated as well. This study can provide further improvement in CE chip design.Acknowledgements
The work is supported by the National Science Council of the Republic of China under the grant NSC 91-2218-E-006-014.References
- A. Manz, D. J. Harrison, E. M. J. Verpoorte, J. C. Fettinger, A. Paulus, H. Ludi and H. M. Widmer, J. Chromatogr., 1992, 593, 253–258 CrossRef CAS.
- D. Haidacher, G. K. Bonn, H. Scherz, E. Nitsch and R. Wutka, J. Chromatogr., 1992, 591, 351–357 CrossRef CAS.
- A. Guttman and E. Szoko, J. Chromatogr., A, 1996, 744, 321–324 CrossRef CAS.
- J. W. Hong, K. Hosokawa, T. Fujii, M. Seki and I. Endo, Technical Digest of Transducers '99, 10th Int. Conf. on Solid-State Sensors and Actuators (Sendai, Japan, June 1999), 1999, 760–763 Search PubMed.
- S. A. Soper, S. M. Ford, Y. Xu, S. Qi, S. McWhorter, S. Lassiter, D. Patterson and R. C. Bruch, J. Chromatogr., A, 1999, 853, 107–120 CrossRef CAS.
- J. Zheng, T. Odake, T. Kitamori and T. Sawada, Anal. Chem., 1999, 71, 5003–5008 CrossRef CAS.
- Z. Q. Xu, T. Hirokawa, T. Nishine and A. Arai, J. Chromatogr., A, 2003, 990, 53–61 CrossRef CAS.
- L. Ceriotti, E. Verpoorte and N. F. de Rooij, Proc. Micro-TAS 2000 (Enschede, Netherlands, May 2000), 2000, 225–228 Search PubMed.
- Y. Fintschenko, S. M. Ngola, T. J. Shepodd and D. W. Arnold, Proc. Micro-TAS 2000 (Enschede, Netherlands, May 2000), 2000, 411–414 Search PubMed.
- S. C. Jacobon, R. Hergenröder, L. B. Koutny and J. M. Ramsey, Anal. Chem., 1994, 66, 2369–2373 CrossRef CAS.
- D. N. Heiger, A. S. Cohen and B. L. Karger, J. Chromatogr., 1990, 516, 33–48 CrossRef CAS.
- K. C. Chan, G. M. Muschik and H. J. Issaq, J. Chromatogr., B, 1997, 695, 113–115 CrossRef CAS.
- S. C. Jaconson, R. Hergenroder, L. B. Koutny, R. J. Warmack and J. M. Ramsey, Anal. Chem., 1994, 66, 1107–1113 CrossRef CAS.
- A. T. Woolley and R. A. Mathies, Anal. Chem., 1995, 67, 3676–3680 CrossRef CAS.
- S. C. Jacobson, R. Hergenröder, L. B. Koutny and J. M. Ramsey, Anal. Chem., 1994, 66, 1114–1118 CrossRef CAS.
- Y. C. Lin, H. C. Ho, C. K. Tseng and S. Q. Hou, J. Micromech. Microeng., 2001, 11, 189–194 CrossRef CAS.
- S. V. Ermakov, S. C. Jacobson and J. M. Ramsey, Anal. Chem., 1998, 70, 4494–4504 CrossRef CAS.
- S. V. Ermakov, S. C. Jacobson and J. M. Ramsey, Anal. Chem., 2000, 72, 3512–3517 CrossRef CAS.
- J. P. Alarie, S. C. Jacobson, C. T. Culbertson and J. M. Ramsey, Electrophoresis, 2000, 21, 100–106 CrossRef CAS.
- J. P. Alarie, S. C. Jacobson and J. M. Ramsey, Electrophoresis, 2001, 22, 312–317 CrossRef CAS.
- J. Horvath and V. Dolník, Electrophoresis, 2001, 22, 644–655 CrossRef CAS.
- E. Stellwagen and N. C. Stellwagen, Electrophoresis, 2002, 23, 2794–2803 CrossRef CAS.
- D. J. Harrison, A. Manz, Z. Fan, H. Ludi and H. M. Widmer, Anal. Chem., 1992, 64, 1926–1932 CrossRef.
- L. B. Koutny, D. Schmalzing, T. A. Taylor and M. Fuchs, Anal. Chem., 1996, 88, 18–22 CrossRef.
- C. S. Effenhauser, A. Manz and H. M. Widmer, Anal. Chem., 1993, 65, 2637–2642 CrossRef CAS.
- C. S. Effenhauser, A. Paulus, A. Manz and H. M. Widmer, Anal. Chem., 1994, 64, 2949–2953 CrossRef.
- S. C. Jacobson, R. Hergenröder, A. W. Moore, Jr. and J. M. Ramsey, Anal. Chem., 1994, 66, 4127–4132 CrossRef CAS.
- S. C. Jacobson, C. T. Culbertson, J. E. Daler and J. M. Ramsey, Anal. Chem., 1998, 70, 3476–3480 CrossRef CAS.
- Y. C. Lin and W. D. Wu, Sens. Actuators, B, 2001, 73, 54–62 CrossRef.
- Y. C. Lin, Sens. Actuators, B, 2001, 80, 33–40 CrossRef.
- D. A. Saville and O. A. Palusinki, AIChE Journal, 1986, 32, 207–214 CAS.
- M. G. Giridharan and A. Kirshnan, ASME Intl. Congress and Exposition, 1998, 66, 61–68 Search PubMed.
- N. C. Stellwagen, S. Magnusdottir, C. Gelfi and P. G. Righetti, Biopolymers, 2001, 58, 390–397 CrossRef CAS.
| This journal is © The Royal Society of Chemistry 2004 |