Characterization of phosphorus content of biological samples by ICP-DRC-MS: potential tool for cancer research
Dmitry R. Bandura*a, Olga I. Ornatskyb and Linda Liaob
aPerkinElmerSCIEX, 71 Four Valley Drive, Concord, Ontario, Canada L4K 4V8. E-mail: Dmitry.Bandura@sciex.com
bMDS Proteomics, 251 Attwell Drive, Toronto, ON, Canada M9W 7H4
First published on 16th December 2003
Abstract
Phosphorus and sulfur are detected as phosphorus oxide and sulfur oxide ions (PO+ and SO+), produced by oxidation reactions with O2 performed in the reaction cell of the inductively coupled plasma dynamic reaction cell mass spectrometer (ICP-DRC-MS), at sub-ng mL−1 detection limits. This allows pM mL−1 detection of phospho-proteins, with S used as an internal standard (see ref. 9). The method was applied to digests (in HCl) of in-vitro tyrosine kinase assays, both as an evaluation of kinase autophosphorylation and phosphorylation of substrate. Detecting the phosphorus/sulfur ratio (via measured PO+/SO+) in cell cultures is shown to provide a distinguishable difference between malignant cell lines and primary cultures. The PO+/SO+ ratio for human colorectal adenocarcinoma (CRC) tissue samples compared with matched normal (N) tissue samples from the same patients is shown to be higher, at (PO+/SO+)CRC/(PO+/SO+)N = 1.75 ± 0.18 (n = 4). Samples used in this analysis were of needle biopsy amounts (0.2–0.5 mg), with a greater than 70% tumor burden in CRC. The phospho-protein phosvitin is detected directly from dried one-dimensional polyacrylamide gels using laser ablation ICP-MS by detecting phosphorus at sub-nM amounts. The phosphorus detection limit for direct ablation, assessed from ablating gel doped with P and blank gel, is 0.6 µg g−1 in gel. Direct detection of sulfur from the gels is obscured by the high sulfur background for the blank gels, which is attributed to the sulfur-containing catalysts used in polymerization and to sodium dodecyl sulfate (SDS) used for protein denaturing.
Introduction
Phosphorylation and de-phosphorylation of cell proteins are essential signalling processes that regulate a wide variety of cellular events. These processes are catalyzed by enzymes, the activity of which can be suppressed by selective inhibitors. Development of such inhibitors and the study of their efficacy is an important part of the drug development process. One of the sub-classes of the enzymes is protein tyrosine kinases (PTK), which catalyze the phosphorylation of tyrosine residues in target proteins. A common method of detecting PTK activity is based on 32P radioisotope labelling, where the transfer of 32P from [γ-32P]ATP to an immobilized protein or peptide substrate is measured by scintillation.1 Other methods include Western blotting with anti-phosphotyrosine antibodies probing2 and immuno-precipitation with colorimetric detection,3 both being very labour-intensive methods.The 32P assay is based on detection of transferred atomic phosphorus, and the present work investigates the potential of using atomic spectroscopy to detect the total phosphorus content of the immobilized substrate without employing a radioisotope. Inductively coupled plasma mass spectrometry (ICP-MS) has recently been successfully applied to the detection of phosphorus.4–9 It offers an additional advantage of simultaneous detection of other elements in the sample. Such detection can potentially be used in order to compensate for variability of the total substrate content, so that a separate assay is not necessary. A convenient internal standard is sulfur, since many target proteins or peptides contain cystein (Cys) or methionine (Met) residues. 31P+ and 32S+ signals in ICP-MS are interfered by polyatomic ions (NOH+, NO+, O2+, etc.). Sector field ICP-MS at medium (R = 4000) resolution8 and ICP-DRC-MS with chemical resolution9 have been shown to allow detection of P and S at ∼nM concentrations, the latter method detecting P and S as PO+ and SO+ products of the reaction of P+ and S+ with O2 in the DRC.
We present here the results of the application of the ICP-DRC-MS method to the detection of phosphorus in biologically active materials, including normal and tumor cell lines, and matched cancer and normal patient tissue samples. Tyrosine kinase activity is assessed in-vitrovia the measured PO+/SO+ ratio. The potential for direct phosphorus detection from proteins separated by one-dimensional polyacrylamide gel electrophoresis (1D-PAGE) is discussed.
Experimental
Instrumentation
The instrument used in these studies was a PerkinElmerSCIEX Elan DRCplus described elsewhere.10,11 It was operated under normal plasma conditions, with sample introduction via a microconcentric nebulizer PFA100 (Elemental Scientific, Inc., Omaha, NE 68131, USA) at a rate of about 100 µL min−1. Research purity (99.998%) oxygen (Matheson Gas Products, Whitby, Ontario, Canada) was used as the reaction gas.The optimization of the instrument for aqueous samples has been described previously.9 Since typical digests of biological materials may contain high amounts of C, N and Cl (from HCl), the effect of polyatomic ions containing these atoms on the background for 31PO+ and 32SO+ was assessed. Table 1 lists thermodynamic (calculated with data from ref. 12) and kinetic data for the analytes and the potential interferences at m/z = 47,48. Reactions for HCO+, NO+, NOH+ and O2+ are endothermic and should not proceed. Reaction for CO+, although exothermic, can be excluded based on kinetic data.13 Oxidation of P+, S+ (to produce the analyte ions PO+ and SO+ ) and Ti+ (potential new atomic interference) is known to proceed (as discussed in ref. 9). There is no thermochemical nor kinetic data for ArC+: however, one might expect the ionization potential of this polyatomic to be high (as for all argides), potentially allowing charge-transfer with O2. Oxidation of CCl+ is exothermic. Reaction of P+ with H2O impurities in the reaction gas, the product of which (POH+) could potentially interfere with SO+, could not be observed due to low abundance of the H2O impurity in the gas (<0.0001%).
| Reaction | Reaction enthalpy change ΔHr/kcal mol−1 | Thermal reaction rate constant13kr/molecule−1 cm3 s−1 |
|---|---|---|
| P+ + O2 → PO+ + O | −71.4 | 5.3 × 10⁻¹⁰ |
| S+ + O2 → SO+ + O | −6.2 | 1.8 × 10⁻¹¹ |
| CO+ + O2 → CO2+ + O | −13.5 | <2 × 10⁻¹⁴ (no reaction) |
| HCO+ + O2 → COOH+ + O | 3.3 | <2 × 10⁻¹³ (no reaction) |
| NO+ + O2 → NO2+ + O | 57.4 | <1×10⁻¹¹ (no reaction) |
| NOH+ + O2 → NO2H+ + O | 19.3 | No data |
| O2+ + O2 → O3+ + O | 102.1 | No data |
| Ti+ + O2 → TiO+ + O | −46.1 | 5.0 × 10⁻¹⁰ |
| CCl+ + O2 → O2+ + CCl | 73.5 | <1 × 10⁻¹² (no reaction) |
| CCl+ + O2 → ClO++ CO | −46.4 | |
| ArC+ + O2 → O2+ + Ar (?) | No data | No data |
| P+ + H2O → (91%) POH+ + OH | No data | |
| 5.5 ×10⁻¹⁰ | ||
| → PO+ + H2 | −73.2 |
The method of detection of phosphorus and sulfur and their ratio in phospho-proteins alpha- and beta-casein in a matrix containing high (5%) concentrations of CH2O2 and CH3CN at 10–1000 fmol μL−1 levels has been developed and discussed previously.9 As is shown in Fig. 1, CCl+ and ArC+ react with O2 and can be removed, same as Ti+ which, if present in the samples, can potentially be an interference for PO+ and SO+. Reactivity of CCl+ towards oxygen suggests that HCl can be used for digesting biological samples, since this Cl-based interference is removed in reactions.
 | ||
| Fig. 1 Profiles of formation of PO+ and SO+ and removal of potential interferences in reactions with O2. | ||
Kinase assays
The buffers and reagents used in the kinase assays are listed in Table 2.| Reagent | Manufacturer |
|---|---|
| Maxisorp 96-well plate | Nalge Nunc International, Rochester, NY, USA |
| Glutathione | Sigma–Aldrich Canada Ltd. |
| Poly(L-glutamic acid-L-tyrosine), sodium salt Glu∶Tyr 4∶1 | Sigma–Aldrich Canada Ltd. |
| Carbonate buffer, pH 9.0: | Sigma–Aldrich Canada Ltd. |
| 15 mM Na2CO3 | |
| 35 mM NaHCO3 | |
| Tris-saline buffer, pH 7.5: | Sigma–Aldrich Canada Ltd., J.T.Baker, Phillipsburg, NJ, USA |
| 10 mM TRIZMA® base (Ultra) | |
| 50 mM NaCl (Ultrex®) | |
| Kinase buffer, pH 7.6: | |
| 20 mM Hepes (Ultra) | Sigma–Aldrich Canada Ltd. |
| 5 mM MgCl2 | Sigma–Aldrich Canada Ltd. |
| 2 mM MnCl2 | Sigma–Aldrich Canada Ltd. |
| EphA4-GST kinase domain | Recombinant protein, MDS Proteomics Inc. |
| 0.2 U EGFR tyrosine kinase One unit will catalyze the incorporation of 1 pmol of phosphate from U-32P-ATP into poly(Glu,Tyr), 4∶1, at 37 °C per minute at pH 7.6 | BIOMOL Research Laboratories, Inc., PA, USA |
| 10 mg ml−1 EphB2 Tyrosine kinase | Recombinant protein, MDS Proteomics Inc. |
| ATP 500 µM in kinase buffer | Sigma–Aldrich Canada Ltd. |
| Deionised water (Milli-Q) | Millipore Corporation, Bedford, Massachusetts, USA |
| HCl conc. (34%) | Baseline, Seastar Chemicals Inc., Sydney, BC, Canada |
Cell lysates and tissue samples
Cells were grown in 100 mm dishes in standard growth media supplemented with fetal bovine serum (3 dishes per cell type, a total of 3 × 10⁷ cells each). Dishes were gently washed with tris–saline buffer and buffer was aspirated dry. 250 µL of concentrated HCl were added to each dish; the dishes were rotated to ensure full surface coverage with the acid and another 250 µL were added. The dishes were left standing for 20 min and digests were collected into 2 mL eppendorf tubes (Sarstedt Inc., Montreal, Québec, Canada). The blanks were prepared by adding 0.5 mL HCl to new dishes, rotating and collecting in the eppendorf tubes.
![[hair space]](https://www.rsc.org/images/entities/char_200a.gif) 000g for 5 min. 50 µL of supernatant from each tube was transferred into a deep-well plate with 450 µL of 1 ∶ 10 HCl v/v. Thus, the net amount of the biopsy tissue sample used for the analysis was 1/100 of the initial amount, i.e., 0.1–0.5 mg. Each frozen tissue sample was processed in triplicate.
000g for 5 min. 50 µL of supernatant from each tube was transferred into a deep-well plate with 450 µL of 1 ∶ 10 HCl v/v. Thus, the net amount of the biopsy tissue sample used for the analysis was 1/100 of the initial amount, i.e., 0.1–0.5 mg. Each frozen tissue sample was processed in triplicate.Laser ablation of gels
The details of the laser ablation system (Merchantek LUV266, New Wave Research, Fremont, CA, USA) coupled to the ICP-DRC-MS and the modifications to the ablation chamber for accommodation of dried PAGE gel cut-outs are described elsewhere.14 The challenging part of coupling of 1D SDS-PAGE separations (run on Mini-PROTEAN® 3 Cell, Bio-Rad Laboratories, Hercules, CA, USA) was found to be gel drying, during which cracks and unevenness of the surface can develop. We found that the optimal way to reproducibly dry the gels was to vacuum dry between the two cellophane sheets (Bio-Rad) on the Model 583 Gel Dryer (Bio-Rad) with an external vacuum pump (D10E, Leybold Canada Inc., Mississauga, Ontario) used for evacuation. Clamping of the dried gel cut-out along both sides of the microscope slide glass (25 × 50 mm) with custom-made stainless steel clamps14 ensured that the gel stays flat during the ablation. Laser energy of 1.2 mJ (45%) was used at a scanning speed of 100 µm s−1, at 10 Hz laser pulse repetition frequency and 100 µm spot size. Mixtures of argon and helium of various relative content were tried as carriers, with no apparent improvement in sensitivity nor in signal stability, resulting in argon gas being used as a carrier at 1.35 L min−1. The same parameters but at a reduced laser energy (20%) were used for pre-ablation.Results and discussion
Fig. 2 shows the results for the kinase autophosphorylation assay at different concentrations of the kinase (negative controls are included). The measured PO+/SO+ ratio follows the concentration of EphA4-GST if glutathione and ATP are present; in the absence of the kinase, substrate or ATP, the ratio is significantly lower [all negative controls (no glutathione, no ATP, no kinase) produced a PO+/SO+ ratio <0.01]. We attribute the overlap of uncertainties for different concentrations of the kinase to high variability of coating and binding efficiency. As can be seen, at least a digital answer (presence of phosphorylation) can be obtained from the measurement. Further experiments are needed to study whether quantitation of the kinase can be achieved (probably requiring more than triplicate for each reaction). | ||
| Fig. 2 Autophosphorylation assay of Eph A4 receptor kinase. Presence or absence of ATP is indicated by “+” or “−“, respectively. Each assay and its control were performed in triplicate. | ||
Results for phosphorylation assays of the synthetic substrate poly(Glu,Tyr), shown in Fig. 3, suggest that a difference in activity between the receptor kinases (EGFR and EphB2), as well as a difference in degree of substrate phosphorylation when the same kinase is used at a lower concentration (EphB2 1∶1000 versus 1∶2500 dilution), can be detected by measuring PO+/SO+ using the ICP-DRC-MS method. Compared with conventional methods of kinase activity analysis in the presence of γ-32P[ATP] or enzyme linked immunosorption assay (ELISA), the advantage of ICP-MS detection is straightforward single step sample preparation, no exposure to hazardous radiochemicals and less time than is necessary for colorimetric assays. Another advantage is related to a less stringent requirement for sample handling and storage, since sample integrity does not need to be preserved for elemental analysis (sample is digested in HCl).
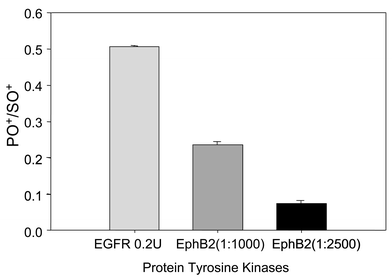 | ||
| Fig. 3 Activity of EGFR and EphB2 tyrosine kinases measured by detecting phosphorylation state of poly(Glu,Tyr) substrate. Each assay, and its control, was performed in triplicate. | ||
The method was applied to assessing the state of phosphorylation of the total cell protein for the digest of human cell lines. Cell growth cannot be terminated at exactly the same number of cells per dish, which may result in relatively high variation in the total protein content of the samples. The sulfur signal was used to compensate for this variability. Fig. 4 shows PO+/SO+ ratios for four human cell lines measured by the method. Malignant cells (HEK293, C13 and HepG2) are observed to produce a higher PO+/SO+ ratio than normal cells (human normal dermal fibroblasts, hNDF) when measured by this method. It is known that the growth and spread of many tumors is triggered by changes in cell membrane metabolism, which can lead to systemic alterations in levels of phospholipids.15 Receptor protein tyrosine kinases are often up-regulated in human cancer cells,16 thus higher total phosphate compared with normal, non-malignant cells can be expected. This is observed in the experiments with cell lines, as well as for matched human tissues from patients' biopsy samples of colorectal tumor (CRC) and normal mucosa (N) tissues from the same patient (supplied by Genomics Collaborative Inc.). Comparison of the PO+/SO+ response for the matched samples from 4 different patients is given in Fig. 5. The ratio is consistently higher for cancerous tissue: (PO+/SO+)CRC = (1.75 ± 0.18) × (PO+/SO+)N. The net amount of the biopsy sample used was 0.1–0.5 mg. For 24 measured samples, S/N for PO+ and SO+ was in the range of 50–600 and 10–140, respectively. Providing the capability of handling and processing sub-mg biopsy samples, the method can potentially be used for assessing P content of ultra-small tissue amounts.
 | ||
| Fig. 4 P/S ratio of cell lysates for malignant (2–4) and normal (1) cell lines measured as PO+/SO+ with DRC pressurized with O2. | ||
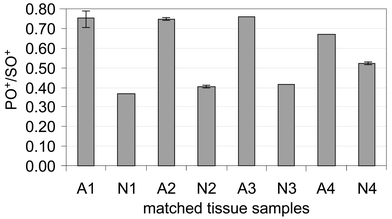 | ||
| Fig. 5 Measured PO+/SO+ ratios for human colorectal adenocarcinomas (A) and matched normal (N) tissue. Ratio errors (±1σ) for samples N1, A3, N3, A4 are too small to be shown. | ||
The method of assessing the degree of protein phosphorylation via ICP-MS has been shown to be useful when high resolution SF-ICP-MS is coupled to an LC chromatograph.17 Alternatively, separation of protein mixtures can be carried out by gel electrophoresis. The detection of metalo-proteins directly from electrophoretic gels by laser ablation ICP-MS has been reported.18,19 Detection was performed by using the metals bound to a protein of interest as analyte. The use of phosphorus to detect phospho-proteins at different concentrations deposited onto nitrocellulose paper was reported by Marshall et al.20 In the latter report, direct detection of phosphorus in proteins immobilized in electrophoretic gels was considered to be problematic due to the high (>5 × 10⁷ counts s−1) background.20 Recently, successful detection of PAGE separated phosphoproteins from gels after electroblotting to a blotting paper was reported.21
One of the factors limiting detection is the variability of the background, some of which is related to variability of ablation rate during the scan due to the changes in optical density of the gel. We have observed improved stability of the background when a cyclonic spray chamber was inserted between the ablation chamber and ICP source, presumably due to damping of large particle density fluctuation or elimination of large particles. Since protein bands are usually 1–2 mm wide, loss of spatial resolution associated with damping was not significant.
Fig. 6 shows an optimization of the instrument response performed by comparison of 31PO+ or 31P+ signals measured for blank gel and gel soaked in H3PO4 (J. T. Baker, Phillipsburg, NJ, USA) at 3.2 mM (P-gel). Cell gas flow optimization (Fig. 6 (a)) shows that under optimum conditions, the background equivalent concentration for P is about 2 µg g−1, and the estimated detection limit at the reaction gas flow of 0.2–0.6 Ar-equivalent sccm is about 0.6 µg g−1. Carrier gas flow optimization (Fig. 6 (b)) performed in standard (no cell gas) mode shows that a similar signal-to-noise ratio is obtained at m/z = 31. The blank levels of the S were high (>106 counts s−1 measured as 32SO+) for both the blank gel and for the P-gel. Agreement of measured 34SO+/32SO+ for the blank gel and the P-gel suggests that the possible input of POH+ to the ion signal at m/z = 48 is insignificant. We attribute the high sulfur background to impurities in the polyacrylamide, which are produced in the process of polymerization of acrylamide, catalyzed by ammonium persulfate and TEMED.22 Conceivably, an improved sulfur background might be obtained if photopolymerized gels were used. Another obvious limitation for the detection of sulfur from proteins separated by PAGE is contamination of gels by SDS used for denaturing.
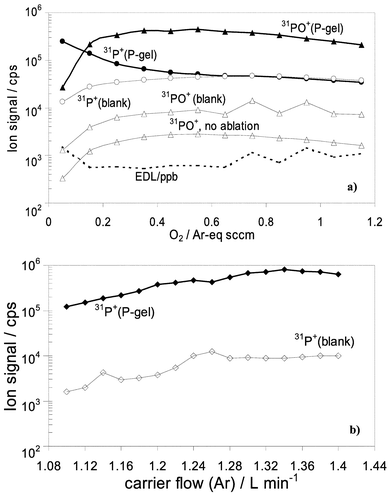 | ||
| Fig. 6 Optimization for laser ablation in DRC and Standard modes by continuous ablation of the blank gel and gel soaked in 100 µg mL−1 P: (a) profile of reaction of 31P+ with O2, DRC mode. Estimated 3σ detection limit is shown by broken line; (b) 31P+ signal as a function of Ar carrier gas flow, standard mode. | ||
Fig. 7 shows raw data for the detection of 31P+ from different lanes of SDS-PAGE gel loaded with different loads of vitalogenin (phosvitin), the protein which is known to be phosphorylated at up to 10% of residues (out of 347 residues, 47 are serines, 8 are tyrosines and 5 are threonines23). Two gels were run with identical 10 µL loads of 0, 0.025, 0.05, 0.1, 0.5, 1, 2 and 5 µg of the protein. We found that staining with GelCodeR Phosphoprotein Stain Reagent Set allowed detection at 0.5 µg and higher. LA-ICP-MS produced signals well distinguished from the background at 0.05 µg and higher. Areas under the peaks, calculated after baseline background subtraction, produced linear response in the range 0.1–2 µg, with observable saturation of signal for a 5 µg load.14 100 ng load corresponds approximately to 2.6 pM of the protein. For the proteins phosphorylated at only few residues, detection limits achievable thus far should thus be of the order of 50–100 pM.
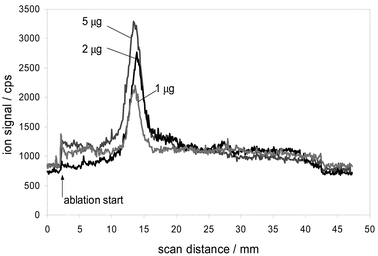 | ||
| Fig. 7 Direct detection of phosvitin bands from 1-D gel at different protein loads. | ||
Conclusions
The detection of phosphorus and sulfur by means of ICP-DRC-MS allows the study of the activity of tyrosine kinases in-vitro. From the measured degree of phosphorylation of immobilized substrate or the degree of auto-phosphorylation of the kinase, differences in activities between the kinases can be detected. Potentially, the method can be used for providing a digital answer when screening kinase inhibitors.Total phosphorus content in cell cultures and patient tissues can be assessed through the measured PO+/SO+ ratio. Paired samples (malignant and normal) from four patients have shown distinguishably higher phosphorus content in tumor tissues.
Detection of phospho-proteins directly from dried one-dimensional electrophoretic gels can be carried out by means of laser ablation ICP-MS. Proteins containing several phosphate molecules are detectable in sub-nanomole amounts.
Acknowledgements
Vladimir I. Baranov, Scott D. Tanner and Zoë A. Quinn of MDS Sciex are thanked for sharing their insights in various aspects of ion–molecule chemistry and biology. Merchantek is thanked for the loan of LUV266 ablation system.References
- E. Schaefer and K. Hsaio, Promega Notes Magazine, 1996, 59, 2 Search PubMed : available online at www.promega.com/pnotes.
- M. P. Kamps, Methods Enzymol., 1991, 201, 101 CAS.
- ELISA Kit Range and Sensitivity; www.biosource.com.
- H. Wildner, J. Anal. At. Spectrom., 1998, 13, 573 RSC.
- T. Prohaska, C. Latkoczy and G. Stingeder, J. Anal. At. Spectrom., 1999, 14, 1501 RSC.
- C. Siethoff, I. Feldmann, N. Jakubowski and M. Linscheid, J. Mass Spectrom., 1999, 34, 421 CrossRef CAS.
- M. Wind, M. Edler, N. Jakubowski, M. Linscheid, H. Wesch and W. D. Lehmann, Anal. Chem., 2001, 73, 29 CrossRef CAS.
- M. Wind, H. Wesch and W. D. Lehmann, Anal. Chem., 2001, 73, 3006 CrossRef CAS.
- D. R. Bandura, V. I. Baranov and S. D. Tanner, Anal. Chem., 2002, 74, 1497 CrossRef CAS.
- S. D. Tanner and V. I. Baranov, J. Am. Soc. Mass Spectrom., 1999, 10, 1083 CrossRef.
- D. R. Bandura, V. I. Baranov and S. D. Tanner, J. Am. Soc. Mass Spectrom., 2002, 13, 1176 CrossRef CAS.
- S. G. Lias, J. E. Bartmess, J. F. Liebman, J. L. Holmes, R. D. Levin and W. G. Mallard, J. Phys. Chem. Ref. Data, 1988, 17(Suppl 1) Search PubMed.
- V. G. Anicich, Search PubMed JPL Publication 03-19, Jet Propulsion Laboratory, Pasadena, CA, November 2003.
- D. R. Bandura, V. I. Baranov, O. I. Ornatsky and Z. A. Quinn in Plasma Source Mass Spectrometry: Applications and Emerging Technologies, eds. J. G. Holland and S. D. Tanner, The Royal Society of Chemistry, Cambridge, 2003, p. 43 Search PubMed.
- S. E. Franks, M. R. Smith, F. Arias-Mendoza, C. Shaller, K. Padavic-Shaller, F. Kappler, Y. Zhang, W. G. Negendank and T. R. Brown, Leuk. Res., 2002, 26, 919 CrossRef CAS.
- S.-A. Stephenson, S. Slomka, E. L. Douglas, P. J. Hewett and J. E. Hardingham, BMC Mol. Biol., 2001, 2, 15 Search PubMed ; http://www.biomedcentral.com/1471-2199/2/15.
- M. Wind, O. Kelm, E. A. Nigg and W. D. Lehmann, Proteomics, 2002, 2, 1516 CrossRef CAS.
- J. L. Neilsen, A. Abildtrup, J. Christensen, P. Watson, A. Cox and C. W. McLeod, Spectrochim. Acta, Part B, 1998, 53, 339 CrossRef.
- R. D. Evans and J. Y. Villeneuve, J. Anal. At. Spectrom., 2000, 15, 157 RSC.
- P. Marshall, O. Heudi, S. Bains, H. N. Freeman, F. Abou-Shakra and K. Reardon, Analyst, 2002, 127, 459 RSC.
- W. D. Lehmann, N. Jakubowski and M. Wind, 51st ASMS Conference on Mass Spectrometry and Allied Topics, Montreal, Canada, June 8–12, 2003.
- K. Wilson and J. Walker, Principles and Techniques of Practical Biochemistry, Cambridge University Press, 2000, p. 319 Search PubMed.
- Swiss-Prot/TrEMBL Protein Knowledgebase, Swiss Institute of BioInformatics; www.isb-sib.ch.
| This journal is © The Royal Society of Chemistry 2004 |