Characterisation of trace elements and methylmercury in an estuarine sediment reference material, IAEA-405
Eric J.
Wyse
,
Marina
Coquery
,
Sabine
Azemard
and
Stephen J.
de Mora
International Atomic Energy Agency, Marine Environment Laboratory, B.P. 800, MC-98012, Monaco
First published on 8th December 2003
Abstract
An estuarine sediment sample, IAEA-405, was recently characterised for trace elements and methylmercury (MeHg) for ultimate use as a marine reference material. The reference values were calculated using data sets from 120 laboratories that participated in a world-wide intercomparison exercise. The data evaluation is highlighted, and includes comparisons of different analytical methods, as well as the distribution of data. Overall laboratory performance for this exercise was encouraging: 86 laboratories (72%) reported data with <25% outliers. There was sufficient acceptable data to establish recommended values for 17 elements and information values for a further 15 elements. In addition, a recommended value was established for methylmercury. The estuarine sediment sample, IAEA-405, can be used as a reference material for quality control in the determination of trace elements and methylmercury in moderately polluted sediments.
Introduction
A fundamental requirement for the monitoring and assessment of marine contamination is accurate analytical data for pollutant concentrations in the various environmental compartments. For this purpose, the analytical methods used by the laboratories need to be tested and validated. Moreover, laboratories must adopt good Quality Assurance/Quality Control (QA/QC) practices. Proper analytical quality control requires the regular use of representative reference materials; i.e., material similar in composition and concentration to the subject sample matrix, but having known concentrations of the analytes of interest. Without a representative and reliable reference material, it is difficult if not impossible to verify the accuracy of a result. Indeed, the routine practice of validating data with materials of known composition should be a continuous and regular process in order to obtain maximum confidence in the data set.1,2 Another essential aspect of quality control is periodic external performance assessments, e.g., via regular participation in blind interlaboratory analytical comparison exercises.3,4 Interlaboratory comparisons are not only essential for checking the accuracy of a laboratory's analytical results, but also serve to stimulate better analytical performance.2,4Materials used for interlaboratory comparison exercises must be homogeneous so that all participants receive the same sample, and ultimately be well-characterised for the analytes of interest so that there is some basis for assessing analytical performance. In fact, these requirements adequately define a reference material. Provided that certain statistical and technical criteria are met (e.g., enough data sets are received, multiple analytical techniques are employed, etc.), the results received from the intercomparison participants can be combined and statistically evaluated to characterise a subject sample such that it can be used subsequently as a reference material.5–8
The Marine Environmental Studies Laboratory (MESL) of IAEA-MEL has conducted intercomparison exercises on trace metals and organic compounds since 1973.6,9 Such exercises are now organised on a regular basis, with participation for the laboratories being cost-free.
This paper describes the results of a global intercomparison exercise conducted during 1998 that was undertaken for the determination of trace elements and methylmercury in an estuarine sediment sample. The study is unique due to the quantity and breadth of participation; recommended values were determined from 120 sets of data from 55 countries. The statistical evaluation of the results is presented for each element, and includes comparisons between results obtained from different analytical methods.
Methodology
Collection and preparation of the material
A large quantity of sediment was collected in 1998 from the intertidal mudflats of the Tagus estuary (Portugal) for use as an intercomparison material. It was deep-frozen, freeze-dried, ground and sieved. The sediment fraction of particle size less than 150 µm was further homogenised by mixing in a stainless steel rotating drum for two weeks. After checking for the homogeneity of the sample material (see below), aliquots of about 35 g were packed into cleaned brown borosilicate glass bottles with Teflon lined screw caps and sealed in plastic bags. A total of 530 bottles was produced.10Homogeneity tests
Extensive homogeneity tests were carried out on this material in order to ensure its suitability as an intercomparison sample. A preliminary test was performed on Cu, Mn and Zn, before final bottling and sample dispatch to laboratories. Samples were analysed by flame atomic absorption spectrophotometry (F-AAS) after complete mineralisation by a mixture of hydrofluoric, nitric and hydrochloric acids (HF ∶ HNO3 ∶ HCl).11 The between-bottle homogeneity was verified based on aliquots from 10 bottles taken randomly from the bulk powder, whereas the within-bottle homogeneity was assessed by 5 replicate determinations of the contents of one bottle. A F-test at a significance level of 0.05 did not detect any difference between the resulting variances so no inhomogeneity was suspected.A final homogeneity test was conducted after completion of the bottling of sample material. The between-bottle homogeneity was tested by the determination of the concentration of some typical elements (Cu, Fe, Mn, Zn) based on sample intakes of 0.1 g and 0.2 g taken from 15 bottles that were set aside at regular intervals throughout the bottling procedure. The within-bottle homogeneity was assessed by 15 replicate determinations on the re-homogenised content of one bottle.
The coefficients of variation (CV) obtained from these replicate analyses are presented in Table 1, and should be compared with the ‘method’ CV, which was obtained via multiple analyses of the same digest solution. A F-test at a significance level of 0.05 was performed for the different metals and did not reveal significant differences between the within- and between-bottle variances for 100 mg intakes. A difference in the CVs was only found for Fe for a 200 mg test portion, with slightly higher between-bottle than within-bottle variance, but no inhomogeneity was detected for a 100 mg portion. The within-bottle CVs are close to the CVs of the method for Cu, and slightly higher for Fe, Mn and Zn. This represents the additional uncertainty related to the mineralisation step, which is not taken into account in the method-CV calculation (replicate analysis of one digest solution). In conclusion, the material was considered to be homogeneous at an analytical portion of 100 mg and above for trace elements and, therefore, suitable for use as an intercomparison sample.
| Element | Between-bottlea CV (%) | Within-bottleb CV (%) | Methodc CV (%) |
|---|---|---|---|
| a Single determination on the content of each of 15 bottles. b 15 replicate determinations on the content of one bottle. c 14 replicates of a digest solution. CV, Coefficient of variation (or relative standard deviation). | |||
| 100 mg | |||
| Cu | 3.9 | 5.3 | 4.2 |
| Fe | 2.9 | 2.6 | 1.8 |
| Mn | 6.1 | 3.9 | 3.6 |
| Zn | 5.1 | 5.3 | 1.1 |
| 200 mg | |||
| Cu | 4.2 | 3.8 | |
| Fe | 5.1 | 2.3 | |
| Mn | 8.0 | 6.7 | |
| Zn | 5.5 | 4.0 | |
Stability tests
The stability of several trace metals was tested to determine the suitability of this material as a candidate RM. Five bottles of the IAEA-405 material were stored in the dark at +20 °C, −20 °C and +60 °C over a period of 17 months, starting in September 1998, and the measurement of total Hg, Cu, Fe, Mn and Zn was performed at regular intervals. Instability would be detected by noting disparities in the concentrations of different elements between samples stored at different temperatures and those stored at a low temperature at the various occasions of analysis.Tests were made at the beginning of the storage period and after 3, 6 and 12 months (3 and 17 months for Hg). Concentrations of Cu, Fe, Mn and Zn were determined using the same procedure as for the homogeneity study (F-AAS). Samples were analysed for Hg by cold vapour atomic absorption spectrometry (CV-AAS) after nitric acid digestion in closed Teflon tubes at 90 °C for 3 h. Trace elements were each determined five times (one replicate analysis of five bottles stored at different temperatures) on each occasion of analysis. The material stored at −20 °C was used as reference for the samples stored at +20 °C and at +60 °C, respectively. The normalised results of the stability study are presented in Table 2. This table gives the ratios (RT) of the mean values (XT) of five measurements made at +20 °C and at +60 °C, respectively, to the mean value (X−20 °C) of five determinations made on the same day of analysis of samples stored at a temperature of −20 °C:
 | (1) |
| Element | Time/months | R T ± UTa | |
|---|---|---|---|
| +20 °C | +60 °C | ||
| a R T = ratio of the mean values (XT) of five measurements made at +20 °C and +60 °C, respectively, and the mean value (X−20 °C) from five determinations made on the same occasion of analysis on samples stored at temperature of −20 °C (eqn. [1]). b U T = uncertainty obtained from the coefficient of variation (CV) of five measurements obtained at each temperature (eqn. [2]). | |||
| Hg | 3 | 0.97 ± 0.05 | 0.98 ± 0.05 |
| 17 | 0.98 ± 0.06 | 1.03 ± 0.15 | |
| Cu | 3 | 1.01 ± 0.02 | 1.01 ± 0.03 |
| 6 | 1.02 ± 0.04 | 1.07 ± 0.06 | |
| 12 | 0.99 ± 0.05 | 1.00 ± 0.04 | |
| Fe | 3 | 0.99 ± 0.02 | 0.99 ± 0.02 |
| 6 | 0.96 ± 0.03 | 1.00 ± 0.01 | |
| 12 | 1.01 ± 0.03 | 1.02 ± 0.02 | |
| Mn | 3 | 1.01 ± 0.02 | 1.02 ± 0.02 |
| 6 | 1.09 ± 0.10 | 1.09 ± 0.07 | |
| 12 | 1.01 ± 0.03 | 0.99 ± 0.01 | |
| Zn | 3 | 1.01 ± 0.04 | 1.00 ± 0.04 |
| 6 | 0.98 ± 0.03 | 1.03 ± 0.05 | |
| 12 | 1.00 ± 0.02 | 1.02 ± 0.01 | |
The uncertainty UT has been calculated from the coefficient of variation (CV) of 5 measurements obtained at each temperature:
 | (2) |
In case of ideal stability, the ratios (RT) should be 1. In practice, however, there are some random variations due to the error of the measurements. In almost all the cases, RT − UT ≤ 1 ≤ RT + UT for the five elements. The uncertainty in the CVs can account for the deviations observed. No systematic change in concentrations for the different elements was detected during the time period investigated. On the basis of these results, it was concluded that no instability of the material could be demonstrated. This material will continue to be monitored at regular intervals.
Intercomparison exercise
An intercomparison exercise was conducted during 1998 and 1999 for the determination of trace elements and methylmercury in this estuarine sediment sample. This study was intended to give laboratories responsible for trace element analyses of marine biota an opportunity to check analytical performance. In May 1998, the bottles of sample material were dispatched to about 180 laboratories. The deadline for returning the results was 30 November 1998, but subsequently was extended to the end of February 1999.Each participating laboratory received one lyophilised sample of estuarine sediment material, accompanied by an information sheet and a report form. The sample originated from the batch of homogenised material prepared as described previously. Participants were requested to determine by their routine procedures as many trace elements as possible out of the following 18 elements: Al, As, Cd, Co, Cr, Cu, Fe, Hg (total and methyl mercury), Li, Mn, Ni, Pb, Sb, Se, Sn, Sr, V and Zn. Special emphasis was to be given for the determination of Al, Cd, Cr, Cu, Hg, Pb and Zn. The IAEA was also interested in receiving results for any other element(s) that participating laboratories determine routinely. Participating laboratories were requested to make at least three, but preferably six, independent replicate determinations for each element and to report all results, including the average weight of the sample taken for analysis, the concentration of each independent replicate determination, the arithmetic mean and the standard deviation (sn−1) of the replicate determinations and the detection limit of the method. Additional information requested included a summary of quality control procedures routinely employed within their laboratory and the results for Certified Reference Materials analysed concurrently, the drying procedure (all results were to be reported on a dry-weight basis), the pre-treatment or separation methods used (e.g. mineralisation procedure), the instrumental method used for the quantitative determination, and the way in which calculation of results was performed.
In total, 120 laboratories from 55 countries participated in this intercomparison exercise and reported results for up to 58 elements. Methylmercury results were provided by 14 laboratories.
Data evaluation
For each of the data sets, the range of determinations, arithmetic mean and standard deviation were compiled for each element, based on the laboratory means. Laboratory means were subjected to four statistical tests: Dixon, Grubbs, Skewness and Kurtosis. Any result failing one or more test was rejected as an outlier and the remaining data was retested until no further outliers were detected. These tests were applied at a significance level of 95%.2,12 The Cochran test was applied in some cases in order to point out extreme values of within laboratory variance that should be considered as outliers.In order to establish the reference values, the quality assurance data reported by the laboratories (i.e., results of analyses of representative-matrix CRMs) were also taken into consideration. Results submitted by laboratories that did not report any quality assurance information were pointed out and the reported means were systematically considered as “outliers”. Data from laboratories reporting CRM results that far exceeded the acceptable range were scrutinised and were also rejected as “outliers”.
The analytical methods influenced the laboratory means in some cases. In particular, destructive methods (i.e., digestion) without the use of HF systematically resulted in lower values for 4 refractory elements (i.e., Al, Cr, Fe, V) in comparison to results obtained using total digestion techniques with HF or to non-destructive methods (e.g., neutron activation analysis). This “method” effect was considered for the establishment of the reference values. Extremely low results obtained with incomplete digestion methods were considered as “outlier” values.11
The remaining laboratory means were used to calculate an overall arithmetic mean, standard deviation and 95% confidence interval of the mean for each element. A summary of the results is presented in Table 3. Only elements for which more than 2 laboratories reported results are included in this table. This table provides information of two types:
| Analyte | Accepted results/mg kg−1 | All reported results/mg kg−1 | |||||||||||
|---|---|---|---|---|---|---|---|---|---|---|---|---|---|
| No. of lab means | Range of lab. means | Reference value (mean) | 95% Confidence interval | Stdev. | RSD (%) | Class | No. of lab. means | No. of indiv. results | Mean | Stdev. | Range of lab. means | Outliers (%) | |
| a Recommended values are given in bold; Information values given in bold italics. Non-classified values are italicized, and are not considered reference values. | |||||||||||||
| Ag | 3 | 0.858–1.009 | 0.939 | 0.076 | 8.1 | 5 | 24 | 5.491 | 9.512 | 0.858–22.48 | 40 | ||
| Al | 37 | 31900–93190 | 77900 | 72740–83074 | 15500 | 19.9 | C | 55 | 290 | 70877 | 22567 | 3270–100100 | 33 |
| As | 47 | 16.8–28.1 | 23.6 | 22.9–24.4 | 2.5 | 10.5 | A | 62 | 333 | 28.8 | 33.4 | 4.272–275.0 | 24 |
| Ba | 2 | 470–502 | 486 | 5 | 28 | 307.7 | 196.6 | 97.4–502 | 60 | ||||
| Br | 4 | 70.0–100.3 | 85 | 60.3–108.9 | 15 | 18.1 | C | 4 | 24 | 84.6 | 15.3 | 70.0–100.3 | 0 |
| Ca | 3 | 13700–24900 | 20800 | 6200 | 29.8 | 4 | 22 | 23263 | 7020 | 13700–30550 | 25 | ||
| Cd | 63 | 0.124–1.260 | 0.73 | 0.678–0.781 | 0.20 | 28.1 | B | 89 | 475 | 1.296 | 1.996 | 0.056–11.690 | 29 |
| Ce | 3 | 80.6–83.8 | 82.1 | 1.6 | 2 | 5 | 28 | 85.3 | 4.5 | 77.0–103.0 | 40 | ||
| Co | 50 | 8.0–19.0 | 13.7 | 13.0–14.3 | 2.3 | 17 | A | 65 | 359 | 15.4 | 8.5 | 0.169–62.2 | 23 |
| Cr | 63 | 50.8–119.2 | 84 | 80.2–87.8 | 15 | 17.8 | B | 93 | 510 | 75 | 24.6 | 0.292–141.0 | 32 |
| Cs | 4 | 11.30–14.12 | 12.5 | 10.4–14.6 | 1.3 | 10.5 | C | 5 | 30 | 13 | 1.5 | 11.30–14.70 | 20 |
| Cu | 80 | 35.0–60.0 | 47.7 | 46.5–48.8 | 5.1 | 10.6 | A | 101 | 555 | 49.9 | 22.1 | 0.030–229.7 | 21 |
| Eu | 5 | 1.00–1.71 | 1.25 | 0.89–1.61 | 0.29 | 22.9 | C | 6 | 36 | 1.3 | 0.29 | 1.00–1.71 | 17 |
| Fe | 64 | 31000–43800 | 37400 | 36769–38043 | 2600 | 6.8 | B | 88 | 478 | 35856 | 8465 | 334–70800 | 27 |
| Ga | 2 | 16.0–20.0 | 18 | 3 | 15 | 19 | 2.6 | 16.0–21.0 | 33 | ||||
| Hf | 3 | 5.40–6.05 | 5.80 | 4.93–6.67 | 0.35 | 6 | C | 4 | 21 | 6.1 | 0.66 | 5.40–7.00 | 25 |
| Hg | 60 | 0.494–1.193 | 0.81 | 0.777–0.848 | 0.14 | 17.1 | A | 75 | 403 | 0.92 | 0.913 | 0.013–8.200 | 20 |
| MeHg | 12 | 0.00393–0.00701 | 0.00549 | 0.00497–0.00602 | 0.00083 | 15.1 | A | 14 | 72 | 0.0256 | 0.0744 | 0.00393–0.284 | 14 |
| K | 5 | 15200–29800 | 24900 | 17724–31996 | 5700 | 23.1 | C | 8 | 43 | 21576 | 9101 | 2450–29800 | 38 |
| La | 5 | 34.60–50.0 | 40.4 | 33.0–47.7 | 5.9 | 14.6 | C | 6 | 36 | 38.7 | 6.7 | 30.2–50.0 | 17 |
| Li | 25 | 31.20–94.61 | 72 | 64.9–79.1 | 17 | 23.9 | A | 32 | 172 | 82.7 | 55.8 | 1.617–353.0 | 22 |
| Lu | 3 | 0.390–0.538 | 0.468 | 0.284–0.653 | 0.074 | 15.9 | C | 3 | 18 | 0.468 | 0.07 | 0.390–0.538 | 0 |
| Mg | 13 | 9600–14663 | 12300 | 11392–13109 | 1400 | 11.6 | B | 20 | 110 | 15900 | 905 | 9600–37800 | 35 |
| Mn | 52 | 402.63–591.13 | 495 | 483–505 | 39 | 7.8 | B | 81 | 445 | 493 | 210 | 12.00–1855.16 | 36 |
| Mo | 3 | 0.591–4.80 | 2.0 | 2.4 | 117 | 3 | 15 | 2.05 | 2.39 | 0.591–4.80 | 0 | ||
| Na | 3 | 15900–18520 | 17500 | 13989–21091 | 1400 | 8.2 | 5 | 25 | 14191 | 7135 | 1570–18520 | 40 | |
| Ni | 61 | 19.95–47.10 | 32.5 | 31.1–33.9 | 5.3 | 16.4 | A | 76 | 411 | 43.3 | 77 | 0.039–686 | 20 |
| Pb | 74 | 50.5–100.0 | 74.8 | 72.6–77.0 | 9.4 | 12.6 | B | 102 | 553 | 73.2 | 22.6 | 0.063–125.019 | 27 |
| Rb | 5 | 17.30–223.0 | 140 | 80 | 58.4 | 7 | 40 | 146.8 | 68.1 | 17.30–223.0 | 29 | ||
| Sb | 21 | 1.017–2.690 | 1.81 | 1.62–2.00 | 0.42 | 23.1 | A | 28 | 154 | 4.2 | 6.87 | 0.390–31.0 | 25 |
| Sc | 3 | 12.70–14.30 | 13.5 | 11.53–15.51 | 0.8 | 5.9 | C | 4 | 24 | 14.02 | 1.19 | 12.70–15.50 | 25 |
| Se | 12 | 0.253–0.700 | 0.44 | 0.31–0.56 | 0.19 | 42.8 | B | 20 | 102 | 1.67 | 0.31 | 0.210–11.00 | 40 |
| Sm | 4 | 6.59–7.14 | 6.86 | 6.49–7.21 | 0.23 | 3.3 | C | 5 | 27 | 7.1 | 0.59 | 6.59–8.10 | 20 |
| Sn | 17 | 2.85–10.67 | 7.59 | 6.29–8.89 | 2.53 | 33.3 | A | 21 | 118 | 11.62 | 1.27 | 2.85–55.0 | 19 |
| Sr | 28 | 37.80–163.0 | 118 | 103–132 | 36 | 30.9 | C | 34 | 189 | 122 | 54 | 37.4–350 | 18 |
| Tb | 3 | 0.803–1.128 | 0.93 | 0.507–1.360 | 0.17 | 18.4 | C | 3 | 18 | 0.934 | 0.172 | 0.803–1.128 | 0 |
| Th | 5 | 12.20–16.75 | 14.3 | 12.1–16.4 | 1.7 | 11.8 | C | 6 | 36 | 14.02 | 1.61 | 12.20–16.75 | 17 |
| Ti | 2 | 4730–4870 | 4800 | 3 | 16 | 4820 | 80 | 4730–4870 | 33 | ||||
| U | 5 | 1.88–3.92 | 3.0 | 1.86–4.16 | 0.9 | 30.6 | C | 5 | 30 | 3.01 | 0.92 | 1.88–3.92 | 0 |
| V | 29 | 52.8–131.0 | 95.4 | 90.2–100.6 | 13.7 | 14.4 | B | 40 | 223 | 85.6 | 26.8 | 13.8–134 | 28 |
| Y | 2 | 13.0–34.0 | 23.5 | 3 | 14 | 25 | 10.8 | 13.0–34.0 | 33 | ||||
| Yb | 4 | 2.61–3.81 | 3.04 | 2.19–3.89 | 0.53 | 17.5 | C | 4 | 24 | 3.04 | 0.53 | 2.61–3.81 | 0 |
| Zn | 87 | 184.9–378.0 | 279 | 272–287 | 34 | 12.3 | A | 106 | 589 | 275 | 79 | 0.326–831.2 | 17 |
| Zr | 3 | 147–368 | 243 | 113 | 46 | 4 | 21 | 232 | 95 | 147–368 | 25 | ||
(a) on the reported results: number of laboratory means and of individual determinations, mean and standard deviation of laboratory means, range of laboratory means, percentage of outliers;
(b) on the accepted results: number of accepted laboratory means, range of the laboratory means, overall arithmetic means, standard deviations, relative standard deviations and 95% confidence interval for the means.
The calculated means were not automatically used as the recommended or information values. All the data were carefully reviewed and additional information, such as concentration level, number of different analytical methods used, number of laboratory means and percentage of outliers, was considered before assigning the recommended mean values and associated confidence intervals to the analytes.13 Criteria used for obtaining reference values are indicated below:
1. For a given concentration range the relative uncertainty of the overall arithmetic mean (relative standard deviation) does not exceed the following limits:
100 − 500 mg kg−1 ± 20%
10 − 100 mg kg−1 ± 30%
0.1 − 10 mg kg−1 −50%; + 60%
<0.1 mg kg−1 −50%; + 100%
2. The overall mean is based on data obtained by at least two different methods.
3. The relative number of laboratory means rejected as outliers does not exceed: (a) 25%; (b) 50%; (c) 0% (no outlier).
4. The overall mean is calculated on the basis of at least the following number of laboratory means: (a) 10; (b) 5; (c) 3.
On the basis of these criteria, three classes of Reference Material are defined: two classes (A and B) for ‘Recommended values’ and 1 class (C) for ‘Information only value’. For simplification, the subsequent discussion will distinguish only between ‘Recommended values’ and ‘Information only values’.
Class A: when criteria 1, 2, 3 (a) and 4 (a) are fulfilled.
Class B: when criteria 1, 2, 3 (a) and 4 (b), or 1, 2, 3 (b) and 4(a) are fulfilled.
Class C: Information only value when at least criteria 3 (c) and 4 (c), or 3 (b) and 4 (b) are fulfilled and the confidence interval is reasonable for a given concentration level.
Results and discussion
The summary of the results including the classification of the data is indicated in Table 3. Recommended values were assigned for 17 elements (9 class “A” and 8 class “B”) and information values for 15 elements (class “C”). In addition, a recommended value was established for methylmercury (class A). The largest number of results (≥20) was reported for Al, As, Cd, Co, Cr, Cu, Fe, Hg, Li, Mg, Mn, Ni, Pb, Sb, Se, Sn, Sr, V and Zn. For 24 elements only a few results were obtained and reference values could not be assigned. Fig. 1 depicts S-plots showing all laboratory mean values reported in increasing concentration for a representative class “A” element (Cu), a representative class “B” element (Fe), and a representative class “C” element (Al).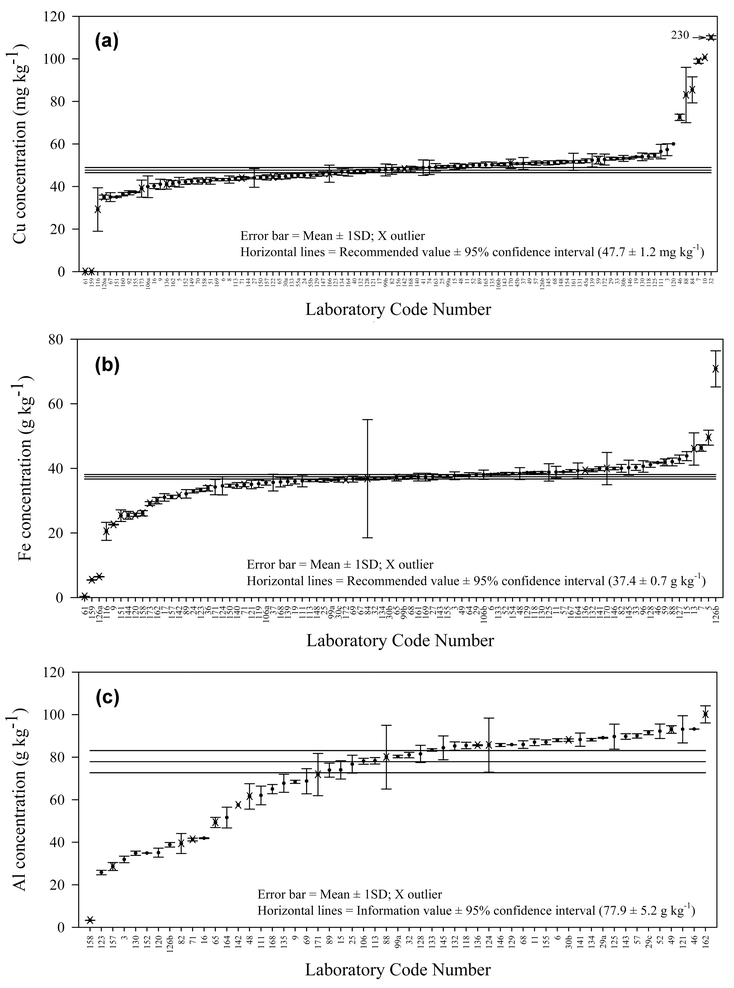 | ||
| Fig. 1 (a) Example of a ‘A’-classified element: S-plot of all Cu concentrations; (b) Example of a ‘B’-classified element: S-plot of all Fe concentrations; (c) Example of a ‘C’-classified element: S-plot of all Al concentrations. | ||
The results that have been classified as information values should be used with caution. Information values were assigned to some elements because too few results were reported for them to be classified as recommended values, and/or the results were obtained using only one analytical method. Information values were also assigned to mean values with exceedingly large uncertainties and to those having too many outliers, which indicated that problems existed with the analyses of these elements.
A review of Table 3 reveals that the degree of agreement between analysts was inadequate for many elements. The agreement was generally acceptable after removal of outlying means (i.e., means reported by laboratories without acceptable quality control and statistical outliers). The coefficients of variation (calculated from all accepted means) were for example <15% for As, Cs, Cu, Fe, La, Mg, Mn, Pb, Sm, Th, V, and Zn, and <20% for Al, Br, Co, Cr, Hg, MeHg, Ni, and Yb.
The analytical methods used by the different laboratories are summarised in Fig. 2. The wide range of methods employed permits a statistically valid comparison of the principal methods used, particularly the instrumental methods following sample digestion and the “non-destructive” techniques such as neutron activation analysis (NAA) and X-ray fluorescence (XRF). The analytical techniques ranked in order of those applied most frequently, except for volatile elements such as Hg, As, Sb, Se, and Sn, were: F-AAS, inductively coupled plasma atomic emission spectrometry (ICP-AES), graphite furnace atomic absorption spectrophotometry (GF-AAS), inductively coupled plasma mass spectrometry (ICP-MS), NAA, and finally XRF. Only one laboratory used polarography. Several laboratories used hydride generation (Hydr-) with AAS or atomic fluorescence spectrophotometry (AFS) detection for the determination of As, Sb, Se, and Sn. For the determination of total Hg, the majority of laboratories used cold vapour (CV)-AAS, followed by CV-AFS, and only a few laboratories used NAA, ICP-MS, ICP-AES, FAAS or GF-AAS.
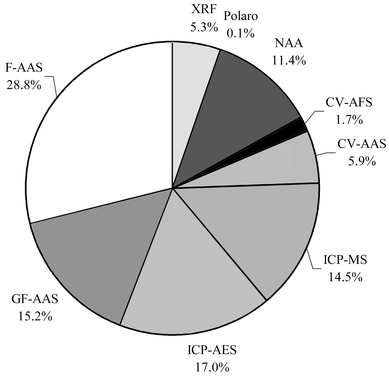 | ||
| Fig. 2 Percentage of the analytical methods used by the different laboratories. | ||
Most of the laboratories employed wet ashing as the sample pre-treatment procedure, which was the preferred method for analysis by AAS and ICP. Most analysts used total decomposition with a mixture of acids including hydrofluoric acid (HF).11 However, a number of laboratories did not include HF in their mineralisation procedure and this caused incomplete dissolution of the sediment matrix and lower metal concentrations for Al, Cr, Fe, and V. Statistically significant different means were detected between the 2 treatments for these 4 metals (i.e., using ANOVA and least significant difference multiple range test at P = 0.05).14 Similarly, low results due to incomplete digestion techniques were observed for Al and Cr in a previous intercomparison exercise of sediment sample IAEA-356.13 It is perhaps surprising to note that good agreement between diverse digestion techniques was obtained for many other elements. Clearly digestion of the total matrix was often incomplete but nevertheless strong acid digestion was sufficient to release most elements. It would be hazardous, however, to generalise and to consider this result to hold for all mineral matrices.
In order to examine the relative precision and accuracy of different instrumental techniques, the complete data set for selected elements (i.e., all reported laboratory means) was categorised according to the different analytical methods and represented as multiple box-and-whisker plots. A few representative plots are shown in Fig. 3. The effect of different pre-treatment and instrumental methods was also tested using ANOVA and least significant difference multiple range test at P = 0.05.14 The results are discussed below for individual elements.
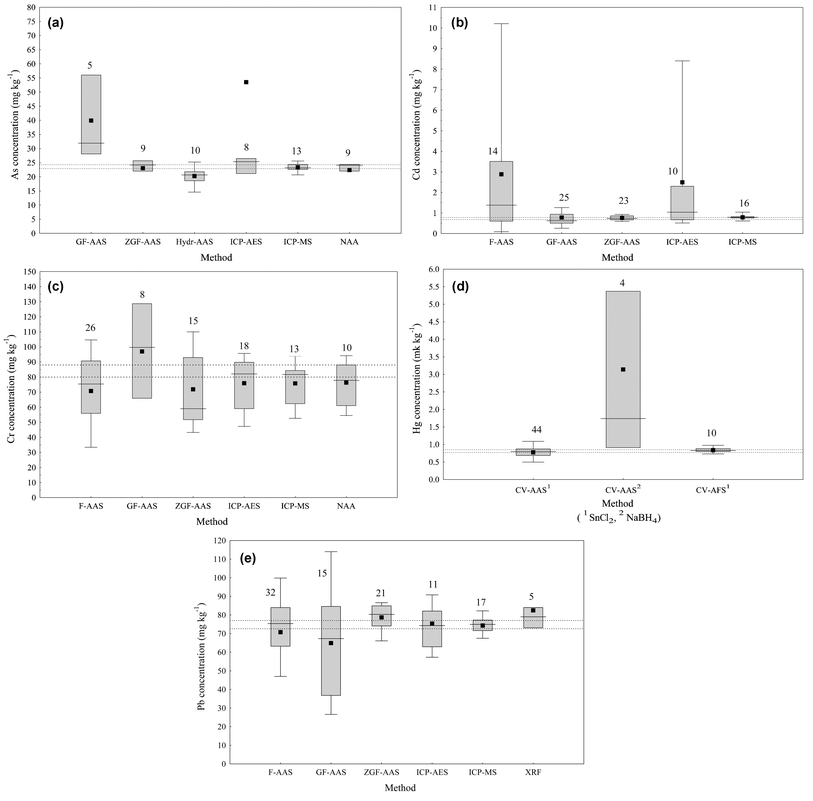 | ||
| Fig. 3 Comparison of analytical methods for selected elements. (F-AAS: flame atomic absorption spectrophotometry; GF-AAS: graphite furnace atomic absorption spectrophotometry; ZGF-AAS: graphite furnace AAS with Zeeman background correction; ICP-AES: inductively coupled plasma atomic emission spectrometry; ICP-MS: inductively coupled plasma mass spectrometry; NAA: neutron activation analysis; XRF: X-ray Fluorescence; CV-AAS: cold vapour AAS; Hydr-AAS: hydride generation AAS; CV-AFS: cold vapour atomic fluorescence spectrophotometry). To be included in the plot, a method required values from at least 4 laboratories. On these graphs, a box encloses the middle 50% of the data, the median is represented as a horizontal line crossing the box and the mean is plotted as a filled square. The whiskers represent the 10 and 90 percentiles, but are only displayed when there are at least 10 measurements in the data set. The number of measurements represented by each data set is reported above the box. (a) Concentration of As, categorised by analytical method used; (b) Concentration of Cd, categorised by analytical method used; (c) Concentration of Cr, categorised by analytical method used; (d) Concentration of Hg, categorised by analytical method used; (e) Concentration of Pb, categorised by analytical method used. | ||
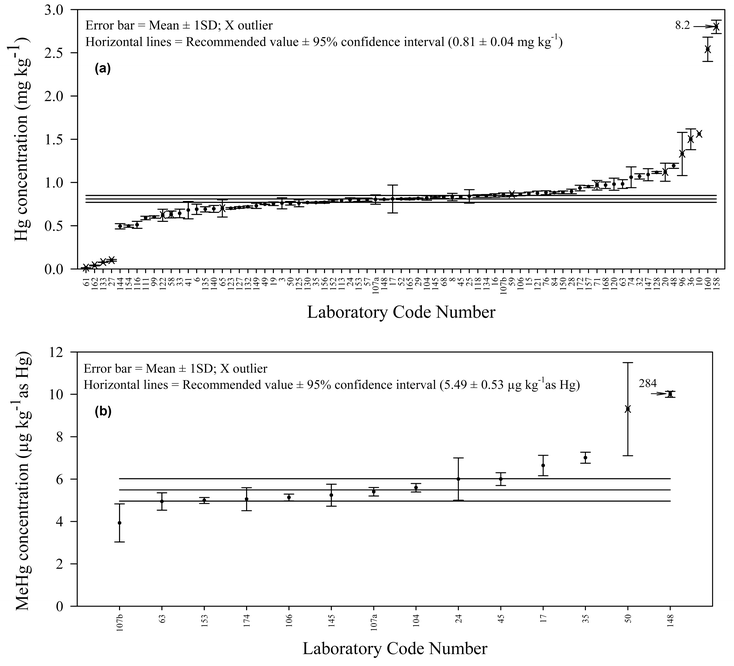 | ||
| Fig. 4 (a) S-plot of all Hg concentrations; (b) S-plot of all MeHg concentrations. | ||
Organomercury compounds
The aim of the study was to compare results for methylmercury (MeHg) as obtained by different methods. Fourteen laboratories reported results for MeHg using various isolation procedures and detection systems (Table 4). In the very first step, when MeHg was released from the binding sites, three techniques were used: distillation, alkaline digestion and acid leaching. Further processing included additional separation using ion-exchange separation of organic and inorganic mercury, solvent extraction with or without a clean-up step (using equilibration into aqueous cysteine or thiosulfate solution) and derivatisation by aqueous phase ethylation and GC separation. The detection systems included cold vapour atomic absorption spectrophotometry (CV-AAS), gas chromatography (GC) combined with cold vapour atomic fluorescence spectrophotometry (CV-AFS), GC with electron capture detector (GC-ECD) and HPLC with CV-AFS.| Lab./method code | Isolation procedure | Detection techniquea | Detection limit/ng g−1 | CRM used |
|---|---|---|---|---|
| a GC: gas chromatography; AFS: atomic fluorescence spectrophotometry; CV-AAS: cold vapour atomic absorption spectrophotometry; ECD: electron capture detector; HPLC: high performance liquid chromatography. n.r. : method not reported. | ||||
| 17 | Distillation; aqueous phase ethylation | GC-AFS | 0.05 | IAEA-356 |
| 24 | Extraction HBr-toluene; back extraction cysteine chloride | CV-AAS (Hg-organic) | 1 | IAEA-356 |
| 35 | Digestion KOH–EtOH; Extraction dithizone–toluene; Na2S back extraction; re-extraction dithizone–toluene | GC-ECD (packed column) | 0.5 | IAEA-356 |
| 45 | Distillation; anion exchange; UV decomposition; single Au-amalgamation | CV-AAS (Hg-organic) | 2 | SRM-2974 |
| 50 | Saponification; aqueous phase ethylation | GC-AFS | TORT | |
| 63 | Distillation; aqueous phase ethylation | GC-AFS | 0.005 | IAEA-356 |
| 99 | Citrate buffer + extraction dithizone–chloroform; back extraction in sodium thiosulfate | HPLC-AFS | 10 | CRM-580 |
| 104 | Distillation; aqueous phase ethylation | GC-AFS | IAEA-356 | |
| 106 | Acid leaching (HNO3 4 M); extraction CH2Cl2; aqueous phase ethylation; collection on Tenax | GC-AFS | 0.6 | IAEA-356 |
| 107A | Digestion in acidic KBr–CuSO4; extraction CH2Cl2; aqueous phase ethylation, collection on Tenax | GC-AFS | 0.2 | IAEA-356 |
| 107B | n.r. | GC-ECD | CRM-463 | |
| 145 | Distillation; aqueous phase ethylation | GC-AFS | 0.01 | DORM-2 |
| 148 | n.r. | CV-AAS (Hg-organic) | ||
| 153 | Acid-KBr + extraction CH2Cl2 ; aqueous phase ethylation; carbotrap | GC-AFS | 0.012 | IAEA-356 |
| 172 | Acid leaching (HNO3) in microwave oven; CH2Cl2 extraction; aqueous phase ethylation; collection on Tenax | Headspace GC-AFS | 0.20 | IAEA-356 |
The laboratories' means were plotted in ascending concentration values (Fig. 4b). Laboratory No. 99 reported values as below the detection limit of their analytical methods. Laboratory No. 107 reported 2 sets of results using different analytical techniques. Thus, a total of 14 mean values above detection limit was obtained. Data varied between 0.00393 and 0.284 mg kg−1. For comparison purposes, the S-plot for total Hg is also depicted (Fig. 4a). Both constituents received “A” classifications.
Two values identified by Grubbs and Dixon tests (Lab. No. 50 and 148) were clearly outliers and corresponded to the laboratories that did not report results for a representative certified reference material. Laboratory No. 50 used saponification and aqueous phase ethylation as the pre-treatment method coupled with GC-AFS, and laboratory No. 148 used CV-AAS as the detection method, but the extraction procedure was not reported.
For the remainder of the results, data were in very good agreement considering the different techniques involved. Close examination of the data could not show that differences in the means were related to the methods used. In particular, there was no difference in the mean results obtained by acid leaching followed by solvent extraction (Lab. code 24, 106, 107A, 153, 172) compared to distillation (Lab. code 17, 45, 63, 104, 145). Contrary to previous observations reported in the literature, in particular concerning sediment rich in organic matter, acid leaching alone seems to be sufficient to release methylmercury compounds from the IAEA-405 sediment quantitatively.13,17 It should be noted that this sediment has a relatively low carbon content (2.6%).
The consensus value for methylmercury compounds was calculated taking into account the results obtained by 12 laboratories/methods. Accepted laboratory means varied between 0.00393 and 0.00701 mg kg−1. The recommended value is 0.00549 mg kg−1 with the 95% confidence interval from 0.00496 to 0.00602 mg kg−1. This intercomparison exercise has shown that because a substantial number of laboratories world-wide are performing methylmercury analyses using various specific separation methods and sensitive detection systems, certification of methylmercury compounds in different sediment and environmental samples should not be a problem in the future, even at these relatively low levels.
Conclusions
The IAEA-405 worldwide intercomparison exercise attracted many participants for the determination of trace elements in an estuarine sediment sample. As specified statistical and technical criteria for assigning reference values were fulfilled for 32 elements and methylmercury, the sample can now be used as a Reference Material for quality control of data in the determination of trace elements and methylmercury in coastal sediment samples. Moreover, this exercise underscored the importance of complete decomposition of sediment material with HF for obtaining accurate results for trace element content. Effects of a partial digestion (using no HF) were indeed detected on the IAEA-405 sample for Al, Cr, Fe and V.Acknowledgements
The IAEA, Marine Environment Laboratory operates under an agreement between the International Atomic Energy Agency and the Government of the Principality of Monaco. This work was supported by the Inter-agency Programme on Marine Pollution agreed upon between UNEP, IAEA and IOC-UNESCO.References
- IAEA, Contaminant monitoring programmes using marine organisms: Quality Assurance and Good Laboratory Practice. Reference Methods for Marine Pollution Studies, 57, IAEA, Vienna, Austria, 1990, pp. 11–13 Search PubMed.
- J. K. Taylor, Quality assurance of chemical measurements, Lewis Publishers Inc., Boca Raton, FL, USA, 1987, pp. 159–163 Search PubMed.
- C. Ibe and G. Kullenberg, Mar. Pollut. Bull., 1995, 31, 209 CrossRef.
- H. O. F. Andersson, Accredit. Qual. Assur., 1998, 3, 224 CrossRef.
- J. Pauwels, A. Lamberty and H. Schimmel, Accredit. Qual. Assur., 1998, 3, 180 CrossRef.
- M. Coquery, F. P. Carvalho, S. Azemard and M. Horvat, Sci. Total Environ., 1999, 237(238), 501 CrossRef.
- M. Coquery, F. P. Carvalho, M. Horvat and S. Azemard, Report on the world-wide intercomparison exercise IAEA-140 for the determination of trace elements in Fucus sample, IAEA/AL/139 (IAEA/MEL/64), IAEA, Monaco, 1997 Search PubMed.
- R. Becker, I. Nehls and U. Dorgerloh, Accredit. Qual. Assur., 2003, 8, 150 Search PubMed.
- F. P. Carvalho, IAEA Bull., 1998, 40, 7 Search PubMed.
- M. Coquery, S. Azemard and S. de Mora, Report on the world-wide intercomparison exercise for the determination of trace elements and methylmercury in estuarine sediment IAEA-405, IAEA/AL/127 (IAEA/MEL/70), IAEA, Monaco, 2000 Search PubMed.
- IAEA, Manual for the geochemical analyses of marine sediments and suspended particulate matter, 63, IAEA, Monaco, 1995, pp. 17–27 Search PubMed.
- ISO, Certification of reference materials - General and statistical principles, Guide 35, Rev. 1, ISO, Geneva, Switzerland, 2000 Search PubMed.
- M. Horvat, L. Mee and B. Oregioni, Report on the world-wide and regioinal intercomparison run IAEA-356 trace elements in polluted marine sediment, IAEA/AL/080 (IAEA/MEL/56), IAEA, Monaco, 1994 Search PubMed.
- J. C. Miller and J. N. Miller, Statistics for Analytical Chemistry, Ellis Horwood Limited, West Sussex, 1993, pp. 65–71 Search PubMed.
- M. Coquery, F. P. Carvalho, S. Azemard, M. Bachelez and M. Horvat, Fresenius J. Anal. Chem., 2000, 366, 792 CrossRef CAS.
- L. Mee and B. Oregioni, Report on the world-wide intercomparison of trace elements measurements in marine sediments SD-M-2/TM, IAEA/AL/053, IAEA, Monaco, 1991 Search PubMed.
- M. Horvat, V. Mandic, L. Liang, N. S. Bloom, S. Padberg, Y.-H. Lee, H. Hintelmann and J. Benoit, Appl. Organomet. Chem., 1994, 8, 533 CrossRef CAS.
| This journal is © The Royal Society of Chemistry 2004 |