Slow modes of polarization in purple membranes
Dietmar
Porschke
Max Planck Institut für biophysikalische Chemie, Am Fassberg 11, 37077 Göttingen, Germany. E-mail: dpoersc@gwdg.de
First published on 21st November 2003
Abstract
The polarization of bacteriorhodopsin discs has been characterized by measurements of the electric dichroism induced by sinusoidal electric field pulses in the frequency range from 0.2 to 100 kHz with field strengths up to 40 kV m−1. Analysis of the stationary dichroism by a disk model with a saturating induced dipole moment in the direction of the plane shows saturation of the induced dipole at low field strengths in the range around 10 kV m−1. The AC-polarizability αAC increases with decreasing frequency, whereas the saturation field strength decreases with decreasing frequency in most cases. DC-polarizabilities αDC were obtained from the stationary dichroism induced by DC pulses and analyzed by the orientation function for discs with a permanent dipole perpendicular to the plane and an induced dipole in the plane. αDC is always larger than αAC-values; α-values increase from 100 kHz to DC by factors of 5 to 9. These data demonstrate the existence of a spectrum of slow polarization processes extending over the μs- into the ms-time range. The increase of polarizability with decreasing frequency was observed in buffers containing Na+, Ca2+ and Mg2+ as counterions. The dichroism rise curves observed under AC-pulses could be described by single exponentials τr in the absence of Ca2+ or Mg2+; 1/τr increases linearly with the square of the electric field strength, as expected for induced dipoles. The polarizabilities obtained from the slope of this dependence increase with decreasing frequency; the absolute values are higher by factors of ∼2 than those derived from stationary dichroism data. The dichroism risecurves induced by AC-pulses show an additional slow exponential in the presence of Ca2+ or Mg2+. The slow amplitude observed in the presence of Mg2+ is higher than in the presence of Ca2+, suggesting a contribution from Mg2+-inner sphere complexes. Thus, polarization data provide information about the coordination state of counterions. A simple criterion for the limit mechanisms of polarization by “biased dissociation” and “motion along surface” is discussed.
Introduction
Electric parameters of membranes and of membrane proteins are essential for understanding of bioelectric processes.1–3 A favored model system for analysis has been bacteriorhodopsin,4–7 because it is easily available and relatively stable. Its high anisotropy both with respect to electric and optical parameters8–18 simplifies experimental characterization by electro-optical methods.19,20 A standard approach to determination of electric parameters requires measurements of electro-optical data (dichroism, birefringence or light scattering) using both high frequency and DC-pulses.9–11,14,15,17 The data at high frequencies are used to evaluate the polarizability, which is then introduced into the analysis of data obtained by DC pulses for determination of permanent dipole moments. This procedure is based on the assumption that the polarizability is independent of the frequency.Polarization of ion atmospheres around polyelectrolytes involves rearrangement of the ion distribution21–34 and, thus, must be associated with some time distribution of ion motion at given field strengths. The time distribution of polarization may be dependent on the size of the object and on the field strength. Furthermore, the type of ion binding may affect the polarization time: for example, inner sphere complexes with long lifetimes35 are candidates for slow contributions to polarization.
Slow polarization processes have been mentioned in the literature,36,37 but the experimental evidence is quite limited in most cases. Dispersion curves of electro-optical amplitudes for bacteriorhodopsin suggest that the main relaxation of polarization occurs at about 1 MHz. Most dispersion curves shown in the literature10,15,37,38 indicate a plateau region between ∼100 kHz and ∼100 Hz followed by the range of rotational relaxation at frequencies <100 Hz. Thus, polarizabilities measured at any frequency in the plateau region were assumed to be representative for bacteriorhodopsin.
In the present investigation, the dynamics of polarization in bacteriorhodopsin discs has been investigated in more detail by measurements of field strength dependences in the frequency domain from 100 kHz to DC. The data clearly demonstrate a continuous increase of the polarizability with decreasing frequency ν in the range from ν![[thin space (1/6-em)]](https://www.rsc.org/images/entities/char_2009.gif) <100 kHz to DC. These results reveal a broad spectrum of polarization time constants.
<100 kHz to DC. These results reveal a broad spectrum of polarization time constants.
Structure and electric parameters of purple membranes
The local and global structure of purple membranes is well known.4–7 The membrane fragments prepared by standard procedures are obtained as thin disks with average diameters in the range of 1 μm. Membrane fragments with 1 μm diameter include ∼6.8×10⁴ protein monomers. Each of the protein monomers is surrounded by 10 lipids molecules with phosphate headgroups bearing negative charges. Thus, these fragments have a very high charge density and attract large numbers of counterions.
Electro-optical studies including measurements of the electric dichroism, birefringence and light scattering8–18 demonstrated that purple membranes have a large permanent dipole moment in the direction perpendicular to the disk plane and a large induced dipole moment along the disk plane (Fig. 1). The permanent dipole is dominant in the range of low DC fields. Because the energy of the induced dipole increases with the square of the field strength, the induced dipole takes over at high field strengths. The rotational diffusion of standard purple membrane fragments is relatively slow and, thus, the permanent dipole cannot follow rapid changes in the field direction. In contrast, field-induced redistribution of ions along the disk is relatively fast, resulting in orientation by the induced dipole at AC frequencies above ∼200 Hz. The orientation mechanism is indicated by the sign of the dichroism: at low DC fields the dichroism is negative, whereas at high DC fields and AC fields of sufficiently high frequency the dichroism is positive.
 | ||
| Fig. 1 Directions of dipole moments and modes of orientation of purple membranes. | ||
The nature of the permanent dipole moment has been characterized by a comparison39 of the pH-dependence of experimental values with calculations based on the crystal structure. These data indicate that a high intrinsic dipole of the protein (∼600 D per monomer, calculated for the trans-membrane direction) is compensated to a large degree at neutral pH (experimental value ∼53 D per monomer). The compensation seems to be due to a non-symmetric distribution of charges on lipid headgroups. According to the available crystal structure there are 5 lipid headgroups per protein monomer on each side of the membrane.40 Thus, the non-symmetric distribution of charges suggests a difference in the charge state of some headgroup residue(s).
The induced dipole is attributed to field induced polarization of the ion atmosphere in the disk plane. Details of the polarization mechanism are analyzed in the discussion.
Orientation function
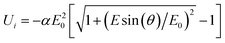
The field induced orientation of disk structures with an induced dipole in the disk plane and a permanent dipole perpendicular to the disk plane has been described by Shah.42 He assumed a standard induced dipole in the disk plane and did not consider saturation of the polarizability. Because the experimental data indicate saturation in the case of bacteriorhodopsin discs (cf. below), the orientation function has to be extended.Saturation of polarizability has been described by various functions. It is expected that the standard induced dipole found at low field strengths with an energy
 | (1) |
 | (2) |
≫E0 the energy is given by | Ui=−αE0Esin(θ) | (3) |
≪E0 the energy corresponds to that of eqn. (1). The full orientation function, including the contribution resulting from the permanent dipole moment μ
(cf. Shah), is given by  | (4) |
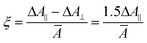
B=exp[(μEcosϕ+αE20[(1+[Ecos(ϕ)/E0]2)1/2−1])/kT]. This orientation function approaches a value −½ at high field strengths. Thus, the dichroism at any field strength is described by | ξ=−2Φξ∞ | (5) |
Materials and methods
Purple membranes were isolated from Halobacterium salinarum S9 (given by Dr J. Tittor) using standard procedures, including fractionation by sucrose density centrifugation.41 The samples proved to be homogeneous by SDS-PAGE and by isoelectric focusing. The D96N-sample was given by Dr J. Tittor. Before measurements, the membrane suspensions were extensively dialyzed against standard pH buffers and were sonicated in a Bransonic 220 for 3 min to break down aggregates. The following standard buffers were used: 1 mM NaClO4, 1 mM Na-cacodylate pH 7, 0.2 mM EDTA (NCE); 1 mM NaClO4, 1 mM sodium cacodylate pH 7, 0.2 mM MgSO4 (NCM); 1 mM NaClO4, 1 mM sodium cacodylate pH 7, 0.2 mM CaClO4 (NCC).The electric dichroism was measured at 546 nm and 20°C using a setup described previously18
(Fig. 2). Electric field pulses were generated by a Tektronix AWG 5105 arbitrary waveform generator together with a Fluke 5205A amplifier. A Fluke 5700A Calibrator combined with a relay device for adjusting pulse lengths was also used for pulse generation. The electric field pulses were applied to the samples in a cuvette with 1 cm optical pathlength and with an insert machined from Teflon holding platinum electrodes at a distance of 4.8 mm. The absorbance at 546 nm was in the range of 0.1 to 0.15. Usually the plane of polarization was adjusted parallel to the field vector. In order to maintain the light-adapted state of BR, samples were exposed to the light of a 100 W lamp. Complete light-adaptation of BR was monitored by determining the ratio of absorbances at 590 nm and 540 nm. This ratio is about 1.04 for light-adapted bacteriorhodopsin. Sufficiently long electric field pulses were applied to ensure complete adjustment of the stationary state of orientation. Stationary values of the dichroism were calculated from the stationary change of light intensity using the standard equation:
 | (6) |
 | ||
| Fig. 2 Scheme of the instrument used for measurements of the electric dichroism. | ||
°C, estimated accuracy ±10%)
| 1028α/C m2 V−1 | E 0/kV m−1 | 1024μ/C m | ξ | |||||||||||||
|---|---|---|---|---|---|---|---|---|---|---|---|---|---|---|---|---|
| ν | 100 | 10 | 1 | 0.2 | DC | 100 | 10 | 1 | 0.2 | DC | 100 | 10 | 1 | 0.2 | DC | |
| WT | NCE | 1.60 | 2.12 | 2.82 | 3.32 | 7.92 | 11.8 | 10.6 | 9 | 11 | 7.7 | 0.505 | 0.504 | 0.493 | 0.443 | 0.268 |
| NCC | 1.57 | 2.14 | 3.12 | 3.57 | 7.52 | 10.3 | 9 | 8.9 | 11.9 | 7.45 | 0.290 | 0.291 | 0.268 | 0.237 | 0.118 | |
| NCM | 1.12 | 1.57 | 2.48 | 2.96 | 8.90 | 9.8 | 8.8 | 7.8 | 10.1 | 7.89 | 0.273 | 0.272 | 0.247 | 0.207 | 0.064 | |
| D96N | NCE | 0.64 | 0.86 | 1.24 | 2.49 | 3.29 | 13.3 | 10.9 | 10.3 | 6.3 | 11.8 | 0.385 | 0.376 | 0.300 | 0.174 | 0.274 |
| NCC | 0.67 | 0.98 | 1.59 | 2.44 | 3.90 | 13.8 | 13.1 | 12 | 11.2 | 10.5 | 0.185 | 0.172 | 0.139 | 0.096 | 0.094 | |
| NCM | 0.58 | 0.85 | 1.52 | 2.38 | 5.33 | 14.7 | 12.5 | 10.9 | 9.2 | 11.5 | 0.184 | 0.179 | 0.138 | 0.097 | 0.089 | |
Results
Stationary AC dichroism
AC electric field pulses applied to solutions of bacteriorhodopsin induce positive dichroism. Dispersion curves of this effect shown in the literature are restricted to single values of the electric field strength. A set of measurements at different field strengths is given in Fig. 3a in the standard form of the reduced electric dichroism. When these data are normalized to 1 at the maximal values of the dichroism observed at each field strength separately (cf.Fig. 3b), the resulting dispersion curves reveal a clear dependence of the shape on the field strength that has not been described in the literature yet. The distinct dependence on the frequency at different field strengths is also clearly illustrated in a set of data obtained for a solution containing Ca2+-ions (Fig. 3c).![(a) Stationary values of the dichroism ξ for bacteriorhodopsin in buffer NCE at 20 °C as a function of the frequency ν at different field strengths E
[kV m−1]: 2.083 (○), 6.25 (+) and 20.83 (×); (b) Same data as in (a) but normalized to unity at the maximal ξ-value measured at the given field strength, i.e. the ξ-values measured at each given field strength were divided by the maximal value ξmax found at the given field strength; (c) data measured in buffer NCC, normalized as described in b. The symbols representing given field strengths in panels b and c are as defined in a.](/image/article/2004/CP/b306502b/b306502b-f3.gif) | ||
| Fig. 3 (a) Stationary values of the dichroism ξ for bacteriorhodopsin in buffer NCE at 20°C as a function of the frequency ν at different field strengths E
[kV m−1]: 2.083 (○), 6.25 (+) and 20.83 (×); (b) Same data as in (a) but normalized to unity at the maximal ξ-value measured at the given field strength, i.e. the ξ-values measured at each given field strength were divided by the maximal value ξmax found at the given field strength; (c) data measured in buffer NCC, normalized as described in b. The symbols representing given field strengths in panels b and c are as defined in a. | ||
Stationary values of the dichroism ξ measured as a function of the field strength E at a given frequency can be described by the standard orientation function for induced dipoles,19 if the data are restricted to low field strengths E≤5 kV m−1. Experimental data measured over a wider range of field strengths require an extended orientation function for a satisfactory description. As shown in Fig. 4, the orientation function with saturation of the polarizability presented above can be used to describe the experimental data at a high accuracy. Because the permanent dipole of bacteriorhodopsin does not contribute under the applied AC pulses, its value was fixed to μ=0 during fitting with eqn. (5).
 | ||
Fig. 4 Stationary values of the dichroism ξ for bacteriorhodopsin in buffer NCE at 20°C as a function of the electric field strength EAC at different frequencies: 100 kHz (○,—), 10 kHz (×,![[dash dash, graph caption]](https://www.rsc.org/images/entities/char_e091.gif) ), 1 kHz (△,⋯) and 0.2 kHz (▽, ), 1 kHz (△,⋯) and 0.2 kHz (▽,![[dash dot, graph caption]](https://www.rsc.org/images/entities/char_e090.gif) ). The continuous lines represent least squares fits according to eqn. (5); the fit parameters are given in Table 1. (a) Complete data set; (b) data at low electric field strengths. ). The continuous lines represent least squares fits according to eqn. (5); the fit parameters are given in Table 1. (a) Complete data set; (b) data at low electric field strengths. | ||
The dichroism data measured at the highest field strengths E∼40 kV m−1 are close to the limiting value (cf.Fig. 4a), and, thus, fitted values of the limit dichroism can be considered as reliable. Furthermore, the dichroism values ξ observed at different frequencies approach very similar limiting values at high field strengths. However, the dichroism ξ at low field strengths clearly increases with decreasing frequency (cf.Fig. 4b), reflecting an increase of the polarizability with decreasing frequency. Least-squares fits of the data by the orientation function provided values for the polarizability, the saturation field strength and the limiting value of the dichroism compiled in Table 1. The polarizabilities measured both for wild type bacteriorhodopsin and for the mutant D96N at different ionic conditions increase with decreasing frequency. The saturation field strength E0 decreases with decreasing frequency for the D96N-sample. Most of the E0-values obtained for the wild type sample show a similar trend-with the exception of the data at 0.2 kHz.
AC-dichroism risecurves
An independent method for determination of polarizabilities is based on the field strength dependence of the risetime constants. In the absence of Mg2+ or Ca2+, secured by dialysis against EDTA, the dichroism risecurves can be described by single exponentials at a high accuracy. According to the theory for induced dipoles,44 the rise time constants τr should be dependent on the electric field strength E according to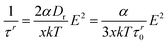 | (7) |
=1/(6τr0) the rotational diffusion coefficient, τr0 the dichroism decay time and x a numerical factor that was specified by Schwarz44 as 3.35, whereas simulations of Brownian dynamics45 for rod-like molecules demonstrated a value x=2.9. Plots of 1/τr against E2 show that eqn. (7) is valid also in the present case (cf.Fig. 5); the slope d(1/τr)/d(E2) increases with decreasing frequency, demonstrating an increase of the polarizability with decreasing frequency. The α-values obtained with x=2.9 and τr0=91.8 ms are 3.48, 4.68, 6.18 and 6.60 in units of [10−28 C m2 V−1] for 100, 10, 1 and 0.2 kHz, respectively. Thus, the polarizabilities obtained from the risetimes constants reveal the same dependence on the frequency as that derived from the stationary values of the dichroism, but the latter values are lower by a factor of about 2.
![Reciprocal values of dichroism rise time constants 1/τr for bacteriorhodopsin in buffer NCE at 20 °C as a function of the square of the electric field strength E2 at different frequencies: 100 kHz (○,—), 10 kHz (×,), 1 kHz (△,⋯) and 0.2 kHz (▽,). The data at 0.2 kHz denoted by “▼” indicate saturation of the polarizability and, thus, were not included in the linear regression. Using eqn. (7) with factor x = 2.9 and τr0 = 91.8 ms, the slopes of the linear regressions provided the polarizabilities 3.48, 4.68, 6.18 and 6.60 in units of [10−28 C m2V−1] for 100, 10, 1 and 0.2 kHz, respectively.](/image/article/2004/CP/b306502b/b306502b-f5.gif) | ||
| Fig. 5 Reciprocal values of dichroism rise time constants 1/τr for bacteriorhodopsin in buffer NCE at 20°C as a function of the square of the electric field strength E2 at different frequencies: 100 kHz (○,—), 10 kHz (×,), 1 kHz (△,⋯) and 0.2 kHz (▽,). The data at 0.2 kHz denoted by “▼” indicate saturation of the polarizability and, thus, were not included in the linear regression. Using eqn. (7) with factor x=2.9 and τr0=91.8 ms, the slopes of the linear regressions provided the polarizabilities 3.48, 4.68, 6.18 and 6.60 in units of [10−28 C m2V−1] for 100, 10, 1 and 0.2 kHz, respectively. | ||
The present investigation of the frequency dependence was not extended below ν=0.2 kHz because of (2ν)-modulation of the dichroism curves at ν<0.2 kHz. The effect is already clearly visible at 0.2 kHz at higher field strengths, where orientational relaxation into the direction of the field vector is accelerated. Deviations of relaxation time constants observed at 0.2 kHz at high field strengths (cf. two points not included in the fit in Fig. 5) seem to be due to this effect.
In the presence of Ca2+- or Mg2+-ions the dichroism rise curves cannot be described by single exponentials, but require a second exponential for a reasonable description (cf.Fig. 6). The reciprocal time constant of this second exponential can be represented as a linear function of the square of the electric field strength at a reasonable accuracy. The slope of this dependence is about a factor of 10 smaller than that found for the single exponential described above, suggesting a smaller contribution to the polarizability. In general the amplitude is larger in the presence of Mg2+ than in the presence of Ca2+, which may come from a contribution from Mg2+-inner sphere complexes.
 | ||
| Fig. 6 Dichroism rise curve for bacteriorhodopsin in buffer NCM induced by a 10 kHz pulse with an effective electric field strength of 73.7 kV m−1. A least squares fit provides the time constants τ1=0.917 ms and τ2=14.8 ms (20°C). | ||
The dichroism curves were measured at different orientations of the polarizer, in particular at the magic angle orientation. These measurements did not provide evidence for the existence of field induced reactions occurring under the conditions of the present experiments. Thus, the slow relaxation effect observed in the presence of Ca2+ or Mg2+ is not due to field induced association of bacteriorhodopsin discs, which should be indicated by an increase of the absorbance due to turbidity.
Stationary DC-dichroism
The stationary dichroism measured under DC pulses is negative at low field strengths and turns to positive values at high field strengths. The general form of this dependence on the field strength is consistent with the orientation function described by Shah,42 with a permanent dipole perpendicular to the plane and an induced dipole in the plane. However, the orientation function can only be used for accurate representation of data measured at low field strength. Deviations of experimental data at higher field strengths are considerable-it is not possible to fit data measured over a wide range of field strengths by the Shah function.18The saturation of the polarizability observed under AC-pulses is expected to occur also under DC-pulses and, thus, the orientation function, eqn. (5), should be useful for description of the stationary DC-dichroism as well. As shown in Fig. 7 the experimental data can be described by eqn. (5) at a high accuracy over the full range of electric field strengths. However, examination of the fitted parameters reveals a serious problem: the limit dichroism is extreme (−2.98) and outside reasonable limits. Further analysis shows that the electric parameters are also not reasonable: the induced dipole term is dominant at low field strengths and the permanent dipole term prevails at high field strengths-just opposite to the conclusions derived from the shape of the experimental transients.18 Thus, it must be concluded that the parameters are not reasonable from the physical point of view, although the fit happens to be excellent.
 | ||
| Fig. 7 Stationary values of the dichroism ξ for bacteriorhodopsin in buffer NCE at 20°C as a function of the DC electric field strength EDC. The data denoted by “○” were included in a least squares fit to the Shah orientation function, represented by the continuous line (fit parameters given in Table 1). The data denoted by “●”, not included in the fit, demonstrate the deviations from the Shah function at high field strengths. The dashed line shows a least squares fit of the data by eqns. (4) and (5) with the parameters μ=7.83×10⁻²⁵ C m, α=2.45×10⁻²⁷ C m2 V−1, E0=0.39 kV m−1, ξ=−2.98. | ||
The parameters obtained by least squares fitting of the data in Fig. 7 by eqns. (4) and (5) imply a special balance of the energies from the induced and the permanent dipole up to high field strengths. Because these energies remain rather close to each other, the degree of orientation is far from saturation even at the highest field strength shown in Fig. 7. In contrast, the parameters obtained from the Shah orientation function lead to saturation of orientation at relatively low field strengths, because the energy of the induced dipole increases with the square of the field strength.
Under the given conditions, the results obtained by the Shah orientation function from the data at low field strengths must be considered as the best available approximation. The DC polarizabilities obtained by this procedure, compiled in Table 1, are higher than AC polarizabilities measured at 0.2 kHz. Thus, there is a continuous increase of the polarizability with decreasing frequency.
Discussion
Modes of polarization
A major part of the ions associated with purple membranes is expected to be in the form of a mobile ion atmosphere. This appears to be consistent with the experimental data in the literature suggesting that the main part of the polarization is a very fast process with a relaxation frequency in the MHz-range. However, some of these ions are probably bound to the discs in a less mobile form and, thus, slower components of field induced redistribution may be expected. Potential sites for coordination of ions are phosphate groups of lipids and in addition carboxyl groups of aspartic or glutamic acids in the protein. The relaxation time constants of these ion complexes may cover a broad time range and, thus, a broad range of polarization time constants may be expected.Although slow polarization processes in polyelectrolytes may be predicted to exist under certain conditions, experimental evidence is hardly available. This is partly due to the difficulty that most polymer samples are not suitable for a quantitative analysis because of flexibility and/or heterogeneity with respect to particle size. Both flexibility and heterogeneity lead to a broad spectrum of time constants for orientation and, thus, it is impossible to separate orientational from polarization processes. In the case of purple membranes, the flexibility is limited and the heterogeneity can be reduced to a tolerable level. For the sample used in the present investigation the heterogeneity is indicated by a spectrum of dichroism decay time constants in the range from ∼35 to ∼150 ms. The rotation time constant τr of circular disks46 is given by
 | (8) |
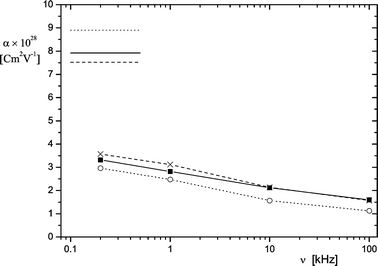 | ||
| Fig. 8 Polarizability α of purple membranes as a function of the frequency ν in buffers NCE (■,—), NCC (×,) and NCM (o,⋯). The polarizabilities obtained from DC-experiments are indicated by horizontal lines (20°C). | ||
The experimental data indicate an unexpectedly broad distribution of polarization time constants. According to the present results, the influence of bivalent ions on the overall shape of the dispersion curves (Fig. 8) is relatively small. The spectrum of time constants extends from the μs to the ms time range, both in the absence and presence of bivalent ions. Monovalent counterions like Na+ are known for their high reaction rates and, thus, the physical basis for slow processes should be specified. In this context it is useful to compare the present data with results obtained for latex particles by dielectric relaxation. Schwan et al.47 demonstrated that the characteristic dielectric frequency of latex particles decreases with the square of their radius. This relation was found to be independent of the nature and the concentration of electrolyte as well as of the concentration of the particles. For particles with 1.17 mm diameter the characteristic frequency was ∼500 Hz, with a “fairly well defined spectrum of relaxation times”. Thus, the time constants of polarization are in the same range as those observed for purple membrane fragments. The different shape of latex particles and purple membranes may also have some influence on the spectrum of polarization times, but the influence of the size is expected to be more important than that of the shape.
The experimental data obtained by Schwan et al.47 were explained by a theory of Schwarz22 in terms of a displacement of counterions in the atmosphere around the latex particles. According to this theory the polarization time constant of spherical particles is given by
 | (9) |
The theory of Schwarz22 was criticized by Schurr23 and later by Fixman28 for omission of any flux of charge into, or out of, the bulk solution. Fixman concluded that the dominant slow process that controls relaxation is the slow diffusion of neutral salt in the environment of the macromolecule. The theoretical literature on the polarization of polyelectrolytes is extensive21–32 and, thus, cannot be reviewed here. Apparently the polarization process is too complex for description by a tractable analytical theory. More information may be obtained by Brownian dynamics simulations.33,34
Limit cases of polarization mechanisms
In the absence of a comprehensive theory for polarization of polyelectrolytes it may be useful to discuss simple limit mechanisms. A dipole of any polyelectrolyte may be induced by motion of counterions along the polymer or by a non-symmetric change of ion association at the ends of the polymer. Evidence for the latter mechanism was obtained in the case of short, rod-like DNA restriction fragments,48 where polarization was observed in the ns-time range. The reciprocal polarization time constants were shown to be dependent on the ion concentration as expected for a diffusion controlled association reaction. The experimental data are consistent with field-induced non-symmetric dissociation of ions at one end of the DNA. The driving force for this reaction is generation of the dipole. Evidence for non-symmetric dissociation has been obtained for restriction fragments with 76 and 95 base pairs.48 For these fragments the experimental data do not show any chain length dependence of the polarization time constants. The time constants of polarization found in the experiments were reproduced by simulations of Brownian dynamics.34The strong evidence for polarization by biased dissociation in the case of DNA double helices raises the question for a simple criterion to predict conditions, where the different limit mechanisms are expected to be active. The “biased dissociation” mechanism is characterized by the time constant of ion dissociation, whereas the “motion along surface” mechanism is characterized by the diffusion coefficient of ions along the surface Di. The time constant of dissociation is given by 1/kd, where kd is the rate constant of ion dissociation. During a time interval 1/kd, ions may move along the surface by a characteristic distance d=√(Di/kd). If the polymer is longer than d, polarization by “biased dissociation” is faster than by “motion along surface”. Thus, the “biased dissociation” mechanism is expected to be dominant for objects with dimensions >d, whereas the “motion along surface” mechanism should be dominant for objects with dimension <d
(cf.ref. 30). For DNA the rate constant kd for monovalent ions48 at low salt concentration (∼1 mM) is in the range 107 s−1 and the diffusion coefficient for Na+ in water is 1.3×10⁻⁵ cm2s−1. Using these values we get a value of 11 nm for the characteristic distance. Thus, the biased dissociation mechanism is expected to be effective for DNA's with more than ∼35 base pairs, in agreement with the experiments.48 This criterion based on comparison of time constants should be useful as a simple approximation.
Application of the simple criterion to purple membranes indicates that there are rather slow processes of both ion dissociation and motion of ions along the surface. This conclusion is supported by independent experiments. Dissociation of Mg2+-ions induced by addition of EDTA was reflected by changes of electro-optical data with time constants in the range of hours up to days (in preparation). Although this slow process may be controlled by reactions within the protein, the slow reactions of the protein are then obviously coupled with ion binding.
Finally, application of the simple polarization criterion to the case of latex particles raises some questions. As shown by Schwarz,22 the observation of slow polarization processes is compatible with motion of ions along the surface, if some activation barriers of reasonable magnitude are assumed. If this interpretation is correct, dissociation of ions from the surface layer should be relatively slow, because otherwise the “biased dissociation” mechanism would be active.
Binding state of bivalent ions
The dispersion curves obtained in the presence of different ions are equivalent in a first approximation, but a more detailed analysis reveals some difference. The ratio of the polarizabilities αDC/α100 measured at the extremes of the frequency range is 5.0 (5.1) in the absence of bivalent ions, 4.8 (5.8) in the presence of Ca2+ and 7.9 (9.2) in the presence of Mg2+ for wild-type bacteriorhodopsin (and for D96N, respectively). The high ratio observed in the presence of Mg2+ indicates a particularly high contribution from slow polarization processes, which seem to be mainly due to inner sphere complexes. It is well known that these complexes35 react slowly with a characteristic rate constant of 105 s−1 for formation of inner sphere contacts and with relaxation time constants in the ms-time range. Ca2+ ions are very similar with respect to equilibrium parameters, but their rate constant for formation of inner sphere complexes is more than 3 orders of magnitude higher.35 Thus, the parameters of polarization measured over a broad frequency range can be used as evidence for the state of ion binding.Ion binding in the protein
The data obtained in the present investigation demonstrate that the dispersion of the polarizability is influenced by the presence of bivalent ions, but this effect is small compared with the strong influence of the ion composition on the limit dichroism ξ∞. In the absence of bivalent ions the ξ∞-value is much higher than in the presence of Ca2+ or Mg2+-ions. It is remarkable that the ion induced changes in the limit dichroism are much larger than those both in the polarizability and the permanent dipole moment. Thus, it is likely that the changes in the limit dichroism are not mainly due to ion binding at surface residues but probably involve ion binding sites close to the retinal group.Binding sites for ions in the protein may be characterized by measurements with different mutants. The data obtained for the wild-type and D96N bacteriorhodopsin are very similar with respect to the frequency dependence of the polarizability, as should be expected for equivalent ionic atmospheres. However, there are some differences in the limit dichroism as a function of the frequency (cf.Table 1), which should be characterized in more detail. Replacement of amino acid residues at different sites may be used for identification of binding sites.
Bending/stretching of membrane fragments
The state of polarization may also be affected by bending or stretching of the purple membrane fragments. Because the induced dipole of stretched states is expected to be larger than that of bent states, field induced stretching must be expected under conditions with a dominant induced dipole. The opposite process of bending may be induced by electric fields under conditions with a dominant permanent dipole, because bending of objects with a net charge increases their permanent dipole. Bending/stretching processes should be reflected by a special contribution to the dichroism. A modulation of the dichroism at 0.2 kHz and high field strengths was observed, that may be partly due to bending/stretching. However, these data were not included in the evaluation of the polarizability. Thus, the polarizabilities in the range ≥0.2 kHz should not be affected by bending/stretching, whereas the DC-polarizabilities are expected to contain a contribution from bending/stretching processes. The large increase of the polarizability from 0.2 kHz to DC may be partly due to these processes.Acknowledgements
The technical assistance of Jürgen Wawrzinek is gratefully acknowledged.References
- E. R. Kandel, J. H. Schwartz and T. M. Jessell, Principles of Neural Science, McGraw-Hill, New York, 2000 Search PubMed.
- R. P. Plonsey and R. C. Barr, Bioelectricity-A quantitative Approach, Plenum, New York, 1991 Search PubMed.
- J. P. Reilly, Applied Bioelectricity-From electrical stimulation to electropathology, Springer, 1998 Search PubMed.
- W. Stoeckenius and R. A. Bogomolni, Ann. Rev. Biochem., 1982, 52, 587–616 CrossRef.
- Isr. J. Chem., 1995, 35, 193–515, special issue ed. M. Ottolenghi and M. Sheves Search PubMed.
- U. Haupts, J. Tittor and D. Oesterhelt, Ann. Rev. Biophys. Biomol. Struct., 1999, 28, 367–399 CrossRef CAS.
- Biochim. Biophys. Acta, 2000, 1460, 1–239, special issue ed. J. K. Lanyi Search PubMed.
- L. Keszthelyi, Biochim. Biophys. Acta, 1980, 598, 429–436 CrossRef CAS.
- Y. Kimura, A. Ikegami, K. Ohno, S. Saigo and Y. Takeuchi, Photochem. Photobiol., 1981, 33, 435–439 CAS.
- Y. Kimura, M. Fujiwara and A. Ikegami, Biophys. J., 1984, 45, 615–625 CAS.
- K. Barabas, A. Der, Z. Dancshazy, P. Ormos, L. Keszthelyi and M. Marden, Biophys. J., 1983, 43, 5–11 CAS.
- L. D. Kahn and S. I. Tu, Biopolymers, 1984, 23, 707–718 CAS.
- S. P. Stoylov, G. Todorov and A. Zhivkov, Bioelectrochem. Bioenerg., 1984, 12, 49–55 CrossRef.
- E. Papp, G. Fricsovszky and G. Meszena, Biophys. J., 1986, 49, 1089–1100 CAS.
- S. G. Taneva, N. Jordanova and I. B. Petkanchin, Biophys. Chem., 1992, 44, 91–97 CrossRef CAS.
- S. G. Taneva, G. Todorov, I. B. Petkanchin and S. P. Stoylov, Eur. Biophys. J., 1987, 14, 415–421 CAS.
- H. I. A. Mostafa, G. Varo, R. Toth-Boconadi and L. Keszthelyi, Biophys. J., 1996, 70, 468–472 CAS.
- D. Porschke, Biophys. J., 1996, 71, 3381–3391 CAS.
- E. Fredericq and C. Houssier, Electric Dichroism and Electric Birefringence, Clarendon, Oxford, 1973 Search PubMed.
- D. Porschke, in Protein Ligand Interactions: Hydrodynamics and Calorimetry-A Practical Approach, ed. S. E. Harding and B. Z. Chowdhry, Oxford University Press, Oxford, 2001, pp. 197–221 Search PubMed.
- M. Mandel, Mol. Phys., 1961, 4, 489–496 CAS.
- G. Schwarz, J. Phys. Chem., 1962, 66, 2636–2642 CAS.
- J. M. Schurr, J. Phys. Chem., 1964, 68, 2407–2413 CAS.
- J. P. McTague and J. H. Gibbs, J. Chem. Phys., 1966, 44, 4295–4301 CAS.
- F. Oosawa, Biopolymers, 1970, 9, 677–688 CAS.
- G. S. Manning, Biophys. Chem., 1978, 9, 65–70 CrossRef CAS.
- D. C. Rau and E. Charney, Biophys. Chem., 1981, 14, 1–9 CrossRef CAS.
- M. Fixman, J. Chem. Phys., 1980, 72, 5177–5186 CrossRef CAS.
- M. Fixman and S. Jagannathan, J. Chem. Phys., 1981, 75, 4048–4059 CrossRef CAS.
- W. van Dijk, F. van der Touw and M. Mandel, Macromol., 1981, 14, 792–795 CrossRef CAS.
- G. S. Manning, J. Chem. Phys., 1993, 99, 477–486 CrossRef CAS.
- U. Mohanty and Y. Zhao, Biopolymers, 1996, 38, 377–388 CrossRef CAS.
- J. Antosiewicz and D. Porschke, J. Phys. Chem., 1991, 95, 5983–5988 CrossRef CAS.
- J. Antosiewicz and D. Porschke, J. Phys. Chem. B, 1997, 101, 4478–4484 CrossRef CAS.
- H. Diebler, M. Eigen, G. Ilgenfritz, G. Maass and R. Winkler, Pure Appl. Chem., 1969, 20, 93–115 CAS.
- S. P. Stoylov, Colloid Electro-Optics, Academic Press, 1991 Search PubMed.
- S. G. Taneva and I. B. Petkanchin, Trends Photochem. Photobiol., 1999, 6, 113–139 Search PubMed.
- S. G. Taneva, G. Todorov, I. B. Petkanchin and S. P. Stoylov, Eur. Biophys. J., 1987, 14, 415–421 CAS.
- G. Wang and D. Porschke, J. Phys. Chem. B, 2003, 107, 4632–4638 CrossRef CAS.
- N. Grigorieff, T. A. Ceska, K. H. Downing, J. M. Baldwin and R. Henderson, J. Mol. Biol., 1996, 259, 393–421 CrossRef CAS.
- D. Oesterhelt and W. Stoeckenius, Methods Enzym., 1974, 31, 667–678 CAS.
- M. J. Shah, J. Phys. Chem., 1963, 67, 2215–2219 CAS.
- S. Diekmann, M. Jung and M. Teubner, J. Chem. Phys., 1984, 80, 1259–1262 CrossRef CAS.
- G. Schwarz, Z. Physik, 1956, 145, 563–584 Search PubMed.
- J. Antosiewicz, T. Grycuk and D. Porschke, J. Chem. Phys., 1991, 95, 1354–1360 CrossRef CAS.
- F. J. Perrin, Physique, 1934, 5, 497–511 Search PubMed.
- H. P. Schwan, G. Schwarz, J. Maczuk and H. Pauly, J. Phys. Chem., 1962, 66, 2626–2635 CAS.
- D. Porschke, Biophys. Chem., 1985, 22, 237–247 CrossRef CAS.
| This journal is © the Owner Societies 2004 |