The application of a SERS fiber probe for the investigation of sensitive biological samples
R.
Geßner
a,
P.
Rösch
b,
R.
Petry
b,
M.
Schmitt
b,
M. A.
Strehle
b,
W.
Kiefer
a and
J.
Popp
*b
aInstitut für Physikalische Chemie, Universität Würzburg, Am Hubland, D-97074 Würzburg, Germany
bInstitut für Physikalische Chemie, Universität Jena, Helmholtzweg 4, D-07743 Jena, Germany. E-mail: Juergen.Popp@uni-jena.de; Fax: +49-3641-948302; Tel: +49-3641-948320
First published on 10th November 2004
Abstract
The applicability of an etched and silver or gold coated SERS fiber probe in combination with a commercially available laboratory micro-Raman setup or a home built mobile micro-Raman setup to perform on-site field measurements was evaluated and successfully tested on different biological samples. The SERS fiber probe allows one to perform measurements with high spatial resolution. Simultaneously, the laser power used for Raman spectroscopy on biological samples as compared with conventional Raman experiments can be reduced by more than two orders of magnitude. This experimental arrangement was tested to investigate sensitive biological samples like mint plants (Bergamot mint, spear mint) and citrus fruits (kumquat). Furthermore, traces of fungicides on wine leaves were detected by means of such a SERS fiber probe setup.
1 Introduction
The investigation of biological samples calls for high demands on the applied measurement technique. In most cases the biological substances of interest are being extracted and separated out of the plant material and analyzed afterwards by means of gas chromatography or HPLC.1–3 With these techniques no information about the distribution of the various substances within the sample can be obtained. Furthermore, the applied analytical methods should be time saving. Raman spectroscopy is capable of rapidly characterizing biological samples where special sample preparation techniques are not necessary. Other than in the case of IR and NMR spectroscopy, the measurements are not getting perturbed by water, which is almost present in all biological samples. The combination of a Raman setup with a microscope offers the possibility of achieving high spatial resolution up to the micrometre range. Through this it is possible to determine the very often extremely inhomogeneous distribution of different components within the biological samples. However, the Raman bands of biological samples are often masked by fluorescence. Additionally, the samples might get destroyed by the Raman excitation laser. These problems can be avoided by applying the surface enhanced Raman spectroscopy (SERS) technique.The effect of drastically enhanced Raman signals from molecules adsorbed on an electrochemically roughened silver surface was discovered by Fleischmann et al.4 Owing to electromagnetic and chemical enhancement factors a Raman signal increase by up to six orders of magnitude or even more can be observed. One mechanism of surface enhanced Raman spectroscopy is a strongly enhanced electromagnetic field produced at the surface of the metal.
When the wavelength of the incident light is close to a surface plasmon resonance (collective excitation of conductive electrons in small metallic structures) molecules adsorbed or in close proximity to the surface experience an exceptionally large electromagnetic field. The second mode of enhancement, also known as the chemical enhancement, is due to a charge transfer interaction between the metal and adsorbed molecules. The electronic transitions of many charge transfer complexes are in the visible region, so that resonance Raman enhancement occurs. A SERS experiment basically consists of the same components as are applied for conventional Raman spectroscopy. In order to optimize the electromagnetic surface-enhancement effect, the laser frequency used has to match the frequency of a plasmon resonance. For more information we refer the interested reader to the literature.5–9
The most commonly used SERS substrate is colloidal silver, which is easy to prepare. However the biological samples can be modified or even destroyed due to electrochemical reactions with the silver particles. Therefore, a minimal exposure of the investigated biological samples to the SERS substrate would be preferable in order to minimize or to avoid these reactions. By using colloidal silver this cannot be achieved since the sample is getting thoroughly contaminated by the silver particles. One possibility to design a SERS substrate according to the above mentioned requirements is to apply a SERS active layer onto a glass fiber with a specially treated fiber tip. In this work we describe the preparation of such a SERS fiber probe and several applications of this SERS fiber probe to investigate biological samples.
2 Experimental
The fibers used to prepare the SERS fiber probe were Alcatel single mode fibers with an inner diameter of 9 µm, a cladding diameter of 125 µm and an outer diameter of the plastic jacket of 250 µm. The hydrofluoric acid (48%) used to etch the fibers has been purchased by Riedel-de-Haën. The etching of the fibers to form the fiber tips has been performed according to a procedure described by Stöckle et al.10 Briefly, the glass fiber ends were immersed for 2 h in hydrofluoric acid, which was covered with p-xylene to reduce the evaporation of the acid. After the etching process the plastic jacket was removed from the fiber by dissolving it in hot concentrated sulfuric acid. Silver or gold were evaporated onto the tips by means of a vacuum vapor deposition arrangement (modified Edwards S150B sputter coater; 40–80 nm layer thickness). In an alternative procedure the fiber tip surface was first functionalized by immersing it in a solution of 3-aminopropyltrimethoxysilane (APTMS) in methanol for 24 h. Thereby, a layer of amino groups strongly attached to the surface of the tip was created.11 Afterwards the chemically functionalized tips were hardened in air for 24 h. In a further step the fibers were suspended in collodial silver for 24 h. The silver becomes chemisorbed at the amino groups attached to the tip surface. The SERS fiber probes prepared via such a wet chemical method were stored in distilled water. The colloidal silver was prepared according to a prescription of Lee and Meisel.12 Briefly, a silver nitrate solution was reduced by sodium citrate solution. The Raman spectra were obtained with a commercially available micro-Raman setup (LabRam, Jobin–Yvon/Horiba) or on a home-built portable micro-Raman setup to perform on-site measurements. The laboratory spectrometer has a focal length of 300 mm and is equipped with a 950-lines mm−1 grating. As excitation wavelength the 514.5 nm line of an argon ion laser (Spectra Physics, 2016) has been used. Fig. 1A shows a schematic sketch of the mobile Raman setup built out of commercially available components. It consists of two modules, the spectrometer and the microscope module being connected via fiber optics. The spectrometer module implies the Raman excitation laser (CRL-GCL-100-S diode pumped solid state laser, 532 nm) and the spectrometer optimized for the excitation wavelength (High Efficiency Raman-Process-Analyzer HE532 Jobin–Yvon equipped with a Wright CCD camera, 1024 × 256 pixels). Both components contain very few moving parts and are therefore robust against misalignment through transportation or shocks. The microscope module is made up of a modified Olympus BX41 microscope and a Leica micro manipulator to position the SERS fiber probe onto the sample. Fig. 1B shows a photo of the mobile Raman setup in use to perform on-site measurements.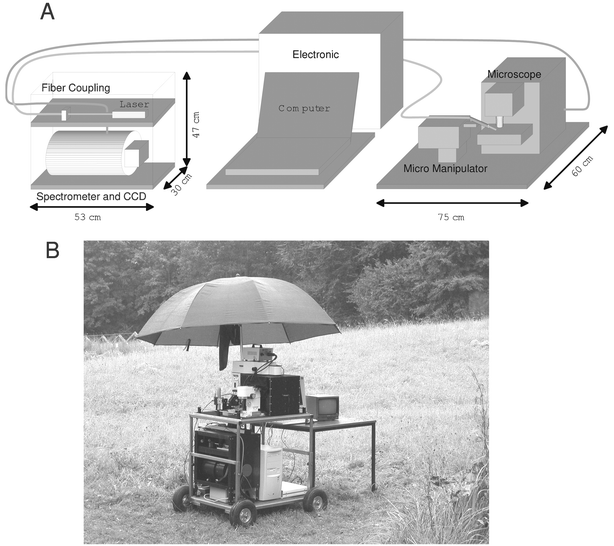 | ||
| Fig. 1 A, Schematic sketch of the mobile micro-Raman setup, and B, photo of the mobile Raman setup in use to perform on-site measurements. | ||
For recording the Raman spectra with the SERS fiber probe the Raman excitation laser was launched into the fiber and the fiber tip was positioned with the micro-manipulator onto the sample. The Raman scattered light was collected by a microscope objective (Olympus LMPlanFl 50×) and sent to the spectrometer, with which a notch filter has been used to block the elastically scattered Rayleigh light of the laser. Fig. 2 shows a schematic sketch of the experimental arrangement. For the spatially resolved measurements an x/y motorized stage (Merzhäuser) with a minimal step size of 0.1 µm was used.
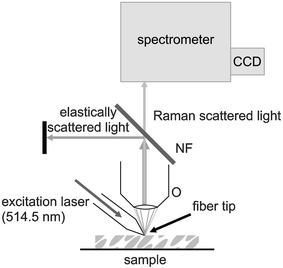 | ||
| Fig. 2 Schematic sketch of the SERS fiber probe setup. O, collecting microscope objective; NF, notch filter; CCD, detector. | ||
The SERS fiber tip was first tested by performing Raman experiments on aqueous solutions of crystal violet, which was obtained from Riedel-de-Haën. A series of solutions (diluted up to 10−5 M) was prepared and kept protected from light. The investigated biological samples were Bergamot mint and spearmint provided by the botanical garden of the University of Würzburg. For the measurements cross sections of the stems have been used.
3 Results and discussion
The application of the SERS fiber probe allows for the recording of Raman spectra under minimally invasive conditions with extremely low applied laser powers, and at the same time with a high spatial resolution. With the tip etching method it is possible to prepare SERS fiber probes with a diameter at the tip lying in the sub-micron range (0.2–1 µm).The surfaces of the SERS fiber probes were investigated by scanning electron microscopy (SEM). It has been reported that the enhancement effect of SERS substrates strongly depends on the roughness of the surface.13 The SEM photographs in Fig. 3 served to verify that the roughness of the coated fiber tips was in the sub-micron range. Thus, the SEM investigation confirmed that the surface of the coated fiber tips was sufficiently rough to generate a strong signal enhancement.
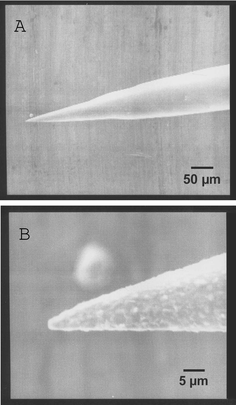 | ||
| Fig. 3 Scanning electron microscope (SEM) image of the Ag-coated fiber tip showing the entire cone at 200× magnification (A) and the tip of the fiber at 2000× magnification (B). | ||
The highest Raman intensities are obtained directly at the tip of the fiber since the highest laser power is emitted there. This has been confirmed by the following experiments: a SERS fiber probe, coated with silver by the vapor deposition arrangement, is placed in a 10−5 M solution of crystal violet (laser power at the tip: 0.2 mW). The fiber tip is scanned by moving the microscope objective collecting the Raman scattered light along the axis of the fiber tip, as depicted by the arrow in the inset of Fig. 4A/B. Thus, the position on the SERS fiber probe with the highest signal intensity for a given laser power was determined. From the obtained spectra it can clearly be seen that the most intense spectra can be obtained from the region directly located at the tip of the fiber in both cases, whereas other regions show poor signal intensities. In an alternative experiment these results were verified by scanning across the fiber tip area with a step size of 0.5 µm.
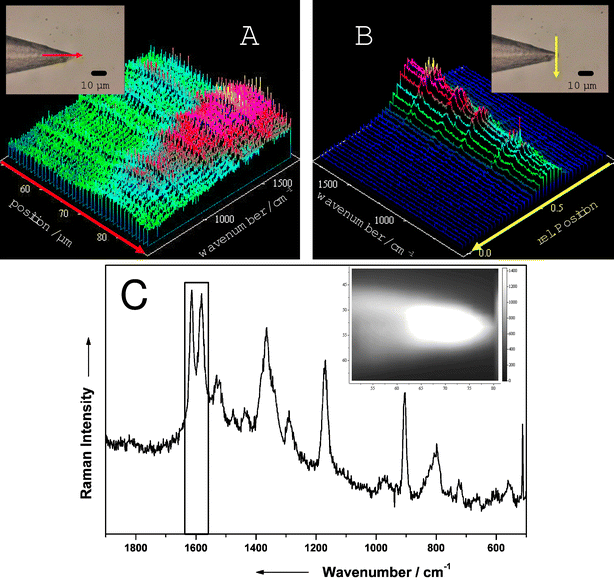 | ||
| Fig. 4 Raman mapping of a crystal violet solution recorded with the SERS fiber probe setup and the laboratory setup directly along (A) and across (B) the tip of the fiber. The insets show the images of the fiber tip, where the arrows depict the lines of measurement points. Raman spectrum of crystal violet (C) recorded directly at the tip of the fiber with the laboratory setup. The inset shows a Raman image of the illuminated fiber tip. For details see text. | ||
Raman spectroscopic investigations of crystal violet have been reported extensively. Details of the Raman band assignment can be found elsewhere.13–15 Solutions of crystal violet were used in this study to test the quality of the SERS fiber probe. Fig. 4C shows a spectrum of crystal violet directly recorded at the tip of the fiber. Based on the two marked bands at 1600 cm−1 an intensity profile (see inset of Fig. 4C) has been created by calculating the intensities of the selected bands for every scan point. Varying band intensities are displayed by different gray scales, where the brighter colors indicate the more intense Raman bands. The image clearly shows that the main contributions to the observed intensity arise from areas close to the fiber tip. The same experiment has been repeated with a SERS fiber probe, which had been wet chemically coated with silver. The fiber tip prepared in such a way (see Experimental section) has been also placed in a 10−5 M crystal violet solution and the tip area has been investigated by Raman mapping. Also, for these fiber tips the most intense Raman signal is obtained from the front of the tip. Areas near the fiber tip or at the back of the fiber show no Raman intensity at all. Thus an extremely high spatial resolution, down to 100–200 nm, can be achieved with the fiber tip since the contribution of the other parts of the fiber apart from the tip area to the Raman spectra is extremely low. Furthermore, the sample material surrounding the tip area is protected from an excessive exposure of the Raman laser, because the laser light exits the fiber directly at the tip, which is positioned at the measurement point where the laser is supposed to interact with the sample. Also, the sample is hardly getting contaminated by the silver because the SERS active silver layer is only present at the tip, which is consequently the only position touching the sample. Thus, the possibility of electrochemical reactions taking place at the surface of the silver particles is minimized.
The SERS fiber probe has been tested on mint plants (Bergamot mint, spearmint). The essential oil of the mints is produced and stored in the glandular trichomes. For the experiments a cross section of the stem has been prepared although the density of glandular trichome is higher on the leaves. However, the glandular trichomes on the outside of the stem are easier to access by the SERS fiber probe. The fiber was positioned under the microscope by means of a micro-manipulator in such a way that the tip of the SERS fiber probe was touching the cuticula of the glandular trichome (see inset of Fig. 5). The touching point was then located in the focus of the microscope objective used to collect the Raman scattered light. Fig. 5 shows two Raman spectra of the essential oil of the Bergamot mint. Spectrum A has been recorded with the silver coated fiber tip with a laser power of 1.2 mW at the tip. Spectrum B has been recorded with a conventional micro-Raman setup applying a laser power of 60 mW on the sample whereby the stem cross section had been put into colloidal silver. The quality of both spectra is equally good although the applied laser power to obtain the spectra is more than one order of magnitude lower for the spectrum recorded with the SERS fiber probe as compared with the spectrum recorded with the conventional micro-Raman setup. The spectrum recorded with the fiber tip shows two bands at 1150 and 1500 cm−1, corresponding to the C–C and C![[double bond, length as m-dash]](https://www.rsc.org/images/entities/char_e001.gif) C stretching vibrations of β-carotene, which cannot be observed in the micro-Raman spectrum (Fig. 5, spectrum B). The essential oils of the Bergamot mint contain no β-carotene but micro-algae located at the surface of the plant contain β-carotene. Since these bands cannot be seen in the colloidal spectrum the micro-algae might get destroyed by the colloidal silver. However, this is not the case if the SERS fiber tip is used. Therefore, the SERS fiber probe is more sparing with regard to a falsification of the sample material than the colloidal silver due to the extremely low laser power.
C stretching vibrations of β-carotene, which cannot be observed in the micro-Raman spectrum (Fig. 5, spectrum B). The essential oils of the Bergamot mint contain no β-carotene but micro-algae located at the surface of the plant contain β-carotene. Since these bands cannot be seen in the colloidal spectrum the micro-algae might get destroyed by the colloidal silver. However, this is not the case if the SERS fiber tip is used. Therefore, the SERS fiber probe is more sparing with regard to a falsification of the sample material than the colloidal silver due to the extremely low laser power.
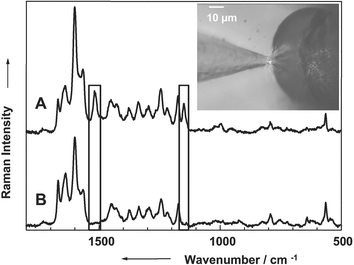 | ||
| Fig. 5 (A) Raman spectrum of the essential oil of a Bergamot mint recorded with the SERS fiber probe and the laboratory setup (laser power at the tip 1.2 mW). (B) Micro SERS (colloidal silver) spectrum of the essential oil of a Bergamot mint (laser power 60 mW). The inset shows an image of the SERS fiber probe touching the glandular trichome of the Bergamot mint containing the essential oil. | ||
In a further experiment the capabilities of the SERS fiber probe were tested by recording Raman spectra of sensitive biological samples on-site, i.e., without removing them out of their natural environment or avoiding possible changes (degradation, etc.) within the samples due to long transportation times from the field to the laboratory. Therefore, the mobile Raman setup depicted in Fig. 1 was used to record Raman spectra of the spearmint M. spicata ssp. crispata. For this purpose the SERS fiber probe was again positioned in such a way that the fiber tip is touching the cuticula of the glandular trichome (see upper part of Fig. 6). Fig. 6 shows the Raman spectrum recorded in such a way with the mobile setup in combination with the SERS fiber probe. For recording this spectrum a laser power of only 2 µW at the tip of the fiber and an integration time of 300 s was needed. Despite reducing the laser power by a factor of 600 the obtained signal to noise ratio is fairly good. By reducing the laser power to a value of only a few microWatts the investigation of extremely sensitive samples should be possible.
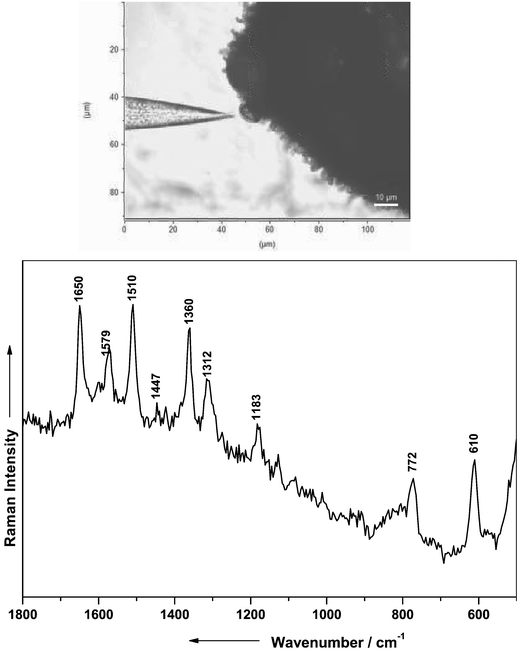 | ||
| Fig. 6 Raman spectrum of the essential oil of a spearmint recorded with the SERS fiber probe setup and the mobile Raman setup depicted in Fig. 1 (laser power at the tip 2 µW). The upper part shows an image of the SERS fiber probe touching the glandular trichome of the spearmint containing the essential oil. | ||
For an unambiguous assignment of the observed Raman bands of the mint plants to characteristic vibrations of the various essential oil components, or a reliable identification of the mint form, numerical analysis methods are needed because of the complex composition and the small fraction of the individual substances contained in the total volume of the essential oil. The identification of individual Mentha types through an interpretation of Raman spectra by means of an application of statistical methods can be found in ref. 16.
The experiments on the Bergamot mints and spearmints were extended by spectroscopic investigations on the essential oil of kumquat. Other than in mints, where the essential oil is stored in the glandular trichome, the citrus fruits (e.g., kumquat) keep the essential oil stored in lysigenic oil cavities. The lysigenic oil cavities are located in the pericarp of the fruit. Thus, the Raman experiments on kumquat provided an alternative approach to investigating the properties of the SERS fiber probe in the pericarp of citrus fruits.
The microphotograph in Fig. 7 (top) displays the fiber tip penetrating into the lysigenic vessel for close contact with the essential oil. Spectrum A in Fig. 7 (bottom) was recorded from lysigenic oil cavities using a Au coated fiber probe, where an exciting wavelength of 514.5 nm was applied at a laser power of 0.2 mW (integration time 60 min). The spectrum B (Fig. 7) was obtained with a standard micro-Raman setup (laser power: 12 mW, integration time: 100 s).
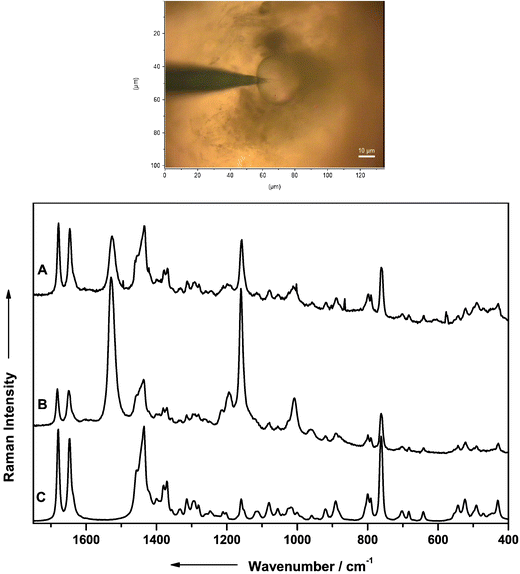 | ||
| Fig. 7 Top: microphotograph showing a gold coated SERS fiber probe penetrating into the essential oil containing lysigenic oil cavities of the citrus fruit kumquat; bottom: SERS spectrum of the essential oil located within the lysigenic oil cavities of kumquat recorded with the Au coated SERS fiber probe and the laboratory setup (A) and with a conventional micro-Raman setup (B). (C) Raman spectrum of limonen. | ||
The dominant peaks in both spectra are readily assigned to limonene, which is supported by the characteristic bands of pure limonene shown in spectrum C. Besides the limonene signals further Raman bands arising from β-carotene can be observed. The bands from β-carotene exhibit a strong intensity in spectrum B, but appear much weaker in spectrum A, which was recorded with the Au coated fiber tip. However, the spectral contributions from β-carotene result from the pericarp and not from the essential oil. These experiments demonstrate that the application of the Au coated fiber probe is advantageous for the selective detection of the oil components.
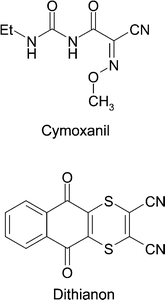
The above described spectroscopic method was further used to test the feasibility of detecting traces of fungicides on wine leaves. The wine leaves investigated were kindly provided by the Bavarian State Institute for Viticulture and Horticulture Würzburg/Veitshöchheim (LWG). The fungicide under investigation, aktuan, is widely used in viniculture as a plant protecting agent against downy mildew (Peronospora), and mainly consists of the components cymoxanil and dithianon (Fig. 8).
Typical concentrations of aqueous aktuan solutions (0.125%) were sprayed onto the leafs of a Sylvaner plant, a white-wine grape intensively cultivated in Germany. The wine leaves were collected the day after the fungicide treatment and prepared for the investigation with the Raman microscope. The leaves were cut into streaks and prepared on an objective slide. Raman experiments were immediately performed using both experimental setups, a conventional micro-Raman spectrometer and the SERS fiber probe setup.
In Fig. 9 the SERS spectrum of the aktuan solution using silver colloid for the spectral enhancement (spectrum A) and the spectra of the pure substances of dithianon (spectrum B) and of cymoxanil (spectrum C) are assembled for comparison. Baseline substraction was carried out on each spectrum and for a better comparison the data from dithianon and cymoxanil (Fig. 9) were scaled up by a factor of 5.
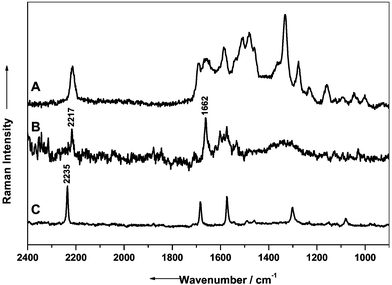 | ||
| Fig. 9 Raman spectra obtained from an aqueous solution of aktuan (A) and from the pure substances of dithianon (B) and cymoxanil (C). For ease of comparison the spectra of cymoxanil and dithianon have been scaled up by a factor of 5. | ||
The concentration of aktuan used to prepare the silver colloid solution was 10−4 M. The pure substances dithianon and cymoxanil were investigated in the crystalline form. The spectra obtained from both dithianon and cymoxanil exhibit similar features. The dominating band originating from the –CN stretching vibration at 2217 cm−1 can be used as a marker band, since this band occurs as a separated one in a band region where any other Raman signals are absent. Further band contributions in the spectrum of aktuan cannot be assigned yet, but are likely to arise from additional unknown components in the fungicide.
During the microscopic investigation micro-crystals in small, colored cavities on the wine leaves were noticed, possibly originating from the application of aktuan, which is used as a dispersed and water-resistant pesticide on the wine leaves and partially acts in a systemic manner. Spectra of the micro-crystals were recorded using the SERS fiber probe setup (Fig. 10A) and a micro-Raman setup (Fig. 10B).
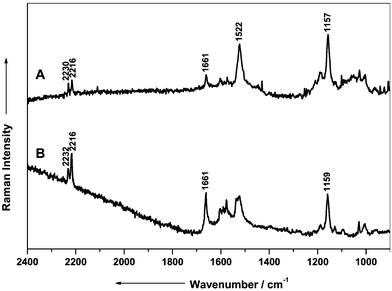 | ||
| Fig. 10 Raman spectra of aktuan on a wine leaf using the SERS fiber probe setup (A) and using a micro Raman setup (B) for recording. | ||
For the recording of spectrum A in Fig. 10 a laser power of 0.1 mW at the fiber tip during an integration time of 300 s was applied. In order to obtain a spectrum with the micro-Raman setup the integration time was extended to 480 s. Simultaneously, the applied laser power on the sample had to be attenuated to 50 µW in order to avoid sample degradation by the laser light. Although in the case of the SERS fiber probe setup the applied laser power was 20× higher as compared with the micro-Raman experiments the observed sample degradation was considerable less intense.
The Raman bands at 2230 and 2216 cm−1 in Fig. 10 are easily assigned to the CN stretching vibrations from the components dithianon and cymonxanil. The signal at 1661 cm−1 originates from the dithianon. This effect may be caused by the partially systemic action of the fungicide cymoxanil. It is probably safe to assume that cymoxanil penetrates the wine leaf, while dithianon remains on the outer part of the plant.
4 Conclusion
The present work has demonstrated the feasibility of the SERS fiber probe for investigating sensitive biological samples. This technique allows the investigation of biological samples under minimally invasive conditions. We have shown that high spatial resolution can be achieved due to the particular geometric and coating features of the fiber tip. Furthermore, by applying this technique contributions of substances located on the surface of mint plants could be detected. This was not possible thus far when working with colloidal silver as a SERS substrate. The possibility to apply the SERS fiber probe for the investigation of extremely sensitive biological samples has been shown on mints and on citrus fruits (kumquat). Furthermore, this technique was successfully tested in combination with a home-built mobile micro-Raman setup to perform on-site field measurements. This is of special interest when investigating extremely sensitive biological samples to avoid possible changes (e.g., degradation) due to long transportation times from their natural environment to the laboratory. Furthermore, the application of this technique might be of particular interest when limited amounts of samples are available. This is an essential issue for the rapid identification of microorganisms, since a time consuming cultivation of microbes on an agar plate can be circumvented.Acknowledgements
We acknowledge financial support from the ‘Deutsche Forschungsgemeinschaft’ (DFG project Po 563/4-1) and the ‘Fonds der Chemischen Industrie’. The funding of the research project FKZ 13N8369 within the framework ‘Biophotonik’ from the Federal Ministry of Education and Research (BMBF) in Germany is gratefully acknowledged. We also wish to thank the Botanical Garden at the University of Würzburg, and the Bavarian State Institute for Viticulture and Horticulture, Würzburg/Veitshöchheim (LWG), for kindly providing the samples.References
- J. M. D. Dimandja, S. B. Stanfill, J. Grainger and D. G. Patterson, J. High Resolut. Chromatogr., 2000, 23, 208–214 CrossRef CAS.
- M. D. Guillen and M. J. Manzanos, Flavour Frag. J., 1998, 13, 259–262 CrossRef CAS.
- M. D. Guillen and M. J. Manzanos, Food Chem., 1998, 63, 373–383 CrossRef CAS.
- M. Fleischmann, P. J. Hendra and A. J. McQuillan, Chem. Phys. Lett., 1974, 26, 163–166 CrossRef CAS.
- J. A. Creighton, in Spectroscopy of Surfaces, ed. R. J. H. Clark and R. E. Hester, John Wiley & Sons, New York, vol. 21, 1988 Search PubMed.
- D. A. Weitz, M. Moskovits and J. A. Creighton, in Surface-Enhanced Raman Spectroscopy with Emphasis on Liquid–Solid Interfaces, ed. R. B. Hall and A. B. Ellis, VCH, Deerfield Beach, vol. 2, 1986, pp. 197–243 Search PubMed.
- K. Kneipp, H. Kneipp, I. Itzkan, R. R. Dasari and M. S. Feld, Curr. Sci., 1999, 77, 915–924 Search PubMed.
- W. Kiefer, in Infrared and Raman Spectroscopy—Methods and Applications, ed. B. Schrader, VCH, Weinheim, vol. 21, 1995, pp. 465–517 Search PubMed.
- G. C. Schatz and R. P. van Duyne, in Handbook of Vibrational Spectroscopy, ed. J. M. Chalmers and P. R. Griffiths, John Wiley & Sons, New York, vol. 1, 2002, pp. 759–784 Search PubMed.
- R. Stöckle, C. Fokas, V. Deckert, R. Zenobi, B. Sick, B. Hecht and U. P. Wild, Appl. Phys. Lett., 1999, 75, 160–162 CrossRef CAS.
- E. Polwart, R. L. Keir, C. M. Davidson, W. E. Smith and D. A. Sadler, Appl. Spectrosc., 2000, 54, 522–527 CrossRef CAS.
- P. C. Lee and D. Meisel, J. Phys. Chem., 1982, 86, 3391–3395 CrossRef CAS.
- E. Vogel, R. Gessner, M. H. B. Hayes and W. Kiefer, J. Mol. Struct., 1999, 483, 195–199 CrossRef.
- L. Angeloni, G. Smulevich and M. P. Marzocchi, J. Raman Spectrosc., 1979, 8, 305–310 CAS.
- J. Gicquel, M. Carles and H. Bodot, J. Phys. Chem., 1979, 83, 699–706 CrossRef CAS.
- P. Rösch, W. Kiefer and J. Popp, Biopolymers, 2002, 4–5, 358–361 CrossRef.
| This journal is © The Royal Society of Chemistry 2004 |

