Measurement of nitric oxide by 4,5-diaminofluorescein without interferences
Xiaoying
Ye
,
Won-Suk
Kim
,
Stanislav S.
Rubakhin
and
Jonathan V.
Sweedler
*
Department of Chemistry and the Beckman Institute, University of Illinois, Urbana, Illinois 61801, USA. E-mail: sweedler@scs.uiuc.edu; Fax: +1-217-244-8068; Tel: +1-217-244-7359
First published on 9th November 2004
Abstract
The fluorescent reagent 4,5-diaminofluorescein (DAF-2) has been widely used for specific and quantitative measurements of nitric oxide (NO) in biological tissues. Recently it was reported that dehydroascorbic acid (DHA) and ascorbic acid (AA) interfere with the measurement of NO using DAF-2. A new method of assaying NO using DAF-2 eliminates these interferences; when frozen on dry ice, the NO in the original solution still diffuses and can react with an adjacent frozen block of DAF-2, but the confounding compounds such as DHA do not. Thus, placing the microliter-volume frozen blocks of solutions containing NO and the solutions of DAF-2 adjacent to each other for 30 min results in the concentration dependent formation of fluorescent product (DAF-2T) from the reaction of NO with DAF-2. The product has been characterized and the method validated using both fluorescence spectroscopy and capillary electrophoresis with laser induced fluorescence detection. With this approach, the presence of DHA and AA does not interfere with NO measurements, and product formation is inhibited in the presence of NO scavengers added to either of the solutions before freezing. The contactless DAF-2 method successfully assays NO in nitric oxide synthase-positive vertebrate and invertebrate tissues. This method allows nondestructive NO detection in biological samples that can subsequently be used for morphological and/or biochemical studies.
Introduction
Endogenous nitric oxide is generated by nitric oxide synthase (NOS) enzymes, which convert L-arginine and molecular oxygen to L-citrulline and NO.1,2 NO is involved in a variety of important biological functions such as blood pressure regulation in the cardiovascular system, neurotransmission in the central and peripheral nervous system, and immune defense.3–5 Altered NO production has been implicated in a wide range of diseases.6,7 For example, inadequate vascular NO has been linked to atherosclerosis, diabetes, subarachnoid hemorrhage, ischemia reperfusion injury, and shock.8–10 In addition, excess NO in the brain is associated with neuronal injury during stroke, neurodegeneration, and epileptic seizures.11 Therefore, monitoring endogenous NO production is of importance in understanding its involvement in the normal and pathological functioning of an organism.The low concentrations and the labile nature of the free radical NO (t1/2 is of the order of seconds), however, make its direct detection a formidable task. Chemiluminescence, electron spin resonance (EPR), and electrochemical approaches are used for direct NO measurements. However, when applied to complex and dynamic biological systems, these approaches often have drawbacks in regard to operating procedures, detection sensitivity or selectivity.12–15 Since 1998, a series of diaminofluorescein (DAF) based fluorescent NO indicators have been developed.16 4,5-Diaminofluorescein (DAF-2) demonstrates high sensitivity and specificity to NO and has been widely applied for NO detection and imaging.17–21 It is likely that DAF-2 does not react directly with NO but with N2O3 formed in the course of NO oxidation, yielding triazolofluorescein product DAF-2T. DAF-2 does not react in neutral solutions with other oxidized forms of NO, such as NO2− and NO3−, and other reactive oxygen species, such as O2−, H2O2 and ONOO−, providing specificity for NO detection.16
In an effort to detect intracellular NO using DAF-2, we found that DAF-2 cross-reacts with dehydroascorbic acid (DHA) to produce fluorescent compounds, termed DAF-2-DHAs, while ascorbic acid (AA) considerably attenuates the formation of DAF-2T, possibly by effecting the formation of N2O3.22 Because both AA and DHA are found in millimolar levels in the same cell types as are often involved in NO signaling, this is a particularly confounding cross-reaction. Although CE can separate DAF-2-DHAs from DAF-2T, high intracellular levels of AA (up to millimolar23) make determination of the actual NO concentration difficult. In addition, catecholamines, superoxide radical, dithiothreitol, 2-mercaptoethanol, and glutathione can also interfere with the DAF-2 NO detection.24 Although the use of NOS inhibitors and NO scavengers along with DAF-2 allows one to detect NO production, quantitation using DAF-2 is hampered by the complexity of biological systems and the cross reactivity of DAF-2.
How can DAF-2 selectivity be improved? NO, unlike the interfering molecules, is a gas. Thus, the spatial separation of NO and DAF-2 containing solutions by a thin layer of air drastically reduces the number of substances which may interact with DAF-2. Only diffusible and reactive molecules such as NO can move from one region to another and react with DAF-2. The reaction of NO with amines at −78 °C was described.25,26 The mechanism of DAF-2T formation also involves reaction between NO and amine groups of DAF-2. We therefore chose to freeze the biological test solution and DAF-2 solution into microliter-volume blocks and measure the fluorescence product formed in the DAF-2-containing block. Using cryogenic spectroscopy, we confirm that NO diffuses and reacts with DAF-2 at dry-ice temperatures. We validate the approach and demonstrate that the spatial separation (contactless) of frozen NO from DAF-2 containing solution is a simple method to reduce or eliminate the confounding effects of other compounds on NO detection with DAF-2. Using this contactless DAF-2 NO detection method, we measure NO present in different vertebrate and invertebrate tissues. Simplicity, compatibility with both fluorimeter and CE detection systems, and its nondestructive nature make this approach a useful protocol for fundamental and clinical studies of NO production by different biological sources, as well as a method of validating the results of DAF-imaging.
Experimental
Reagents
All reagents were of the highest available purity and obtained from Sigma (St. Louis, MO) unless otherwise noted. Sodium borate decahydrate (Na2B4O7·10H2O) and monobasic sodium phosphate (NaH2PO4·H2O) were obtained from Fisher (Fair Lawn, NJ). All solutions were prepared in ultrapure water (Millipore, Bedford, MA). Supplemented with 0.45 mM Ca2+, PBS solution was prepared according to the published literature.27 NO gas with 99% purity was obtained from Matheson Gas (through S. J. Smith Welding Supply, Urbana, IL). To prepare the NO-saturated solution, a 0.1 M phosphate buffer solution (pH 7.4) was deoxygenated with nitrogen for 20 min, and then bubbled with NO gas previously cleaned by passing through 5 M NaOH solution. The saturated solution should contain ∼1.9 mM NO at room temperature.28 The desired concentrations were achieved using the method of serial dilutions. DAF-2 was obtained from Molecular Probes (Eugene, OR) as 5 mM solution in Me2SO. A 10 µM DAF-2 solution was prepared by dissolving 2 µL DAF-2 in 998 µL 0.1 M phosphate buffer (pH 7.4) for experiments with standards or in 998 µL PBS + Ca2+ buffer for biological experiments. In some experiments, the NO scavenger, 2-phenyl-4,4,5,5-tetramethylimidazoline-1-oxyl-3-oxide (PTIO) was added directly to the DAF-2 solution.Animals
The Aplysia californica (100–250 g) were obtained from Charles Hollahan (Santa Barbara, CA). Upon arrival, all animals were kept in an aquarium filled with constantly circulated artificial sea-water at ∼14 °C until use. Aplysia californica were anesthetized by injection of isotonic MgCl2 solution equal to half their body weight.For the mouse experiments, 6–7 week old male and female C57BL/6 mice, Mus musculus (Harlan, Indianapolis, IN) were quickly decapitated by guillotine and the cerebellum, pancreas, and external-internal abdominal oblique muscles were immediately sampled.
Cryogenic spectroscopy
All spectra at room temperature or 243 K were taken in a Cary 3 UV–Vis spectrophotometer (Varian, Australia) with a homemade cryostat using liquid nitrogen as a cooling agent, as described by Denisov et al.29 Methacrylate UV-enhanced semimicro cells (Fisher Scientific, Fair Lawn, NJ) were used through the entire experiment. All measurements were performed in a single beam mode in the 300–550 nm range with a scan speed of 100 nm min−1 and 2.0 nm resolution.Room temperature fluorometry
An F-3010 spectrophotometer (Hitachi, Tokyo, Japan) was used for the fluorimetric experiments. Emission fluorescence was scanned from 500 to 600 nm upon excitation at 495 nm. Scan speed, response time, and bandpass were 60 nm min−1, 2 s, and 5 nm, respectively.CE-LIF analysis
A laboratory-assembled CE system was employed for these experiments and has been described in detail previously.23,30 Briefly, CE separations take place in an 80 cm long, 50 µm id, 365 µm od fused-silica capillary (Polymicro Technologies, Phoenix, AZ). Approximately 7.6 nL samples were loaded onto the CE column by 8 s electrokinetic injection at 8 kV (12 µA). To shorten the total experimental time, consecutive analyte loadings were made in some experiments. In this case, a set of 5 injections at 2 min intervals was made, allowing the shortening of a 2.5 hour series of separations to 40 min. The results of these experiments were comparable to single injection separations with no visible distortion of the DAF-2T signal. Separations were performed at either 20 kV (40 µA) or 25 kV (53 µA). The Ar–Kr mixed-gas laser (Coherent, Innova 70 Spectrum, Palo Alto, CA) was employed as the excitation source at 352 nm. The resulting fluorescence was collected at 90° and measured with a photomultiplier tube (PMT) (Hamamatsu, HC125-03, Bridgewater, NJ) operating in photon counting mode.Sample preparation
For the CE experiments, 20 µL of 10 µM DAF-2 solution in 0.1 M phosphate buffer (pH 7.4) was frozen in a polymer tubing (Nalgene, Rochester, NY) to make a cylindrical ice block with 3.2 mm diameter and 2.5 mm thickness. 20 µL of NO in 0.1 M phosphate buffer was frozen at the bottom of a 0.2 mL PCR tube (Costar, Corning, NY) with a surface diameter 3.2 mm. The frozen DAF-2 block was placed onto the top of the NO block for 30 min to allow for NO diffusion and reaction with DAF-2. Next, the DAF-2 block was collected, stored on dry ice, and thawed before CE measurement. To accommodate the minimum volume requirement for our particular fluorimeter, 100 µL of DAF-2 solution, 100 µL of NO solution and 0.5 mL PCR tubes were used.All biological samples were collected immediately after an animal dissection. Approximately the same mass of Aplysia californica mouth area tissue, buccal mass, and gut were cut, quickly chopped by a razor blade, and placed into 0.5 mL PCR tubes. The samples were immediately frozen on dry ice. Then DAF-2 block was deposited for 2 h on top of the sample block. The DAF-2 block was collected, stored on dry ice, and divided into two aliquots after thawing. A 6 µL aliquot was saved for the CE measurement and the remaining 94 µL were diluted twice for fluorimeter experiments. The samples from the cerebellum, pancreas, and external-internal abdominal oblique of the mouse were prepared in the same manner without the sample homogenization step.
Results and discussion
Nitric oxide detection using the contactless DAF-2 method
Nitric oxide was detected using the approach illustrated in Fig. 1. DAF-2 and NO containing solutions were frozen into separate microliter-volume ice blocks and placed in contact with each other. After 30 min of contact, the DAF-2 block was taken out, thawed and analyzed using CE. Fig. 1B shows an electropherogram obtained using a separation voltage of 20 kV. DAF-2 reacts with the active intermediate product (N2O3) of NO oxidation, yielding a fluorescent compound DAF-2T that has a migration time of ∼23 min in our experimental conditions. Several additional peaks—likely unreacted DAF-2—are visible between ∼10–12 min but no peaks elute near the DAF-2T peak, making peak identification straightforward. A small blank DAF-2T peak was observed when solutions not expected to contain NO were analyzed. This peak is likely from pre-existing NO and/or N2O3 coming from air or the solution storage containers or both. The identity of the DAF-2T peak was confirmed by spiking with standards.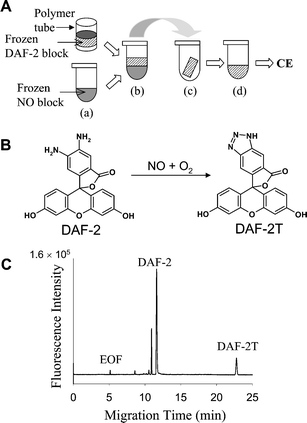 | ||
| Fig. 1 A, Arrangement of the sample and reagent blocks used for the DAF-2 contactless NO measurement. (a) The sample containing nitric oxide (NO) is placed in a microvial and frozen; the DAF-2 solution is placed in a polymer tube and frozen. (b) The DAF-2 block is positioned on top of the sample block. (c) The DAF-2 block is collected from the top of the NO block and placed in another polymer tube. (d) The DAF-2 block is thawed and analyzed by CE. B, The reaction between DAF-2 and NO in the presence of O2. C, The resulting capillary electropherogram from the DAF-2 block after exposure to NO shows the presence of DAF-2 and DAF-2T. | ||
One objective in this work was to investigate whether DAF-2 reacts with NO at low temperature. First, the formation of DAF-2T at room temperature was verified by continuous addition of a saturated NO solution into the DAF-2 solution with the spectral changes from DAF-2T formation monitored using absorbance spectroscopy. Absorbance increased at 350 nm, indicating DAF-2T formation (data not shown). Cryogenic spectroscopy was then performed to investigate DAF-2T formation in the frozen blocks. Four sequential spectra were recorded in time order, as shown in Fig. 2. The similar spectral pattern of DAF-2 was obtained at either 243 K or room temperature and either in the presence or absence of glycerol, which was added to improve the optical transparency at low temperatures (Fig. 2, curves 1 and 2). When a saturated NO block was placed onto the frozen DAF-2 solution at 243 K, the spectral change at 350 nm demonstrated the formation of DAF-2T (Fig. 2, curve 3), which is similar to ambient temperature absorbance spectra. An additional absorbance increase at 350 nm was observed after the NO block was melted at 298 K (Fig. 2, curve 4). This increase is not unexpected due to the faster NO diffusion and the decrease in the density of glycerol solution after thawing. These experimental results therefore demonstrate that NO diffuses and reacts with DAF-2 while frozen.
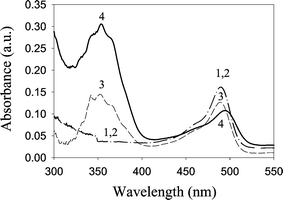 | ||
| Fig. 2 DAF-2T formation at low temperature. Absorption spectra of 10 µM DAF-2/DAF-2T in 2 ∶ 1 (v/v) glycerol–0.1 M potassium phosphate (pH 7.4) buffer. Curve 1, DAF-2 at 298 K. Curve 2, DAF-2 at 243 K. Curve 3, 10 min after saturated NO block was added at 243 K. Curve 4, after melting of NO block at 298 K. Spectral changes at 350 nm indicate DAF-2T formation. | ||
Optimization of NO reaction with DAF-2 at low temperature
To investigate NO diffusion parameters at low temperature, two DAF-2 blocks were placed on the top of NO block as illustrated in Fig. 3. The DAF-2 block located closer to the NO block trapped more NO; thus, more DAF-2T was detected. A smaller (P < 0.001, n = 3) DAF-2T peak was detected in the second DAF-2 block, not surprising given the longer diffusion distance for NO and NO depletion by the first DAF-2 block. DAF-2 blocks placed on the top of a 0.1 M phosphate buffer-containing block showed only DAF-2T blank peaks. When two DAF-2 blocks were arranged so that one was above and one was below the NO block, DAF-2T peaks of similar intensity were detected from either side (data not shown). Consecutive deposition of several DAF-2 blocks onto the same NO block resulted in a significant reduction of the resulting DAF-2T peak intensity after each new exposure (data not shown) demonstrating NO depletion from the source block.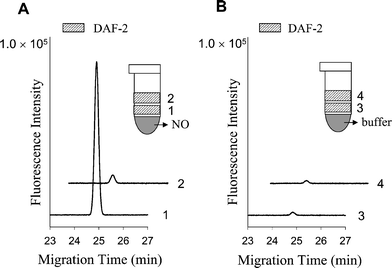 | ||
| Fig. 3 The DAF-2 contactless approach detects NO that diffuses into the DAF-2 block from the sample block. (A) Electropherograms of two DAF-2 blocks after exposure to NO. (B) Electropherograms of two DAF-2 blocks after exposure to phosphate buffer. Electropherograms 2 and 4 are shifted along the abscissa for easy viewing. | ||
Interestingly, we found that DAF-2T fluorescence can be much more intense in NO–DAF-2 mixtures that react at low temperatures than at room temperature. We are not sure of the mechanism of this low temperature signal enhancement. Drago et al.25 observed similar increases in the yield of product during a study of the reaction between amine group and NO at −78 °C and they postulated that low temperature facilitates the dimerization of NO. Because of this increased signal, the performance of this approach is comparable to previously reported room temperature fluorimeter experiments in which NO and DAF-2 solutions were mixed. This is surprising because one would expect a reduction of DAF-2T formation when only a fraction of the NO diffuses into the physically separated DAF-2 frozen block and forms product therein, compared with DAF-2T formation between NO and DAF-2 in the same concentration but mixed solutions at room temperature.
The linearity and the detection limit of the contactless NO detection are similar to standard fluorimetric assays. The DAF-2T signal increases linearly with NO concentration from 10 nM to 2 µM with a correlation coefficient of 0.985 (Fig. 4). The CE measurements of NO have a detection limit of 10 nM and reproducibility within 10%. The detection limit is, to a large extent, determined by the DAF-2T blank peak and therefore can be further lowered if the blank signal can be reduced or eliminated.
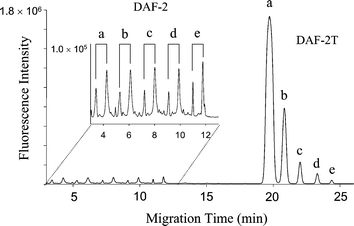 | ||
| Fig. 4 The DAF-2T fluorescence intensity depends on NO concentration. Sequential CE detection of NO: (a) 2 µM, (b) 1 µM, (c) 0.5 µM, (d) 0.2 µM, and (e) 0.05 µM using the contactless method. The first set of peaks in the electropherogram are reagent peaks and do not correspond to NO; the second set of peaks are DAF-2T peaks and scale with NO levels. | ||
The ability of the DAF-2 contactless NO detection method to eliminate AA and DHA interference was investigated by adding 1 mM AA and/or 1 mM DHA to the NO-containing solution. Over a range of NO concentrations, the P value (paired t-test, n = 6) is 0.370 for DAF-2T intensity measured in the presence and absence of AA and the P value (paired t-test, n = 6) is 0.358 for DAF-2T intensity measured in the presence and absence of DHA. Therefore, no detectable change in the DAF-2T fluorescence was detected in the presence of these compounds. The lack of DHA interference is expected because of the spatial separation of DHA from DAF-2. AA affects the lifetime of NO relative to N2O3. Either gas can, however, diffuse out of the AA-containing block into the DAF-2-containing block. NO can then form N2O3, and react with DAF-2 therein. Thus, it is not surprising that AA also has no effect on NO detection with this approach.
Because this new method eliminated interfering reactions, the possibility of quantifying NO using a fluorimeter rather than CE was tested. To accommodate the minimum volume requirement of typical cuvettes for fluorimetry, volumes of sample and DAF-2 solution were increased as described in the Experimental section. In these experiments, fluorescence intensity was linear with NO concentration (r2 = 0.986) within the range from 10 nM to at least 200 nM (data not shown). Concentrations beyond 200 nM were not considered physiological and were not examined.
NO measurements from biological samples
NO generated in Aplysia californica mouth area, buccal mass, and gut was measured (Fig. 5). In order to preserve the natural levels of NO in these tissue samples, no buffer solutions were used in these experiments. DAF-2T signal intensity was normalized by sample mass to allow comparisons between different samples. Fig. 5B shows typical electropherograms from these three tissues. Significant amounts of NO were observed only in the mouth area of Aplysia californica (P < 0.05 compared with gut, n = 12) with an estimated NO concentration between ∼50–200 nM. Fluorimetric measurements confirmed these CE results (Fig. 5A).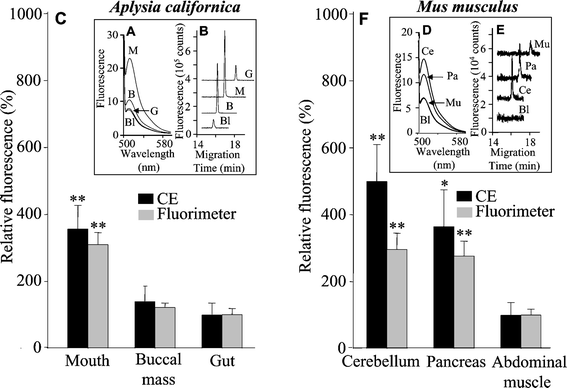 | ||
| Fig. 5 NO in different tissues of Aplysia californica (sea slug) and Mus musculus (mouse) obtained with CE and fluorimetric measurements. A, Typical emission spectra generated from three different tissues of Aplysia californica (M—mouth, B—buccal mass, G—gut, Bl—PBS + Ca2+ buffer); B, electropherograms of the same samples as in A, electropherograms for mouth, buccal mass, and gut are shifted along the abscissa for easy viewing; C, relative fluorescence intensity of Aplysia californica samples normalized to gut data obtained by CE and fluorimeter; D, typical emission spectra generated from three different tissues of Mus musculus (Ce—cerebellum, Pa—pancreas, Mu—external–internal abdominal oblique, Bl—PBS + Ca2+ buffer); E, electropherograms of the same samples as in (D), electropherograms for cerebellum, pancreas, and external–internal abdominal oblique are shifted along the abscissa for easy viewing; F, relative fluorescence intensity of Mus musculus samples normalized to external–internal abdominal oblique data obtained by CE and fluorimeter, each column represents the mean ± SE (n = 7 for both CE and fluorimeter measurements of Mus musculus; n = 12 for CE and n = 9 for fluorimeter measurements of Aplysia californica). (* P < 0.05; ** P < 0.01.) | ||
To further validate the contactless approach, NO levels in mouse cerebellum, pancreas, and the external–internal abdominal oblique of mice were also measured (Fig. 5 E, F and D). Data showed that both cerebellum and pancreas produce significant amounts of NO (P < 0.05 compared with external–internal abdominal oblique muscles, n = 7) with estimated concentration around ∼50–200 nM.
CE and fluorimeter data have similar trends regarding the certainty that mouth area in A. californica, and cerebellum and pancreas in mice, contain significant NO producing ability as shown in Fig. 5. It has been shown that mouse cerebellum has high NOS activity. NOS and NO therein are involved in various processes in the central nervous system including modulation of neurotransmitter release and synaptic plasticity.31–33 Both constitutive and inducible NOS are found in the pancreas and this NO may be involved in the regulation of insulin release.34,35 The vascular muscles are also NOS positive. As there are no reports of NOS expression in external–internal abdominal oblique muscles, the negative finding in this tissue is not surprising. Thus, our results are consistent with prior reports of NO activity in these tissues. NOS expression as well as NADPH diaphorase (NADPH-d) staining in different tissues of Aplysia californica has been reported,36 and the mouth area, which is positively NADPH-d stained, contains sensory cells reported to be a source of NO. Our experiments corroborate this finding. NOS has also been found in the esophagus of the pond snail Lymnaea stagnalis.37,38 Our results and other evidence, including biochemical, physiological, and behavioral experiments,39,40 clearly demonstrate the important role of NO in control of the feeding networks in different animal models.
Compared with CE data, the results of fluorimetric measurements are more reproducible. However, CE experiments allow us to track possible interferences in the NO assay by adding the power of a separation. After all, CE separates the unreacted DAF-2 and any DAF-2-DHA products from DAF-2T. DAF-2 and DAF-2T have nearly identical fluorescence spectra with the same emission maximum but different fluorescence intensity. For example, the quantum yield of DAF-2T is nearly 200-fold higher than that of DAF-2 at the excitation wavelength used in our experiments. Thus, DAF-2 fluorescence forms a background signal in fluorimetric measurements. Typically less than 10% of DAF-2 (Fig. 4) is involved in derivatization of NO making DAF-2 background a factor in low concentration NO measurements.27 Therefore, CE has advantages over fluorimetric approaches with DAF-2 when detecting low NO concentrations, especially in complex biological samples. Of course, the fluorimeter method is simpler and faster, more appropriate for large numbers of samples, and can be applied on almost any conventional instrument available at a variety of facilities including clinics and hospitals.
The effects of NO scavenger PTIO were also investigated. A final concentration of 0.5 mM PTIO was added to the DAF-2 solution. In the presence of PTIO, DAF-2T peak intensities measured by CE were reduced in A. californica mouth area by 92.6 ± 6.0% (P < 0.05, n = 3) and were below detection limits in mouse cerebellum and pancreas samples (n = 5). Similarly, in the presence of PTIO, DAF-2T peak intensities measured by fluorimeter also decreased (P ≤ 0.05, n = 3 or 5). PTIO did not significantly change the DAF-2T peak intensity when the DAF-2 block was superimposed with frozen mouse external–internal abdominal oblique muscles or A. californica buccal mass or gut (data not shown). These results are consistent with the finding that the mouth area in A. californica and the cerebellum and pancreas in mice contain NO.
Conclusions
We demonstrate a novel approach, termed the DAF-2 contactless method, to eliminate DHA and AA interferences from NO measurements with DAF-2 using either CE-LIF or a fluorimeter. This method takes advantage of the diffusion of NO in frozen solutions and the low temperature reaction between NO and DAF-2 to spatially separate a NO-containing sample from a fluorescent indicator by freezing them into separate blocks, which not only relieves the attenuation of DAF-2T formation, but also simplifies sample preparation and eliminates protein interferences commonly observed in CE experiments. The simplification of sample preparation gives us an opportunity to investigate NO levels at in vivo concentrations. Elimination of protein interferences results in electropherograms of DAF-2 blocks superimposed with biological samples similar to those obtained from pure standards (Fig. 1B) in contrast to those obtained from biological samples with added DAF-2, where often tens of overlapping peaks are present.22 Similarly, fluorescence spectra are free of interference from the native fluorescence of biological samples. In addition, this method allows nondestructive NO detection in biological samples that subsequently can be used for morphological and/or biochemical studies.There are also limitations of the DAF-2 contactless method. The largest is the elimination of spatial information from directly observing NO production using a fluorescence microscope. However, we expect the most important use of this approach is to validate DAF-2 measurements for a particular series of biological samples. If the values from the contactless method match the NO values from the direct approach, then conventional DAF-2 imaging can be used with confidence.
Our future work will determine if it is possible to perform a similar physical separation of DAF-2 from the biological sample without freezing the sample. For example, if a sample is placed over (or neurons are cultured on) a polymer film containing DAF-2 reagent, then NO should, whereas the interferences should not, still diffuse into the polymer and react with DAF-2, but this time in an arrangement compatible with fluorescence microscopy.
Acknowledgements
We gratefully thank Dr. Beckel-Mitchener for assistance in mouse sample preparation, Dr. Denisov for assistance with cryogenic spectroscopy and Andy Shaw for help with fluorimeter measurements. The financial support from NIH (NS31609 and MH60261) is gratefully acknowledged.References
- D. J. Stuehr, Methods Enzymol., 1996, 268, 324–333 CrossRef CAS.
- D. S. Bredt, P. M. Hwang and S. H. Snyder, Nature (London), 1990, 347, 768–770 CrossRef CAS.
- L. J. Ignarro, G. M. Buga, R. E. Byrns, K. S. Wood and G. Chaudhuri, Circulation, 1987, 76, 51 Search PubMed.
- L. C. Green, S. R. Tannenbaum and P. Goldman, Science, 1981, 212, 56–58 CrossRef CAS.
- J. Garthwaite, S. L. Charles and R. Chess-Williams, Nature (London), 1988, 336, 385–388 CrossRef CAS.
- D. S. Bredt and S. H. Snyder, Annu. Rev. Biochem., 1994, 63, 175–195 CrossRef CAS.
- P. Vallance and J. Leiper, Nature Rev. Drug Discovery, 2002, 1, 939–950 CrossRef CAS.
- T. Hayashi, D. Sumi, P. A. Juliet, H. Matsui-Hirai, Y. Asai-Tanaka, H. Kano, A. Fukatsu, T. Tsunekawa, A. Miyazaki, A. Iguchi and L. J. Ignarro, Cardiovasc. Res., 2004, 61, 339–351 CrossRef CAS.
- T. Nakaki and R. Kato, Jpn. Heart J., 1996, 37, 431–445 Search PubMed.
- N. C. Gocan, J. A. Scott and K. Tyml, Am. J. Physiol.—Heart and Circulatory Physiol., 2000, 278, H1480–H1489 Search PubMed.
- J. Garthwaite and C. L. Boulton, Annu. Rev. Physiol., 1995, 57, 683–706 CrossRef.
- A. V. Kozlov, A. Bini, A. Iannone, I. Zini and A. Tomasi, Methods Enzymol., 1996, 268, 229–236 CrossRef CAS.
- A. M. Leone, V. W. Furst, N. A. Foxwell, S. Cellek and S. Moncada, Biochem. Biophys. Res. Commun., 1996, 221, 37–41 CrossRef CAS.
- S. Archer, FASEB J., 1993, 7, 349–360 Search PubMed.
- L. L. Moroz, S. Radbourne and W. Winlow, Acta. Biol. Hung., 1995, 46, 155–167 Search PubMed.
- H. Kojima, N. Nakatsubo, K. Kikuchi, S. Kawahara, Y. Kirino, H. Nagoshi, Y. Hirata and T. Nagano, Anal. Chem., 1998, 70, 2446–2453 CrossRef CAS.
- J. F. Leikert, T. R. Rathel, C. Muller, A. M. Vollmar and V. M. Dirsch, FEBS Lett., 2001, 506, 131–134 CrossRef CAS.
- L. A. Brown, B. J. Key and T. A. Lovick, J. Neurosci. Methods, 1999, 92, 101–110 CrossRef CAS.
- C. S. Lodge, R. D. Allen, S. Arkle and J. F. Brown, Gastroenterology, 2001, 120, A311–A312.
- T. Yamamoto, Y. Suzuki, J. Kajikuri and T. Itoh, J. Pharm. Sci., 2003, 91, 76P–76P.
- X. H. Zhang and W. G. L. Kerrick, FASEB J., 2001, 15, A772–A772 Search PubMed.
- X. Zhang, W. S. Kim, N. Hatcher, K. Potgieter, L. L. Moroz, R. Gillette and J. V. Sweedler, J. Biol. Chem., 2002, 277, 48472–48478 CrossRef CAS.
- W. S. Kim, R. L. Dahlgren, L. L. Moroz and J. V. Sweedler, Anal. Chem., 2002, 74, 5614–5620 CrossRef CAS.
- N. Nagata, K. Momose and Y. Ishida, J. Biochem., 1999, 125, 658–661 CAS.
- R. S. Drago and F. E. Paulik, J. Am. Chem. Soc., 1960, 82, 96–98 CrossRef CAS.
- R. S. Drago, R. O. Ragsdale and D. P. Eyman, J. Am. Chem. Soc., 1961, 83, 4337–4339 CrossRef CAS.
- T. R. Räthel, J. F. Leikert, A. M. Vollmar and V. M. Dirsch, Biol. Proc. Online, 2003, 5, 136–142 Search PubMed.
- J. S. Beckman, D. A. Wink and J. P. Crow in Methods in Nitric Oxide Research, ed. M. Feelisch and J. S. Stamler, John Wiley, Chichester, UK, 1996, p. 61 Search PubMed.
- I. G. Denisov, T. M. Makris and S. G. Sligar, J. Biol. Chem., 2001, 276, 11648–11652 CrossRef CAS.
- P. D. Floyd, L. L. Moroz, R. Gillette and J. V. Sweedler, Anal. Chem., 1998, 70, 2243–2247 CrossRef CAS.
- M. J. Barjavel and H. N. Bhargava, Pharmacology, 1995, 50, 168–174 Search PubMed.
- M. Ikeda, K. Matsui, Y. Ishihara, I. Morita, S. Murota, T. Yuasa and T. Miyatake, Neurosci. Lett., 1994, 168, 65–68 CrossRef CAS.
- I. J. Rhyu, S. S. Nahm, S. J. Hwang, H. Kim, Y. S. Suh, S. I. Oda, T. C. Frank and L. C. Abbott, Brain Res., 2003, 977, 129–140 CrossRef CAS.
- B. Akesson, R. Henningsson, A. Salehi and I. Lundquist, J. Endocrinol., 1999, 163, 39–48 Search PubMed.
- R. Henningsson, A. Salehi and I. Lundquist, Am. J. Physiol. Cell Physiol., 2002, 283, C296–C304 CAS.
- M. Bodnarova, R. I. Sadreev, Y. V. Panchin, P. Uvarov, P. Lovell, P. Martasek and L. L. Moroz, Society for Neuroscience Annual Meeting, New Orleans, LA, 2003 Search PubMed.
- S. A. Korneev, M. R. Piper, J. Picot, R. Phillips, E. I. Korneeva and M. O'Shea, J. Neurobiology, 1998, 35, 65–76 Search PubMed.
- L. L. Moroz and R. Gillette, Acta Biol. Hung., 1995, 46, 169–182 Search PubMed.
- L. L. Moroz, R. Gillette and J. V. Sweedler, J. Exp. Biol., 1999, 202, 333–341 Search PubMed.
- L. L. Moroz, T. P. Norekian, T. J. Pirtle, K. J. Robertson and R. A. Satterlie, J. Comp. Neurol., 2000, 427, 274–284 CrossRef CAS.
| This journal is © The Royal Society of Chemistry 2004 |