Investigation of artificially produced and natural copper patina layers
F.
Noli
a,
P.
Misaelides
a,
A.
Hatzidimitriou
a,
E.
Pavlidou
b and
M.
Kokkoris
c
aDepartment of Chemistry, Aristotle University, GR-54124 Thessaloniki, Greece
bDepartment of Physics, Aristotle University, GR-54124 Thessaloniki, Greece
cTandem Accelerator Laboratory, NRCPS Demokritos, GR-15310 Aghia Paraskevi–Attiki, Greece
First published on 21st November 2002
Abstract
Patina layers artificially produced by chemical treatment of copper and bronze were characterized using ion-beam analysis techniques. In order to simulate the corrosion process, the samples were electrochemically treated in 0.5 M Na2SO4 solution at ambient temperature. The corrosion behavior of artificial Cu patina layers prepared on copper and bronze substrates was studied using potentiodynamic, potentiostatic, and cyclic voltammetric techniques. The composition of the patina layers, which mainly consisted of phases corresponding to the minerals cuprite, antlerite, and brochantite, was determined by energy dispersive spectroscopy and scanning electron microscopy was used to examine their surface morphology prior to and after the corrosion tests. A natural patina sample was also investigated in the same way for comparison purposes. Characterization of the untreated and the electrochemically treated samples was also performed by Rutherford backscattering spectroscopy and nuclear reaction analysis techniques. Backscattering of protons and deuterons, as well as the 16O(d,p)17O, 32S(p,p′γ)32S and 63Cu(p,nγ)63Zn nuclear reactions were used for the profiling of oxygen, sulfur, and copper in the patina layers under investigation. The measurements indicate that the composition of the artificially prepared antlerite and brochantite patina layers is very close to that expected stoichiometrically. The antlerite patinas are transformed during the electrochemical treatment in 0.5 M Na2SO4 solution to brochantite, whereas the brochantite patinas seem to remain unchanged.
1 Introduction
Copper patinas are characterized by complex chemical and metallurgical structures. The copper oxide cuprite (Cu2O), as well as the basic copper sulfates antlerite [CuSO4·2Cu(OH)2], brochantite [CuSO4·3Cu(OH)2], and chalcanthite (CuSO4·5H2O) are the dominant corrosion products formed during the extended atmospheric exposure of copper and copper alloys.1–5 A combination of several analytical techniques is required for the complete characterization of patina layers and identification of the mineral phases formed.6–9 On the other hand, the need for continuous monitoring of the deterioration of culturally significant objects exposed to the atmospheric environment necessitates the development of simple techniques applicable in situ (e.g. photoacoustic and photothermal deflection spectroscopy), which will also provide the data required for the eventual restoration. The calibration samples required for this purpose were artificially prepared and characterized using scanning electron microscopy (SEM), X-ray diffraction (XRD), X-ray photoelectron spectroscopy (XPS), Rutherford backscattering spectroscopy (RBS) and nuclear reaction analysis (NRA).8–10The objective of this work was the characterization of artificially and naturally patinated Cu and Cu alloy samples for the calibration of the above-mentioned in situ methods. For this purpose, the morphology, microstructure, and corrosion behavior of artificially patinated copper and copper alloy samples was investigated and ion-beam analysis techniques (RBS and NRA) were applied to the investigation and determination of the depth distribution of their constituent elements.
2 Experimental procedures
2.1 The investigated specimens
The copper (Cu) and bronze (Rg5) samples artificially patinated with cuprite, antlerite, brochantite, and mixed patinas were supplied by the Institute of Silicate Chemistry and Archaeometry of the University of Applied Arts of Vienna.10 The dimensions of the samples were 6 × 50 mm and the thickness 0.60 mm. Natural patina samples originating from Stockholm City Hall were also studied. The mineralogical composition of the samples was examined using XRD and XPS.102.2 Electrochemical tests
Electrochemical corrosion tests were performed in the potential region −400 to +200 mV.11–14 A Bank-Wenking PGS 81R potentio-galvanostat interfaced to a PC via a National Instruments Lab PC+ data acquisition card as well as an EGG-Princeton Applied Research corrosion cell filled with 700 ml of solution were used for the experiments. All tests were performed in 0.5 M Na2SO4 solutions at ambient temperature. A saturated calomel electrode was used as the reference electrode and graphite rods as auxiliary electrodes for all measurements. The sample (working electrode) was placed in a Teflon holder so that the surface exposed to the corroding solution was always 1 cm2. After the establishing the free corrosion potential (Ecorr) (establishment time: 30 min), five rapid scans (rate: 25 mV s−1) followed by a slow scan (rate: 0.25 mV s−1) were performed for each sample. Potentiostatic (open circuit potential, OCP) experiments were also performed over a long time period.2.3 Microscopy studies
The microstructure and surface morphology of the untreated and electrochemically treated samples was examined by SEM. A JEOL JSM 840A microscope equipped with an Oxford ISIS 300 EDS analyzer was utilized to determine the composition of the substrates and patina layers.2.4 Characterization by ion-beam analysis techniques
The untreated and the electrochemically treated samples were investigated by proton and deuteron Rutherford backscattering spectroscopy at the 4.5 MV Tandem Accelerator of the NRCPS Demokritos. A projectile energy of 1.5 MeV and a scattering angle of 170° were selected for the p-RBS measurements, while an energy of 1.55 MeV and a scattering angle of 135° were used for the d-RBS. All measurements were performed in a scattering chamber equipped with a computer-controlled precision goniometer.The nuclear reaction analysis experiments were performed at the same Laboratory. The 16O(d,p)17O nuclear reaction using deuterons of 1.55 MeV energy and a 135° detection angle was applied to the determination of the oxygen depth distribution in the near-surface layers of the patinas.15
The sulfur depth distribution was determined using the 3.379 MeV resonance of the 32S(p,p′γ)32S reaction.16 Detection of the 2.230 MeV γ-rays emitted was performed with a high purity Ge detector set at an angle of 90° to the proton beam direction. The energy of the proton beam supplied by the accelerator was varied in steps of 30 to 50 keV within the region 3.375–3.700 MeV, enabling sulfur profiling to be carried out. The observation of the 113 keV γ-line of the 63Cu(p,nγ)63Zn nuclear reaction, simultaneously with the 2.230 MeV γ-line of the 32S(p,p′γ)32S reaction, also provided the means for copper depth profiling.
3 Results and discussion
Table 1 gives characteristics of the patina layers artificially formed on copper (Cu) and copper alloy (Rg5) substrates. The color of the samples varied from brown to red in the case of cupritic coatings and yellow to green for antleritic and brochantitic ones. Natural patina samples were light green and their thickness was determined to be around 10–12 µm.5 The thickness of the artificial patina layers varied between 15 and 40 µm, as determined by SEM. The variation of the thickness was partly due to the roughness of the sample surface and to the orientation of the crystals formed. After the preparation, the synthetic patina coatings were characterized by XRD, XPS, RBS, and NRA.8–10| Sample | Thickness/µm | Color |
|---|---|---|
| Copper (Cu) | — | — |
| Natural patina | 10–12 | Light green |
| Cu + antlerite | 20–23 | Green |
| Cu + cuprite | 20–22 | Red–brown |
| Cu + brochantite | 20–25 | Dark green |
| Cu + antlerite + brochantite | ∼40 | Green |
| Bronze (Rg5) | — | — |
| Rg5 + antlerite | 20–23 | Green |
| Rg5 + cuprite | 20–22 | Red–brown |
| Rg5 + brochantite | 20–25 | Dark green |
| Rg5 + antlerite + brochantite | 40 | Green |
3.1 Electrochemical investigation
The rapid scan potentiodynamic polarization curve obtained for a copper substrate in 0.5 M Na2SO4 is given in Fig. 1. The corresponding curves of brochantitic, antleritic, and cupritic patina layer formed on copper substrates are also presented. The corrosion potential (Ecorr), as well as the corrosion current (Icorr), values obtained for the different samples are listed in Table 2. The values of the corrosion potential (−23 mV) and the corrosion current (56 µA) of copper determined from extrapolation of the second cathodic curve are in good agreement with previously published literature data concerning the corrosion of pure copper in Na2SO4 solution.17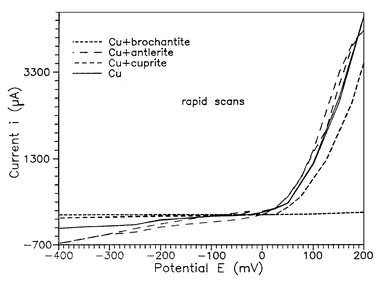 | ||
| Fig. 1 Potentiodynamic polarization curves (rapid scan) for a copper substrate and of patina layers on copper substrates in 0.5 M Na2SO4. | ||
| Sample | E corr/mV | I corr/µA |
|---|---|---|
| Copper (Cu) | −23 | 56 |
| Natural patina | −25 | 30 |
| Cu + antlerite | −10 | 30 |
| Cu + cuprite | +10 | 19 |
| Cu + brochantite | 0 | 1 |
| Cu + antlerite + brochantite | −10 | 170 |
| Bronze (Rg5) | +6 | 32 |
| Rg5 + antlerite | 0 | 13 |
| Rg5 + cuprite | +20 | 22 |
| Rg5 + brochantite | 0 | 0 |
| Rg5 + antlerite + brochantite | 0 | 120 |
In the case of the copper substrate, the corrosion reaction involves both the dissolution of the metal and the reduction of dissolved oxygen. The anodic peak was assigned to the formation of a hydrous Cu2O layer (2Cu + H2O → 2Cu2O + 2H+ + 2e−; E0 = 0.46 V vs. SHE) and the peak appearing in the voltammograms of the patinated substrates to the additional formation of an outer Cu(OH)2 film on the already formed hydrous Cu2O layer (Cu2O + 3H2O → Cu(OH)2 + 2H+ + 2e−).
From the experimental results (Table 2), it is obvious that the corrosion current decreases following the sequence Cu substrate > natural patina > Cu + antlerite > Cu + cuprite > Cu + brochantite. This sequence indicates the increasing corrosion resistance of the material. This tendency is also indicated by the shift of the corrosion potential towards more positive values. In general, such a shift of the corrosion potential characterizes a passivation of the material, while a shift in the opposite direction signifies an activation process.
The electrochemical investigation of different artificially prepared patina layers leads to the conclusion that the corrosion rate strongly depends on the nature of the substrate and the composition of the layer. Preparation characteristics, such as thickness of the patina layer, surface roughness, porosity, adhesion, etc., can also play an important role.
The patinated bronze substrates exhibit higher corrosion resistance than the corresponding patinated copper substrates. The highest corrosion protection effect is observed in the case of substrates coated with brochantitic patina layers. The patina layers consisting of mixed phases (e.g. antlerite + brochantite) show a decreased corrosion resistance. Mixed phases appear in natural patinas, explaining their limited corrosion protection ability. The stability of substrates coated by patinas containing mixed phases primarily depends on the presence and the percentage of brochantite.
It should be noted that no significant differences were observed during the subsequent sweeps as well as during slow scans, demonstrating the good quality and the adhesion of the formed patina layers. The anodic currents observed during the slow scan investigation of untreated copper and bronze substrates are much higher than those from the fast scans, indicating activation of the surface and increased corrosion rates. It is well known that in the case of uncoated copper substrates, the electrochemical treatment leads to Cu(I) ions, finally forming Cu2O. The formation of a thin Cu2O layer has also been observed after 1 to 48 h exposure of copper specimens to air.3,4
In the case of the patinated samples, the pre-existence of a thin Cu2O layer was assumed. The predominant processes taking place during the electrochemical treatment of patinated samples in Na2SO4 solutions are the transformation of Cu(I) ions to Cu(II) and the final formation of CuSO4 and Cu(OH)2.3,5
In the case of brochantitic patinas, the current transforms the rest of the Cu2O layer to brochantite. The current required for this transformation is low, leading to the conclusion that brochantitic patinas present the lowest corrosion rates and the highest stability among all patina layers. This conclusion is in good agreement with literature references indicating that brochantite is more stable than antlerite in solutions with pH > 3.5.1,3
Fig. 2 shows the OCP versus time of a non-patinated bronze (Rg5) substrate and others patinated with antlerite and cuprite. The potential of the Rg5 sample is almost stable over a long time period. In the case of the Rg5 sample patinated with antlerite, a slight shift of the potential in the direction of greater activity was observed in the first 24 h, probably due to the nature of the patina layer (porosity, orientation of the crystals on the surface), followed by a continuous rise before stabilizing at a higher value than the non-patinated sample. In the case of the cupritic patina, an initial gradual change of the potential in the positive direction is followed by a steady-state value indicating the good quality of the patina layer.
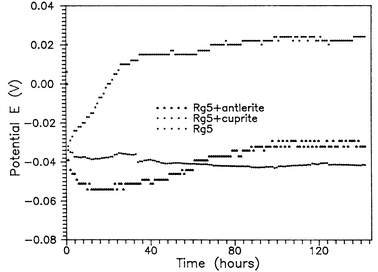 | ||
| Fig. 2 OCP curves for a bronze substrate and patina layers on bronze substrates in 0.5 M Na2SO4. | ||
3.2 SEM examination
SEM examinations revealed the porosity and morphology differences between the investigated patina layers. The artificial copper patinas seem to be spatially quite heterogeneous. Their surfaces are not smooth and uniform, showing the high porosity common to natural patinas formed under atmospheric conditions. The microphotograph in Fig. 3 shows the surface morphology of a natural patina, after the corrosion treatment, consisting of fine grains and flakes. The electrochemical treatment did not cause a considerable change in the appearance of the investigated sample. The presence of the large number of pores obvious in the SEM picture, could explain the ability of copper patinas to sorb significant quantities of water. Energy dispersive spectroscopy revealed concentrations of other elements (e.g. Fe, Si, and P) in the small pits shown in Fig. 3. The Cu∶S ratio determined supports the formation of a mixed antlerite–brochantite patina.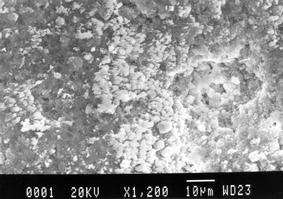 | ||
| Fig. 3 Surface morphology (SEM image) of a natural patina after corrosion treatment. | ||
Fig. 4 shows a cross-sectional SEM image of a copper sample covered by antleritic patina. The patina layer is not continuous and has irregularities and cavities in its structure.1,2 The shaded band on the left-hand side of the image is the copper substrate, followed by a layer of copper oxide and a final layer of basic copper sulfate (antlerite). The thickness of the patina layer was estimated to be ca. 20 µm.
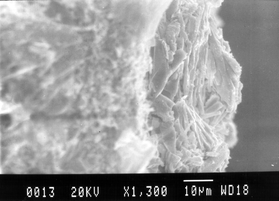 | ||
| Fig. 4 Cross-sectional SEM image of a copper sample covered by antleritic patina. | ||
Fig. 5(a) and (b) show bronze specimens patinated with antlerite and brochantite, respectively. Two types of developed patinas can be observed in these images. The surface of the antleritic patina [Fig. 5(a)] looks relatively homogeneous, with small pits, whereas the brochantitic layer [Fig. 5(b)] is rather thick, consisting of flakes uniformly distributed over the whole surface. Fig. 5(c)–(e) show microphotographs of the same patinas layers at higher magnification. The antleritic patina contains irregular formations [Fig. 5(c)] consisting of large sulfate crystals (orthorhombic) and small poorly crystallized particles [Fig. 5(e)], as in the case of brochantitic patina. The sodium concentration from the EDS analysis in regions consisting of small crystals leads to the conclusion that the crystallization is not complete. The Cu∶S ratio was also always found to be higher than the theoretical value corresponding to the formation of antlerite and brochantite. The brochantite patinas consist of local clusters of sulfate crystals [Fig. 5(d)]. This type of dendritic development consisting of large individual crystals is also the dominating morphology in mixed antlerite–brochantite patinas [Fig. 5(f)]. The only difference between the brochantite and mixed patinas was observed using an optical stereomicroscope, where the mixed patinas were found to exhibit small pits, signifying poor adhesion. This observation is in agreement with the potentiodynamic polarization data, explaining the poor stability and the lack of corrosion resistance of the mixed patina layers.
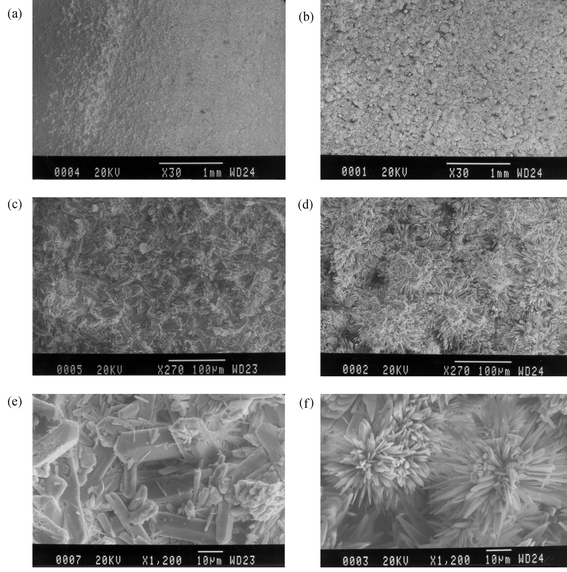 | ||
| Fig. 5 SEM images of copper samples covered with antleritic (a, c, e), brochantitic (b, d), and mixed antleritic–brochantitic (f) patinas. | ||
No significant changes were observed in the surface morphology of the non-coated copper substrate sample after the electrochemical treatment.
Finally, Fig. 6 shows the morphology of a copper specimen covered with cupritic patina after the electrochemical treatment, which is characterized by large homogeneously distributed cubo-octahedral crystals. The electrochemical treatment did not cause any significant changes in the surface morphology of the sample.
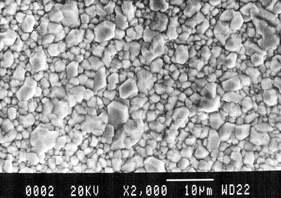 | ||
| Fig. 6 SEM image of a copper specimen covered with cupritic patina after the electrochemical treatment. | ||
3.3 Ion-beam analysis techniques
Fig. 7(a) presents the 1H+-RBS spectra of a non-treated and an electrochemically treated copper substrate. The corrosion of the copper sample is obvious from the form of the spectrum. The missing edge indicates the formation of a copper oxide layer on the material surface. Relevant backscattering spectra of a natural and an antleritic patina formed on copper substrates are given in Fig. 7(b) and (c), along with simulations of the spectra.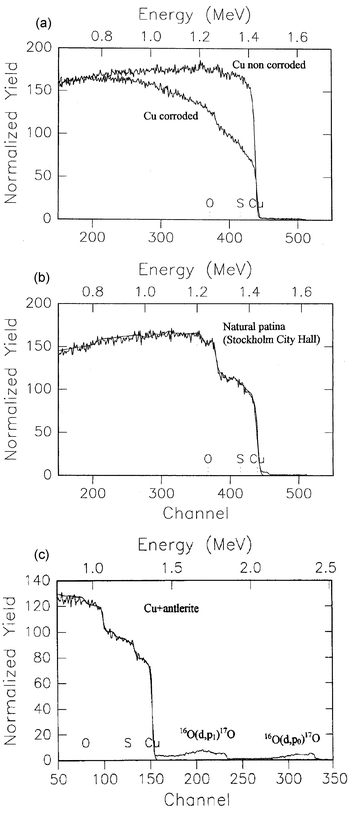 | ||
| Fig. 7 RBS spectra of a non-treated and an electrochemically treated copper substrate (a), and of natural (b) and antleritic (c) patinas on copper substrates. | ||
The analysis of the RBS spectra using Monte Carlo simulation procedures (RUMP) can provide reliable results for the near surface layers of the material, as well as for the depth distribution of the constituent elements (O, S, and Cu) of the copper and copper alloy substrates.17,18Tables 3 and 4 include the experimentally determined O∶S ratios, which characterize the patinas, obtained from the RBS measurements. The uncertainty in these measurements is of the order of 15%. These results lead to the conclusion that the patinas are not homogeneous and do not correspond stoichiometrically to a specific copper mineral phase along their whole thickness, but only in their upper layer. The O∶S ratio of antlerite, calculated on the basis of its chemical formula, is 8∶1, whereas the corresponding value for brochantite is 10∶1. It should be mentioned that the O∶S ratios are in good agreement with data derived using XPS measurements.10
| Sample | O∶S ratio and corresponding depth |
|---|---|
| Copper (Cu) | O detected to 1.0 µm |
| Cu (corroded) | 9∶1 to 0.5 µm, >10∶1 at 0.5–2.4 µm |
| Cu + antlerite | 8∶1 to 3.0 µm, >8∶1 at 3.0–5.0 µm |
| Cu + antlerite (corroded) | 10∶1 to 3.0 µm, >10∶1 at 3.0–5.0 µm |
| Cu + brochantite | 10∶1 to 3.0 µm, >10∶1 at 3.0–5.0 µm |
| Cu + brochantite (corroded) | 10∶1 to 3.0 µm, >10∶1 at 3.0–5.0 µm |
| Cu + cuprite | O detected to 1.0 µm |
| Cu + cuprite (corroded) | 8∶1 to 1.0 µm, 10∶1 at 1.0–1.5 µm |
| Cu + antlerite + brochantite | 10∶1 to 2.5 µm, >10∶1 at 2.5–3.0 µm |
| Cu + antlerite + brochantite (corroded) | 10∶1 to 2.5 µm, >10∶1 at 2.5–3.0 µm |
| Natural patina | 9∶1 to 1.5 µm, >9∶1 at 1.5–2.6 µm |
| Sample | O∶S ratio and corresponding depth |
|---|---|
| Bronze (Rg5) | O detected to 1.2 µm |
| Rg5 (corroded) | 8.5∶1 to 1.3 µm |
| Rg5 + antlerite | 8∶1 to 3.5 µm |
| Rg5 + antlerite (corroded) | 10∶1 to 3.5 µm |
| Rg5 + brochantite | 10∶1 to 3.0 µm, 12∶1 at 3.0–5.0 µm |
| Rg5 + brochantite (corroded) | 10∶1 to 3.0 µm, 14∶1 at 3.0–5.0 µm |
| Rg5 + cuprite | O detected to 1.3 µm |
| Rg5 + cuprite (corroded) | 8∶1 to 0.7 µm, 10∶1 at 0.7–1.3 µm |
| Rg5 + antlerite + brochantite | 10∶1 to 2.5 µm, >10∶1 at 2.5–3.0 µm |
| Rg5 + antlerite + brochantite (corroded) | 10∶1 to 2.5 µm, >10∶1 at 2.5–3.0 µm |
In the case of the electrochemically treated copper substrate, the elemental depth distribution shows a decrease in the copper content in the surface layers due to corrosion of the sample, which is also indicated by a corresponding increase of the S and O concentration. The O∶S ratio also shows that the electrochemical treatment of the non-patinated Cu and copper alloy substrates results in the formation of a patina surface layer with a composition corresponding to the copper hydroxysulfates antlerite and brochantite.
Similar data for the non-corroded and electrochemically corroded cupritic patina lead to the conclusion that the O and Cu depth profiles in both samples show the same tendency. The O∶S ratio in the electrochemically treated sample approaches the corresponding value of antlerite (8∶1) as result of the conversion of cupritic patinas to antleritic after the electrochemical treatment.
The O, S, and Cu depth distributions obtained by analysis of the RBS spectra of non-corroded and corroded antleritic patina layers on copper substrates are shown in Fig. 8(a) and (b), while the relevant distributions for brochantitic patina are shown in Fig. 8(c). The elemental depth profiles are in agreement with literature data concerning copper patinas of similar thickness.15 The experimental O∶S and O∶Cu ratios of the non-corroded antlerite and brochantite patinas approach the expected values obtained from the chemical formula of the compounds in the first layers. The O, S, and Cu profiles of the corroded antlerite patina correspond to brochantite, supporting the assumption of an antlerite to brochantite transformation during the electrochemical treatment in 0.5 M Na2SO4 solutions. This transformation was actually expected, taking into account the thermodynamic stability of brochantite in solutions of pH 3.5–6.5 and the corresponding phase diagram.5
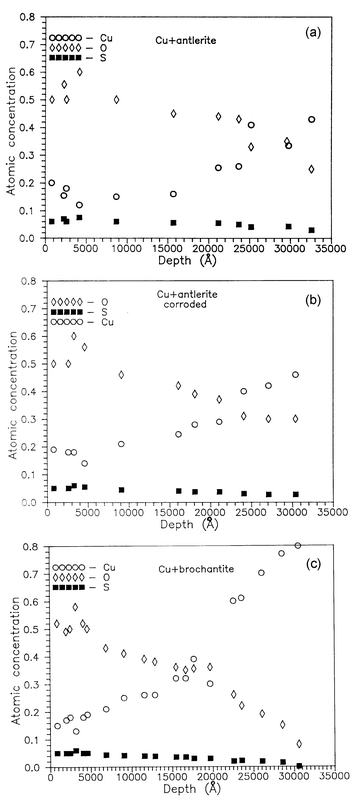 | ||
| Fig. 8 Elemental depth distributions (RBS simulations) of non-corroded (a) and corroded (b) antleritic patina layers on copper substrates, and a non-corroded brochantitic patina layer on a copper substrate (c). | ||
On the other hand, brochantite seems to be stable and does not undergo any further transformations. In the case of mixed patina layers (e.g. antlerite + brochantite) subjected to electrochemical corrosion treatment, the O∶S ratio also seems to remain unchanged. The stability of substrates coated by patinas containing mixed phases primarily depends on the presence and the percentage of brochantite, explaining in this way the behavior of natural patinas, which mainly consist of mixed phases.
The elemental depth profiles of the non-treated and electrochemically treated natural patina samples appear to be very similar, and their O∶S ratios almost correspond to brochantite. This was also verified using other techniques, i.e. XPS and photoacoustic and photothermal deflection spectroscopy.10 The compositions of the above samples are in good agreement with previously presented data.19
Fig. 9 shows some representative sulfur profiles for antlerite–brochantite on copper before and after the electrochemical treatment determined by means of the 32S(p,p′γ)32S nuclear reaction. This approach provides higher depth resolution than the RBS techniques (a few nm), due the narrowness of the resonances utilized. The depth resolution in the case of RBS strongly depends on the energy resolution of the silicon barrier detector used. It is obvious that the observed sulfur depth distribution in the investigated layer does not change a great deal after the electrochemical treatment of the samples. Only some changes in the sulfur concentration could be observed. The S distribution is almost the same on the corroded natural patina and the mixed antleritic-brochantitic patina layer, signifying that the composition of natural patinas is closer to a mixed phase.
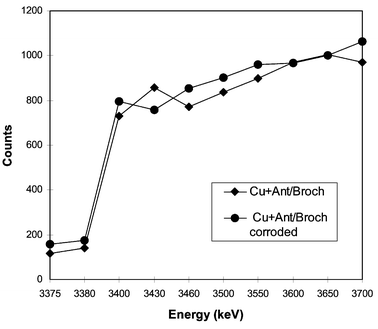 | ||
| Fig. 9 Sulfur profiles determined by means of the 32S(p,p′γ)32S nuclear reaction for mixed antleritic–brochantitic patina layers before and after electrochemical treatment. | ||
The observation of the 113 keV γ-line of the 63Cu(p,nγ)63Zn nuclear reaction simultaneously with the 2.230 MeV γ-line of the 32S(p,p′γ)32S reaction provides the means for copper depth profiling in the samples under investigation. Fig. 10 shows the Cu depth distribution for non-treated and electrochemically treated antleritic and brochantitic artificial patina layers formed on bronze substrates. In the case of brochantitic patinas, the Cu distribution exhibits slight differences and the copper profiles show the same tendency. For antleritic patinas, the difference between the Cu distributions is more obvious due to the higher corrosion rate of these patinas. The depth scale in Fig. 9 and 10 is given in energy units because of the uncertainty of the depth determination using unknown density values for the individual layers. Taking into account the theoretical density of antlerite and brochantite, it can be estimated that protons of 3.500 MeV energy can probe for sulfur to a depth of ca. 5 µm, whereas the corresponding value for 3.700 MeV protons is ca. 15 µm. The depth calculations were performed using the Monte Carlo code TRIM.20 The uncertainties in the sulfur and copper determinations are less than 3 and 10%, respectively.
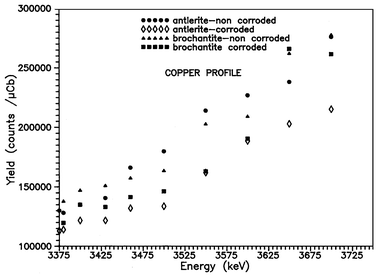 | ||
| Fig. 10 Cu depth distribution for non-treated and electrochemically treated antleritic and brochantitic patina layers on bronze substrates determined by means of the 63Cu(p,nγ)63Zn nuclear reaction. | ||
Fig. 11 shows characteristic oxygen profiles for corroded bronze and for the same substrate covered by an antleritic patina layer before and after the corrosion treatment. The oxygen distribution profiles were obtained using the 16O(d,p)17O nuclear reaction. A slight shift of the oxygen distribution towards deeper layers is observed in the corroded sample. The total oxygen concentrations were found to be 29, 65, and 71 µg cm−2 for corroded bronze and the antleritic patina layer on bronze before and after the corrosion treatment, respectively.
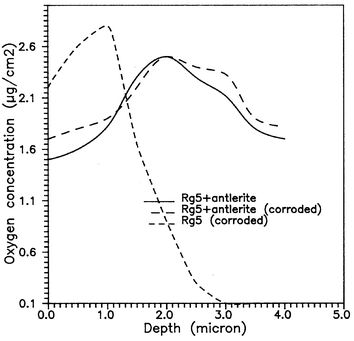 | ||
| Fig. 11 Oxygen profiles determined using the 16O(d,p)17O nuclear reaction for corroded bronze and an antleritic layer on bronze before and after electrochemical treatment. | ||
The nuclear reaction analysis (NRA) can probe near-surface layers of limited thickness (a few µm), providing higher depth resolution in comparison with other ion-beam techniques.15 The uncertainty in the oxygen determination using NRA is less than 10%.
4 Conclusions
A combination of several analytical techniques (SEM, EDS, NRA, and RBS) has been successfully applied to the characterization of near-surface layers of patinas to provide valuable information about their elemental composition as a function of depth from the surface. The measurements performed in order to understand the formation of patinas on copper and bronze substrates indicate that the composition of the investigated antlerite and brochantite patina layers was very close to the theoretical values. Electrochemical treatment of the non-patinated Cu substrates resulted in the formation of a patina surface layer with a composition corresponding to the copper hydroxysulfates antlerite and brochantite.The antleritic patinas were transformed during the electrochemical corrosion treatment to brochantitic layers, which are thermodynamically more stable, whereas the brochantitic patinas appeared to remain unchanged. No major changes were observed in mixed patina layers after the electrochemical corrosion treatment, whereas the corrosion of the copper and bronze (Rg5) substrates, as well as of cuprite, led to layers with compositions close to that of antlerite. SEM examination showed that the patinas are layers of a discontinuous form composed of many individual crystals; cubo-octahedral in the case of cuprite, orthorhombic in the case of antlerite, orthorhombic in dendritic development in the case of brochantite. The electrochemical treatment did not cause any significant changes in the surface morphology of the patinas.
Acknowledgements
Part of this work was performed within the frame of the research program ENV4-CT95-0098. The authors would like to thank the CEC for financial support, Profs. A. Vendl and B. Pichler (ISCA, Universität fűr Angewandte Kunst, Wien) for providing the patina samples, the staff of the Tandem accelerator of the NRCPS Demokritos for their assistance during the measurements and Dr H. Klewe-Nebenius (Forschungszentrum Karlsruhe) for the XPS data and for valuable discussions concerning the results.References
- T. E. Graedel, K. Nassau and J. P. Franey, Corros. Sci., 1987, 27(7), 639 CrossRef CAS.
- J. P. Franey and M. E. Davis, Corros. Sci., 1987, 27(7), 659 CrossRef CAS.
- T. E. Graedel, Corros. Sci., 1987, 27(7), 721 CrossRef CAS.
- K. Nassau, A. E. Miller and T. E. Graedel, Corros. Sci., 1987, 27(7), 703 CrossRef CAS.
- T. E. Graedel, Corros. Sci., 1987, 27(7), 741 CrossRef CAS.
- I. Odnevall and C. Leygraf, J. Electrochem. Soc., 1995, 142(11), 3682 CAS.
- G. Moretti, F. Guidi, G. Capobianco and R. Tonini, J. Mater. Chem., 2001, 11, 922 RSC.
- F. Noli, P. Misaelides, A. Hatzidimitriou, S. Kossionides, A. Vendl and H. Klewe-Nebenius, Proceedings of the 5th International Conference on Environmental Pollution, Thessaloniki, 2000, University of Thessaloniki, Greece, 2000, p. 624 Search PubMed.
- G. Kaliabakos, S. Kossionidis and P. Misaelides, Nucl. Instrum. Methods Phys. Res., Sect. B, 2000, 170, 467 Search PubMed.
- R. Schlesinger, H. Klewe-Nebenius and M. Bruns, Surf. Interface Anal., 2000, 30, 135 CrossRef CAS.
- Electrochemical Corrosion Testing, ed. F. Mansfled and U. Bertocci, STP 727, American Society for Testing and Materials, Philadelphia, 1981, p. 274–282 Search PubMed.
- Laboratory Corrosion Tests and Standards, ed. G. S. Haynes and R. Baboian, American Society for Testing and Materials, Philadelphia, 1985 Search PubMed.
- Corrosion Tests and Standards: Application and Interpretation, ed. R. Baboian, American Society for Testing and Materials, Philadelphia, 1995 Search PubMed.
- M. M. El-Naggar, J. Mater. Sci., 2000, 35, 6189 CrossRef CAS.
- Handbook of Modern Ion Beam Materials Analysis, ed. J. R. Tesmer and M. Nastasi, Materials Research Society, Pittsburgh, 1998 Search PubMed.
- C. Tsartsarakos, P. Misaelides and A. Katsanos, Nucl. Instrum. Methods Phys. Res., Sect. B, 1990, 45, 33 Search PubMed.
- L. R. Doolittle, Nucl. Instrum. Methods Phys. Res., 1981, 182/183, 899 Search PubMed.
- L. R. Doolittle, Nucl. Instrum. Methods Phys. Res., Sect. B, 1986, 15, 227 Search PubMed.
- R. L. Opilla, Corros. Sci., 1987, 27, 685 CrossRef.
- J. F. Ziegler, J. P. Biersack and U. Littmark, The Stopping and Range of Ions in Solids, Pergamon, New York, 1985 Search PubMed.
| This journal is © The Royal Society of Chemistry 2003 |