Monitoring dissolved organic carbon in surface and drinking waters
Christian
Volk
*a,
Larry
Wood
a,
Bruce
Johnson
a,
Jeff
Robinson
b,
Hai Wei
Zhu
c and
Louis
Kaplan
d
aIndiana-American Water Company Inc., PO Box 1152, Muncie, IN 47308-1152, USA. E-mail: cvolk@amwater.com; Fax: 765-741-1258; Tel: 765-741-1274
bIndiana-American Water Company Inc., PO Box 570, Greenwood, IN 46142, USA
cSievers Instruments Inc., 6060 Spine Rd., Boulder, CO 80301, USA
dStroud Water Research Center, 970 Spencer Rd., Avondale, PA 19311, USA
First published on 14th January 2002
Abstract
The presence of natural organic matter (NOM) strongly impacts drinking water treatment, water quality, and water behavior during distribution. Dissolved organic carbon (DOC) concentrations were determined daily over a 22 month period in river water before and after conventional drinking water treatment using an on-line total organic carbon (TOC) analyzer. Quantitative and qualitative variations in organic matter were related to precipitation and runoff, seasons and operating conditions. Following a rainfall event, DOC levels could increase by 3.5 fold over baseflow concentrations, while color, UV absorbance values and turbidity increased by a factor of 8, 12 and 300, respectively. Treated water DOC levels were closely related to the source water quality, with an average organic matter removal of 42% after treatment.
Introduction
Natural organic matter (NOM) in surface waters can be at the origin of various problems in drinking water. Organic material can be responsible for water taste, odor and color. Organic compounds also lead to the formation of disinfection by-products (DBPs) after reacting with disinfectants during water treatment. NOM can be related to bacterial proliferation within distribution systems. Therefore, the control of organic matter has been recognized as an important part of the operation of drinking water plants and distribution systems.Organic material can originate from various sources. The fraction of organic matter that derives from the biota growing in the water bodies is classified as internal or autochthonous NOM. This source of organic matter is due to the excretion and decay of organisms including bacteria, algae and vascular plants. The external organic matter (allochthonous) enters the water stream from the watershed, and originates from degradation of terrestrial vegetation and soil leaching during runoff.1,2 Chemical characterization of organic matter is also complex. To date, it has not been possible to identify all organic molecules in water. The difficulty of this approach results from the great complexity of the organic matrix, constituted by a mixture of hundreds of simple molecules or hetero-polymers, and the very low concentration of these compounds. Consequently, organic matter characterization is only possible through various fractionation and measurement techniques that give partial information on organic matter levels, and chemical functions or molecules, depending on the methodology used.3,4
Surrogate parameters such as total organic carbon (TOC) or dissolved organic carbon (DOC) provide an indication of the total organic matter concentration. TOC analyzers measure the level of organic carbon amenable to oxidation to CO2 using a combination of oxidizing agents (persulfate), and UV light or high temperature. The amount of carbon dioxide (CO2) produced can be measured using non-dispersive infrared absorption or conductivity. Since most waters contain carbonates and bicarbonates, the concentrations of those inorganic compounds are either measured or the samples are acidified and purged with an inert gas to remove the inorganic carbon (IC), prior to determination of TOC. Organic matter levels in fresh waters typically range from 0.1 mg L−1 to 10–20 mg L−1.5,6
Moreover, the composition and structure of the organic matter, the presence of specific polymers or chemical functions, and the apparent molecular weight of organic compounds can be determined using sophisticated testing including elemental analysis, spectrophotometric measurement, HPLC, pyrolysis GC-MS, NMR, ultra-filtration, or resin fractionation.4 The NOM generally includes humic substances (humic and fulvic acids), and non-humic materials including hydrophilic acids, amino-acids, proteins, carbohydrates, carboxylic acids and other trace compounds.2,4,7–9
A variety of treatment processes can be used to control organic matter in drinking water. Removal of organic matter varies widely, and generally between 10 and 90%.10 The degree of organic carbon removal depends on several parameters such as the quality and quantity of organic materials in the source water, the treatment train design and operational conditions. In general, organic matter levels are reduced after settling, adsorption, granular activated carbon (GAC) filtration or membrane processes. Oxidation processes with ozone or chlorine lead to the formation of biodegradable compounds.11
Water utilities have to comply with increasingly stringent regulations on disinfection by-products and water quality. The US Environmental Protection Agency (US EPA) promulgated new rules aimed at reducing the levels of DBPs in drinking water.12 The rule also includes monitoring the levels of NOM during treatment and in the finished water by measurement of TOC.12,13 Reducing the level of organic matter during treatment may be an effective approach to improving water aesthetic, and controlling bacterial water quality without the use of excessive levels of disinfectants or the formation of disinfectant by-products. An effective NOM control program relies upon a good understanding of the origin, occurrence and fluctuation of the organic matter in source water. Some studies described seasonal changes in organic matter level, using a wide increment of time between sampling campaigns (weekly or monthly monitoring).2,11,14,15 However, no studies have reported a daily monitoring of organic matter concentrations in source and treated waters using an on-line TOC analyzer. This study was designed to monitor DOC concentrations of the river, settled, filtered and plant effluent waters, and evaluate NOM removal during water treatment. Specific objectives of the study were the following: (i) to field test a low maintenance TOC analyzer, (ii) to examine fluctuations of organic matter levels over time and determine parameters affecting DOC concentrations in water, and (iii) to assess organic matter removal during water treatment.
Material and methods
Source water
The White River in Muncie (Indiana) has a drainage area of 241 square miles (625 km2). The bulk of the land in the drainage basin is in active agricultural use. A few communities are located along the White River upstream from the treatment facility. The average annual river flow is 130 MGD (5.7 m3 s−1). Flow in the river can be augmented by releasing water from a 7.1 billion gallon reservoir located six miles upstream from the treatment plant. Average annual precipitation is approximately 35 inches (890 mm).Study site
Plant IN610 (Indiana-American Water Company) is a conventional treatment facility that involves pretreatment, coagulation, flocculation, sedimentation, filtration and post treatment. Pretreatment chemicals included powdered activated carbon (for micro pollutant removal during spring and summer) and chlorine. Ferric chloride and a cationic polymer were used for coagulation. The dual media filtration process consisted of 24 inches of GAC (61 cm) and 6–8 inches (15–20 cm) of sand. The GAC was implemented in March of 1997. Then, since spring of 1999, 50% of the GAC has been replaced with reactivated/virgin GAC on a yearly basis. The filtered water was treated with chlorine and ammonia to form chloramines, fluoride and orthophosphate prior to entering the distribution system. Plant production averaged 11 MGD (42,000 m3 per day).TOC Measurement
Organic matter concentrations in the river, settled, filtered and plant effluent waters were measured on a daily basis using a portable TOC analyzer (Sievers Model 800, Ionics-Sievers Instruments, Inc., Boulder, CO). The device uses a combination of UV/persulfate oxidation of organics to form CO2, and a permeation/conductivity detection method. Inorganic carbon (IC) was converted to CO2 after addition of phosphoric acid. IC was then removed by separating the CO2 from the sample through a gas permeable membrane using vacuum. The TOC analyzer included a 60 micron prefilter. Monitoring was conducted from August 28, 1998 to June 13, 2000. The TOC analyzer was used in the grab sample mode at the beginning of the study (August 1998–February 1999). Then, a prototype multi-stream sampler (Sievers, Model 800/810/820 MS, 4 sample streams: river, settled, filtered and finished waters) controlled by the TOC analyzer was used to collect daily values of organic matter levels. The software in the TOC analyzer set the analysis conditions for each stream including sampling order, flushing time, number of analyses per stream, and reagent flow rates. To avoid plugging the instrument lines, water was filtered upstream of the analyzer through a 3 micron stainless steel membrane with an on-line filtering system (Collins Products Co., Model 9700 filtering system, Livingstone, TX). When using the multi-stream sampler, the TOC analyzer operated for approximately 5 hours a day to gather one data set per sample stream. Results were expressed as mg of DOC per liter.Other parameters
Absorbance UV at 254 nm (UV254, in cm−1), true color (Platinum-Cobalt color units) (Hach spectrophotometer, model DR 4000, Hach Company, Loveland CO), turbidity (NTU),16 river level (feet), precipitation (inches) and other operational data were recorded on a daily basis. Specific UV absorbance (SUVA, in L (mg cm)−1) values corresponded to the ratio between UV absorbance at 254 nm and DOC level (SUVA = UV Abs.(cm−1) × 100/DOC(mg L−1)).Data analysis
Data were analyzed using a spreadsheet program (Lotus 123, Lotus Development Corp., Cambridge MA) a graphing program (Harvard Graphics, Software Publishing Corp., Santa Clara, CA), and a statistical analysis program (Statgraphics, STSC, Rockville, MD).Results and discussion
This section presents the equipment performance, and describes variations in river water quality and impacts on treated water. A total of 546 samples were obtained from the White River. Table 1 shows averages and ranges for the different water quality parameters. DOC concentrations in the White River ranged from 2.15 to 11.90 mg L−1, with an average of 4.00 mg L−1. Specific UV absorbance values averaged 2.81 L (mg cm)−1 (range 1.40–10.5). SUVA values were generally low (<3 L (mg cm)−1), indicating a low content of humic substances in the raw water.| Parameter | Average | Range | Coefficient of variation (%) |
|---|---|---|---|
| River DOC/mg L−1 | 4.00 | 2.15–11.90 | 29.7 |
| UV absorbance/cm−1 | 0.118 | 0.037–.830 | 74.4 |
| River Specific UV absorbance/L (mg cm)−1 | 2.81 | 1.40–10.51 | 33.7 |
| True color (color units) | 11.8 | 2–66 | 62.3 |
| River turbidity (NTU) | 15.4 | 1–344 | 176.9 |
| Alkalinity/mg L−1 (as CaCO3) | 256 | 92–370 | 15.6 |
| River pH | 8.0 | 7.4–8.5 | 2.3 |
| Temperature/°C | 13.2 | 2.2–26.7 | 51 |
| River level/feet | 2.44 | 2.08–7.28 | 18.4 |
| Settled water DOC/mg L−1 | 2.55 | 1.56–4.45 | 20 |
| Filtered water DOC/mg L−1 | 2.27 | 1.30–4.17 | 21 |
| Plant effluent DOC/mg L−1 | 2.23 | 1.27–4.11 | 21 |
Analyzer performance
Because of limited laboratory space and personnel, it is critical that the water utilities avail themselves of reliable, compact, easy to use and low maintenance equipment. The operation of analytical equipment such as TOC analyzers can become tedious and time consuming, when frequent maintenance is required. A total of 2,200 DOC values were collected over a 22 month period, representing over 10,100 TOC analyses. No problems occurred during the sampling period, and the Sievers instrument was very reliable. Routine maintenance included changing reagent cartridges (acid and persulfate every 3 months), UV lamp (every 6 months), and prefilter (every 6 weeks). Analyzer calibration was periodically checked throughout the study using a potassium hydrogen phthalate (KHP) solution at 2.5 mg C L−1. Fig. 1 indicates no shift in the instrument calibration over time. Overall, DOC concentrations of 2.5 mg L−1 KHP standard solutions averaged 2.51 mg L−1 (coefficient of variation = 0.03; n = 39), with a maximum deviation of 4%. In addition, water samples were routinely sent to a laboratory and analyzed with a catalyst/high temperature TOC analyzer (Shimadzu TOC analyzer) during the course of the study (Fig. 2). The comparison of the data showed good agreement between the two TOC analyzers (no statistical difference, p < 0.05, n = 82), despite variabilities associated with the type of instrument, oxidation method, and the laboratories performing the testing.13,17,18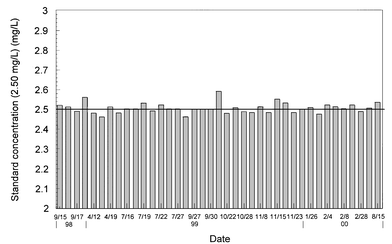 | ||
| Fig. 1 Calibration checks for a 2.5 mg L−1 standard solution. | ||
 | ||
| Fig. 2 Relationship between the Shimadzu 5000 and Sievers 800 data. | ||
Typical changes after precipitation and runoff
Fluctuations in source water quality were related to storm events. The TOC analyzer was operated continuously over a week period to describe closely organic matter changes following a typical rainfall event (June 17–21, 1999). Drastic changes in the river level, turbidity, DOC and UV absorbance were observed within a few hours (Fig. 3). The river level (and stream flow) began to increase 12 hours after the rainfall; at 18 hours it reached its peak, after increasing 1 foot. Within the same interval of time, raw water turbidity, DOC levels, and UV absorbance increased simultaneously from 7 to 135 NTU, 3.1 to 10.1 mg L−1, and 0.08 to 0.45 cm−1, respectively, indicating that soluble organic matter leached from the soil was carried to the river by surface runoff. Then, after the crest, river water level, turbidity and organic matter concentrations decreased progressively to the baseline levels within a week (Fig. 3). A similar pattern was observed through the treatment process. DOC levels also increased in the treated waters after the rainfall. Maximum DOC concentrations for the settled, filtered and plant effluent waters were observed 6 to 8 hours later than for the river because of the water detention time during treatment.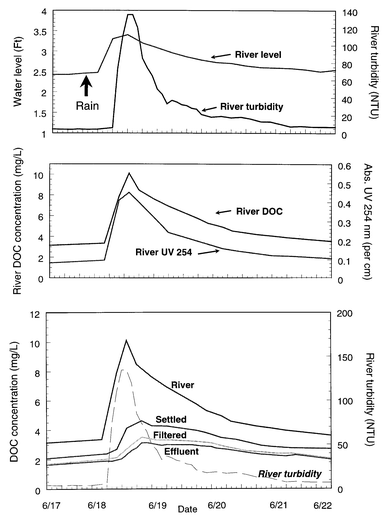 | ||
| Fig. 3 Changes in water quality after a rainfall event. | ||
Fluctuation of source water quality as a function of precipitations
A succession of similar fluctuations was observed over the entire study period (Fig. 4). DOC content in the White River fluctuated in response to precipitation and runoff. The impact of the rainfall and subsequent runoff on the raw water quality fluctuation could be related to the amount of rain, duration of precipitation, and antecedent rainfall (data not shown). Precipitation occurred all year round, however the river water quality was most affected in winter (after snow melt runoff) and spring (storm runoff), when precipitation events lead to increases in the river level accompanied by a series of turbidity spikes (Fig. 4). Heavy runoffs could lead to a 3 fold increase in the river water levels. DOC and turbidity levels could increase by 3.5 and 300 fold, respectively (Fig. 4). Such drastic variations in quality are typical in flowing waters. For example, Soulsby19 found that DOC concentrations varied with storm events in an acidic forested catchment (Wales). Similarly, Tao15 reported synchronous fluctuations in DOC contents estimated from the UV absorbance and river flow rates in the Yichum River (China). For the White River, UV absorbance closely followed the variations of DOC but with a higher magnitude of variation. UV absorbance increased as much as twelve fold during rainfall events, leading consistently to an increase in SUVA values (serving as an indicator of humic content) under high river flow conditions. The presence of humic material was also evidenced by increased true color values, which could be increased up to 8 fold (Fig. 4). These observations indicate a shift in both quantity and composition of the NOM following precipitation, and that runoff leached humic substances from soil. Aiken1 also noticed that DOC levels could double, while the UV absorbance tripled following increases in stream flows. This observation shows limitations in using UV absorbance for predicting DOC concentrations.14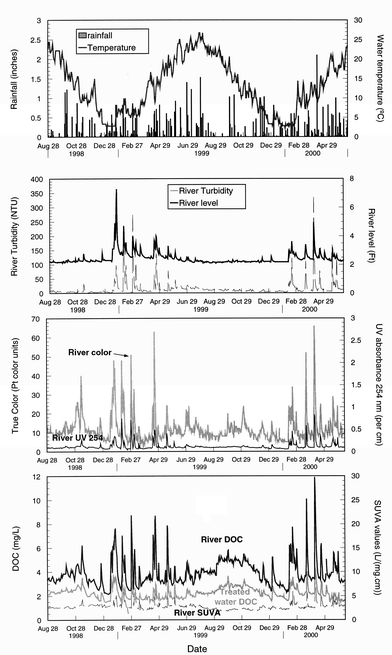 | ||
| Fig. 4 Fluctuations observed as a function of the time. | ||
Over our 22 month monitoring, approximately 32 peaks of high turbidity, DOC levels, color, and UV absorbance were recorded in conjunction with high river levels following rainfall events. River water quality under precipitation conditions was observed 6% of the time, and corresponded to DOC levels > 6 mg L−1, average river levels of 3.7 feet, SUVA values of 5.29 L (mg cm)−1 (high humic content), and turbidity of 92 NTU.
Other factors affecting river water quality
Between individual rainfall events, a baseline river water quality (baseflow conditions in absence of runoff) was observed 87% of the time. These conditions corresponded to DOC levels <5 mg L−1, average SUVA of 2.64, river levels of 2.36 feet, and turbidity lower than 15 NTU. Several parameters impacted the characteristics of organic matter under baseline conditions. The levels of organic matter showed a seasonal trend. Background organic matter levels were the lowest in winter and averaged 2.60 ± 0.22 mg L−1 and 2.72 ± 0.2 mg L−1 in winters of 1998 and 1999, respectively, versus 4.41 ± 0.59 mg L−1 during the warm months from July to October 1999 (significant difference, p ≪ 0.01). These data indicated that the production of internal NOM was reduced in winter (low algae activities), and the transport of organic matter from the sediments to bulk water was minimal under low flow conditions.Operational practices also impacted river water quality. A rapid increase of DOC levels in the water supply coincided with the release of water from the reservoir into the river (September 1999) (Fig. 4). Releasing reservoir water containing high levels of algae into the river might have led to an increase in the river algae levels. DOC concentrations averaged 3.86 mg L−1 prior to discharging reservoir water (July–August 1999) vs. 4.88 mg L−1 after blending river and lake waters (September–October 1999, a significant difference, p < 0.01). Interestingly, the increase in DOC level was not accompanied by an increase in SUVA (no difference in UV value, p = 0.14) , indicating that the organic contribution was related to the production of internal NOM by photosynthesis. Furthermore, the presence of dead tree leaves in the river led to a significant increase (p < 0.01) in water color from 11 color units to 24 in the fall (from October 31 to November 15 1999) (Fig. 4). DOC levels increased from 4.66 mg L−1 to 5.03 mg L−1 during this episode (p = 0.015).
This study reported large temporal variations in the transport of DOC from terrestrial environments to water bodies, and drastic fluctuation in NOM content for a given water source as a function of season and precipitation. It has been reported that the overall resulting NOM content of streams depends on multiple factors, and generally on vegetative patterns, soil characteristics and hydrology in the watershed.20 Following precipitation events, external carbon imported into the water stream represents the dominant component of DOC, as opposed to biological activity within the water body. In the absence of runoff, photosynthetic activity leads to production of internal NOM, especially in warm shallow waters in the presence of nutrients.2 NOM characteristics have also been related to various factors including flood, drought, winter freeze, snow melt and algal bloom.11,21 In addition, other parameters that are difficult to identify such as wastewater discharges, and animal waste may also contribute to changes in organic matter characteristics.
Fluctuations in treated water quality
Changes in river water quality were reflected in the treated water (Fig. 4). Plant effluent DOC concentrations increased with increasing organic matter in the White River. From a drinking water quality standpoint, these organic spikes could represent potential risks of taste and odor problems in the distribution system. They may also lead to higher disinfection by-product and nutrient levels entering the system. In general, the treatment plant responded well to spikes in DOC concentrations in the river. Baseline river DOC levels showed an average increase of 138% during turbidity spikes, compared to an average increase of only 67% in the treated water (significant difference, p < 0.01).Following conventional treatment, removal of DOC averaged 41.9% and ranged between 16.9 and 72.9%. Most of the decrease occurred during settling (Table 1). On average, DOC removal was 34.7% (range: 7.1–66%) after coagulation/flocculation and sedimentation using ferric chloride and a cationic polymer (pH of coagulation: 7.0–7.4). It has been reported that the elimination of organic matter after coagulation could be impacted by many factors such as the characteristics of the organic matter, the nature and concentration of inorganic compounds, the design and operation of sedimentation basins and the coagulation conditions (pH, coagulant type and dose, temperature).10,22,23 Consequently, the removal of organic matter by coagulation varies widely. Additionally, in our study settled water DOC concentrations were reduced by 11.1% after filtration (range: 0–43.3%) (Table 1). The elimination of organic material through GAC filtration was related to operational practices, and could be attributed to the combination of adsorption and biodegradation (data not shown). Adsorption occurred mainly after annual replacement of 50% of the GAC in the Spring (April, 1999 and 2000). Since chlorination levels on top of the filters were <0.2 mg L−1, biomass could accumulate on filter media in the form of a biofilm, leading to the assimilation of biodegradable materials contained in the water. From the point of decreasing the amount of organic matter, these two processes of adsorption and biological filtration differ. Biological filtration eliminates specifically biodegradable compounds, while adsorption retains biodegradable and non biodegradable molecules.11
Conclusions
This study demonstrated that the Sievers TOC analyzer was a reliable and low maintenance instrument. TOC instruments are useful tools that can be used at water utilities to evaluate source water TOC levels and plant performance. Organic matter levels in the river and after treatment were closely related to rainfall/runoff events, seasons and operational practices. Water utilities should direct their efforts at reducing the levels of organics during drinking water treatment. Reduction in organic carbon levels will result in long term improvements of water quality (lower DBP levels, better stability of disinfectants, no taste and odor customer complaints, and no bacterial regrowth in the distribution systems).Acknowledgements
The authors wish to thank the production and maintenance department personnel and Mark LeChevallier for their assistance. This project was funded by the Indiana-American Water Company, Inc. (Greenwood, IN) and Ionics–Sievers Instruments, Inc. (Boulder, CO).References
- G. Aiken, in Proceedings of the Workshop on NOM in Drinking Water, Chamonix, France, Sep. 19–22, 1993, 37 Search PubMed.
- B. H. Kornegay, K. J. Kornegay and E. Torres, Natural Organic Matter in Drinking Water: Recommendations to Water Utilities, AWWA Research Foundation, Denver, CO, 2000 Search PubMed.
- J. C. Block and L. Mathieu, Analusis Magazine, 1991, 19(7), 54 Search PubMed.
- G. L. Amy, in Proceedings of the Workshop on NOM in Drinking Water, Chamonix, France, Sep. 19–22, 1993, 19 Search PubMed.
- J. Mallevialle, in Proceedings of the Workshop on Natural Organic Matter, Poitiers, France, Sep. 18–19, 1996, I-1 Search PubMed.
- C. J. Volk, in Methods in Enzymology, Microbial growth in biofilms. ed. R. J. Doyle, Academic Press, New York, NY. 2001, 337, 144 Search PubMed.
- E. M. Thurman and R. L. Malcolm, Environ. Sci. Technol., 1981, 45, 463.
- C. J. Volk, C. B. Volk and L. A. Kaplan, Limnol. Oceanogr., 1997, 42, 39 Search PubMed.
- J. F. Croue, G. V. Korshin and M. Benjamin, Characterization of Natural Organic Matter in Drinking Water. AWWA Research Foundation, Denver, CO, 2000 Search PubMed.
- J. K Edzwald, in Proc. Am. Water Works Assoc. Water Quality and Technology Conference, San Francisco, CA, Nov. 6–10, 1994, 1775 Search PubMed.
- J. C. Joret and M. Prevost, Biodegradable Organic Matter in Waters, personal communication Search PubMed.
- US EPA, Fed. Regist., 1998, 63(241), 69390 Search PubMed.
- E. T. Urbansky, J. Environ. Monit., 2001, 3, 102 RSC.
- J. K Edzwald, W. C. Becker and K. L Wattier, J. Am. Water Works Assoc., 1985, 77(4), 122 Search PubMed.
- S. Tao, Water Res., 1998, 32, 2205 CrossRef CAS.
- APHA, AWWA, WEF, Standard Methods for the Examination of Water and Waste Water,. American Public Health Association, Washington DC, 20th edn., 1998 Search PubMed.
- I. Najm, in Proc. Am. Water Works Assoc. Water Quality and Technology Conference, New Orleans, LA, Nov. 12–15, 1995, 71 Search PubMed.
- L. A. Kaplan, J. Am. Water Works Assoc., 2000, 92(4), 149 Search PubMed.
- C. Soulsby, J. Hydrol., 1995, 170, 159 CrossRef CAS.
- G. Aiken and E. Cotsaris, J. Am. Water Works Assoc., 1995, 87(1), 36 Search PubMed.
- P. M. Huck, P. M Fedorack and W. B. Anderson, J. Am. Water Works Assoc., 1991, 83, 69 Search PubMed.
- S. J. Randtke, in Proceedings of the Workshop on NOM in Drinking Water, Chamonix, France, Sep. 19–22, 1993, 155 Search PubMed.
- J. G. Jacangelo, J. DeMarco, D. M. Owen and S. J. Randtke, J. Am. Water Works Assoc., 1995, 87, 64 Search PubMed.
| This journal is © The Royal Society of Chemistry 2002 |