Quantitative determination of acetylsalicylic acid and acetaminophen in tablets by FT-Raman spectroscopy†
Roman
Szostak
and
Sylwester
Mazurek
Faculty of Chemistry, University of Wrocław, 14 F. Joliot-Curie, 50-383, Wrocław, Poland. E-mail: rsz@wchuwr.chem.uni.wroc.pl; Fax: +48 71 3282348
First published on 10th December 2001
Abstract
A procedure for quantitative determination of acetylsalicylic acid and acetaminophen in pharmaceuticals by PLS (partial least squares) and PCR (principal component regression) treatment of FT (Fourier transform)-Raman spectroscopic data is proposed. The proposed method was tested on powdered samples. Three chemometric models were built: the first, for samples consisting of an active substance diluted by lactose, starch and talc; the second, in which a simple inorganic salt was applied as an internal standard and additions were not taken into account; and the third, in which a model was constructed for a commercial pharmaceutical, where all constituents of the tablet were known. By utilising selected spectral ranges and by changing the chemometric conditions it is possible to carry out fast and precise analysis of the active component content in medicines on the basis of the simplified chemometric models. The proposed method was tested on five commercial tablets. The results were compared with data obtained by intensity ratio and pharmacopoeial methods. To appraise the quality of the models, the relative standard error of predictions (RSEPs) were calculated for calibration and prediction data sets. These were 0.7–2.0% and 0.8–2.3%, respectively, for the different PLS models. Application of these models to the Raman spectra of commercial tablets containing acetylsalicylic acid gave RSEP values of 1.3–2.0% and a mean accuracy of 1.2–1.7% with a standard deviation of 0.6–1.2%.
Introduction
Acetylsalicylic acid (ASA) and acetaminophen (AAP), or paracetamol, are active ingredients in a number of pharmaceutical preparations. Nevertheless, the standard methods for their quantitative determination require time-consuming treatment of a sample prior to measurement.1 The most popular methods are based on UV–VIS and IR (infrared) spectroscopy, sometimes in conjunction with other techniques, e.g., the stopped flow injection method and HPLC (high-performance liquid chromatography). Often volumetric analysis is applied. These methods enable the determination of the ASA and/or AAP content in the preparations, both separately and when mixed with other active constituents.1–6 The application of Raman spectrometry is far less common, but owing to its noticeable progress in the last few decades, the Raman technique could be due for more general adoption for the qualitative and quantitative analysis of the active ingredients in commercial drugs.7The intensity of a Raman line is directly proportional to the concentration of the scattering components of a sample in a laser beam, according to eqn. (1):
| I = αC, | (1) |
FT (Fourier transform)-IR and FT-Raman quantitative analysis of mixtures of well-defined systems with the application of chemometric methods is a common procedure.14–16 The calibration, validation and measured samples consist of the same known ingredients, with concentrations varying over known ranges. One problem that arises, however, is that often it is difficult to find all the constituents of the sample. How then, can we analyse such a system in a reliable way?
Let us assume that the analysed sample consists of a few active ingredients, which give strong Raman signals, and a few other substances, which are weak scatterers. It is possible to not consider at least some of these last compounds during the analysis, by adding an internal standard and choosing adequate ranges in the spectrum. A lot of pharmaceuticals consist of a few active ingredients and a number of additives, which comprise only a small percentage of the tablet weight. A full knowledge of the pharmaceutical formulation enables the construction of a well-defined analytical model. But pharmaceutical companies use differing proportions of preservatives, stabilising and suspending agents in one kind of particular formulation.
In this work we report the FT-Raman quantitative analysis of some ASA and AAP tablets focussing on restricted calibration sets, consisting of the main ingredients of the tablets only. As the results presented show, it seems appropriate to apply chemometric methods to this kind of analysis. The results obtained using the PLS (partial least squares) and PCR (principal component regression) methods are compared with those obtained in the classical way from the band intensity ratio and pharmacopoeial methods.
Experimental
A Nicolet Magna 860 FT-IR spectrometer, interfaced with an FT-Raman accessory was used to carry out the measurements. The samples were illuminated by a Nd:YVO4 laser line at 1.064 μm with a power of 0.35 W at the sample, without a converging lens. The interferograms were averaged over 128 scans, then Happ–Genzel apodised and Fourier transformed using a zero filling factor of 2 to give spectra in the 100–3700 cm−1 range at a resolution of 16 cm−1. Under these conditions, it took approximately 90 s to record a spectrum.In order to obtain the calibration curves, samples with suitable weight ratios of compounds were prepared by mixing pure, solid substances in a mortar for a few minutes, to homogenise the powders properly.
Two different procedures were applied during the measurements. In the first, the powders were placed in a glass tube, then five spectra were recorded for each mixture, with the position of the sample tube being changed randomly for each spectrum reading. An average spectrum was taken for analysis. In the second, a pellet was prepared for each mixture in a way similar to that used in IR spectroscopy, then a Raman spectrum was recorded using a rotating sample holder. The samples were rotated at a speed of approximately 200 rpm. This latter procedure improves the repeatability and enables the recording time to be reduced by a factor of five. The commercial tablets were first ground and mixed, then one sample of the mixture was taken for the FT-Raman analysis and another sample was analysed using UV–VIS spectrometry or titration, according to methods described in the British Pharmacopoeia.1
Nicolet TQ Analyst chemometric software was used to construct the classical, PLS and PCR models, and to perform the quantitative determination of the active ingredients in the commercial products.
The spectral data were normalised using the mean centering technique. Additionally, following the procedure applied in the intensity ratio method, prior to analysis the spectra were divided by the intensity of the strong ASA or AAP peak with a maximum above 1600 cm−1. This improves the quality of analysis and will be described in detail elsewhere.17
The quantitative composition of the studied samples was expressed as a mass fraction (mf) or as a weight percent concentration.
In the present work we report the results for five commercial medicines purchased in a local pharmacy. Two of them contain ASA as the only active substance, and in two, AAP is the active component. The last is a compound drug consisting of ASA and AAP in comparable amounts. Their stated composition is presented in Table 1.
| Tablet | Declared dose/g | Mean tablet mass/g | Concentration of active species (%) |
|---|---|---|---|
| ASA I | 0.300 | 0.485 | 61.8 |
| ASA II | 0.300 | 0.365 | 82.3 |
| AAP I | 0.500 | 0.550 | 90.9 |
| AAP II | 0.500 | 0.688 | 72.6 |
| ASA+AAP | ASA: 0.250 | 0.602 | 41.5 |
| AAP: 0.200 | 33.2 |
The substances used, namely ASA, AAP, lactose, potato starch, talc, calcium carbonate and citric acid were of pharmacopoeial purity. Applied reference materials Na2SO4 and KNO3 were of analytical grade.
Results and discussion
To perform an analysis of quantitative predictive ability by the FT-Raman method applied to solid samples, ASA mixtures with lactose, potato starch and talc have been chosen for the study. The last three substances often occur as constituents of a tablet in commercial preparations and they are rather weak Raman scatterers. To construct the PLS model, 17 calibration samples were measured as mentioned above, five mixtures were used for the validation and five other as “unknown” samples. The mass fraction was varied in the 0.34–0.60 range for ASA, 0.07–0.24 for lactose, 0.09–0.22 for starch and 0.08–0.31 for talc. The detailed composition of the samples is presented in Table S1.† The results of the principal component analysis showed that nearly 98% of the spectral variation could be accounted for by the first three principal components. The spectral ranges used in these calibrations are quoted in Table S2a.† The correlation coefficients characterising the calibration curves shown in Fig. 1, and the factor numbers used for each substance are presented in Table S3.† | ||
| Fig. 1 Calibration curves for ASA, lactose, starch and talc in the ASA–lactose–starch–talc system: PLS model. | ||
In the second step, sodium sulfate was added as an internal standard to the mixtures. Their composition is quoted in Table S4.† The FT-Raman spectra were collected once more, and a new PLS model, omitting the presence of lactose, starch and talc was constructed. It was necessary to choose new spectral ranges, which are reported in Table S2b.† The calibration curve for ASA shown in Fig. 2, is characterised by the correlation coefficient R2 = 0.998. This was obtained when three factors were used for the acetylsalicylic acid and sodium sulfate in the standard mixtures. Quantitative analyses of unknown samples gave satisfactory results. In Fig. 3, the relative errors for the calibration and “unknown” samples are presented for both models. These errors are somewhat higher in the case of the simplified model. It should be noticed that the concentration of ASA considerably decreases in the samples with an internal standard added. This means that for commercial tablets, where the amount of the active substance exceeds by 2–5 times the mass of the other present, the quality of prediction could be better.

 | ||
| Fig. 3 Relative errors of ASA content for calibration (open symbols) and testing (filled symbols) samples in: top, ASA–lactose–starch–talc system; bottom, Na2SO4–ASA–lactose–starch–talc system. | ||
The reported results suggest two ways of determining the concentration of an active substance in complex mixtures. The first can be applied when all the constituents of a sample are known. The second is based on a calibration model for samples with an appropriate internal standard added. The latter procedure resembles the classical intensity ratio method of quantitative analysis applied by Raman spectroscopists for decades. It is simple and fast but the spectral region selection is particularly important in this method.
The spectral regions chosen for analysis have to represent the main spectral features of the substances studied, regardless of the origin of the medicine, and should not be distorted by the spectral features of the other ingredients of the tablet, especially those not taken into account in the chemometric model construction. It is usually possible to find analytical regions for each product separately, to get better correlation coefficients for calibration curves and better results for the analysis. Eventually, when all the components of the medicines studied are known, e.g., in a production facility, quantitative analysis could be performed without any standards added.
To check the performance of the simplified model in the quantitative determination of the active substances in commercial drugs, the salts of alkali metals with symmetrical anions, SO42− and NO3−, were used as internal standards. Three systems were studied: ASA–standard, AAP–standard and (ASA+AAP)–standard, their composition is quoted in Tables S5–S7.† In order to attain appropriate calibration sets, 15 calibration and 4 validation samples were prepared for each system.
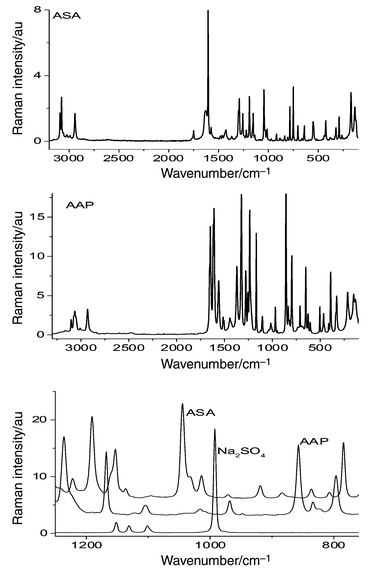
The FT-Raman spectra of pure ASA, AAP and Na2SO4 are shown in Fig. 4. The intense lines of the benzene ring vibrations at 1606 and 1616 cm−1 for ASA and AAP were chosen as the characteristic peaks for the intensity ratio method. The band at 993 cm−1 for sodium sulfate and the one at 1050 cm−1 for potassium nitrate were chosen for the determinations.
The spectral regions and correction points for the ASA–standard, AAP–standard and (ASA+AAP)–standard systems are reported in Tables 2 and S8.† The results for the commercial formulations containing only one active substance with Na2SO4 as an internal standard, are presented in Table 3 and these for the ASA+AAP compound medicine are given in Table 4. These data are in agreement with the declared concentrations and with the results of the control analysis. The values obtained with KNO3 as the standard are comparable, but the deviations are slightly higher.
| Tablet | PLS/mg | PCR/mg | Intensity ratio/mg | Control analysis/mg |
|---|---|---|---|---|
| a Titration.b UV–VIS spectroscopy. | ||||
| ASA I | 302.3 ± 6.5 | 300.9 ± 9.1 | 304.3 ± 7.5 | 302.2 ± 3.6a |
| ASA II | 301.5 ± 5.3 | 297.5 ± 8.3 | 297.3 ± 7.9 | 304.1 ± 3.1a |
| AAP I | 499.5 ± 3.5 | 498.3 ± 4.9 | 499.6 ± 10.2 | 495.8 ± 7.4b |
| AAP II | 501.2 ± 4.7 | 496.8 ± 7.8 | 497.5 ± 9.0 | 499.3 ± 6.0b |
Fig. 5 displays a pure ASA spectrum and one for the pharmaceutical ASA I. There are some spectral regions where the differences are pronounced. First, there are strong peaks at about 1085, 713 and 281 cm−1 in the ASA I spectrum, which are characteristic of calcium carbonate. Secondly, there is a wide, weak peak at 480 cm−1, which originates from starch, and finally a weak band at 942 cm−1, characteristic of citric acid. This means that these three substances were used as tablet diluents and disintegrants. 28 calibration and 5 validation samples were prepared by mixing ASA with the three additives mentioned above. The mass fractions were varied in the 0.33–0.70 range for ASA, 0.05–0.33 for calcium carbonate, 0.03–0.27 for starch and 0.02–0.24 range for citric acid. The composition of these samples is reported in Table S9.†
 | ||
| Fig. 5 FT-Raman spectra of pharmaceutical ASA I (solid line) and pure ASA (dashed line). | ||
Concentration vs. concentration plots for the different constituents of the system studied can help to identify correlated concentrations.14 These plots, presented in Fig. S1,† show a fairly random distribution of experimental points, which means that the correlation is not strong.
The Raman spectra were registered with resolutions of 16 cm−1 and 2 cm−1 for each sample in the form of a pellet, using a rotating sample holder. Next, spectra for the ASA I tablets were recorded applying the same experimental conditions. New PLS and PCR models were built. The spectral ranges chosen for these models, factor numbers and correlation coefficients obtained are reported in Tables S10 and S11.† The concentration of ASA in the ASA I tablets studied, as found from the PLS model based on the lower resolution data, differs from the true value by less then 0.83% with a standard deviation of 1.4%, as shown in Table S12.† This error is only slightly smaller than that one reported in Table 3 for ASA I analysis performed with the help of the simplified PLS model. The ASA concentrations determined in the ASA I tablets using the model constructed for the 2 cm−1 resolution spectra are more precise. In that case the standard deviation is of the order of 0.6%.
To compare the different models applied, the relative standard error of prediction (RSEP) was calculated according to:
 | (2) |
| System analysed | Model | |||
|---|---|---|---|---|
| PLS | PCR | |||
| Cal.a | Pred.b | Cal. | Pred. | |
| a Calibration data set. b Prediction data set. c Resolution 2 cm−1. | ||||
| ASA in ASA–starch–lactose–talc | 1.98 | 2.33 | 2.54 | 3.04 |
| ASA in ASA–starch–lactose–talc–Na2SO4 | 0.99 | 1.19 | 1.56 | 1.75 |
| ASA in ASA–Na2SO4 | 0.73 | 0.84 | 1.04 | 1.45 |
| AAP in AAP–Na2SO4 | 0.76 | 1.27 | 1.31 | 1.56 |
| ASA in (ASA+AAP)–Na2SO4 | 0.81 | 1.44 | 0.94 | 1.61 |
| AAP in (ASA+AAP)–Na2SO4 | 1.07 | 1.41 | 1.12 | 1.22 |
| ASA in ASA–CaCO3–starch–citric acid | 1.23 | 1.52 | 3.16 | 3.21 |
| ASA in ASA–CaCO3–starch–citric acidc | 0.65 | 0.99 | 2.34 | 3.11 |
In Table S13,† the RSEP values obtained in the course of analysis of ASA I are quoted together with the bias and accuracy calculated using eqns. (3) and (4):
 | (3) |
 | (4) |
Conclusions
This study confirms the high potential of FT-Raman spectroscopy when combined with chemometric methods in the quantitative analysis of pharmaceuticals. The proposed procedure gives a level of accuracy and precision comparable with that obtained with the use of UV–VIS spectrometry, but it is significantly simpler. Our study shows that it is possible to determine precisely the amount of particular compounds in complex solid mixtures, even in cases where only the partial composition of a sample is known. The proposed method is fast, especially when a rotating sample holder is used, and does not require any special preparation of the pharmaceuticals being analysed. It could have potential applications in industry, and as an alternative to the present pharmacopoeial methods. However, further work is required to determine the optimal spectrometer and model conditions, particularly for preparations with lower active ingredient concentrations.Appendix
Supplementary information†
The composition of the ASA–lactose–starch–talc samples studied is quoted in Table S1. Table S2 reports the spectral ranges selected during the construction of the PLS model for the ASA–lactose–starch–talc system (part a) and the Na2SO4–ASA–lactose–starch–talc system (part b). In Table S3, the calibration parameters for the ASA–lactose–starch–talc system are presented and the composition of the Na2SO4–ASA–lactose–starch–talc system is presented in Table S4. Tables S5–S7 report the composition of the ASA–Na2SO4, AAP–Na2SO4 and (ASA+AAP)–Na2SO4 samples. Table S8 lists the spectral ranges used for the (ASA+AAP)–standard calibration. Table S9 presents the composition of the ASA–CaCO3–starch–citric acid samples. In Tables S10 and S11, the spectral ranges selected and the calibration parameters of the PLS model for pharmaceutical ASA I are reported, respectively. In Table S12, the results of the FT-Raman analysis of the ASA I tablets are given. Table S13 reports the RSEP, mean bias and mean accuracy values for the determination of ASA in ASA I tablets with the help of the PLS models. In Fig. S1, the concentration vs. concentration plots for the ASA–CaCO3–starch–citric acid samples are presented.References
- British Pharmacopoeia 1999, HM Stationery Office, London, 1999, vol. 1 Search PubMed.
- Z. Bouhsain, S. Garrigues and M. de la Guardia, Analyst, 1996, 121, 635 RSC.
- S. Garrigues, M. Gallignani and M. de la Guardia, Talanta, 1993, 40, 1799 CrossRef CAS.
- Z. Bouhsain, S. Garrigues and M. de la Guardia, Analyst, 1996, 121, 1935 RSC.
- E. Dreassi, G. Ceramelli, P. Corti, M. Massacesi and P. L. Perruccio, Analyst, 1995, 120, 2361 RSC.
- A. Eustaquio, P. Graham, R. D. Jee, A. C. Moffatt and A. D. Trafford, Analyst, 1998, 123, 2303 RSC.
- E. A. Cutmore and P. W. Skett, Spectrochim. Acta, Part A, 1993, 49A, 809 CrossRef.
- H. Barańska, A. Łabudzińska and J. Terpiński, Laser Raman Spectrometry, Analytical Applications, Ellis Horwood, Chichester, 1987 Search PubMed.
- T. Jawhari, P. J. Hendra, H. A. Willis and M. Judkins, Spectrochim. Acta, Part A, 1990, 46A, 161 CrossRef CAS.
- F. T. Walder and M. J. Smith, Spectrochim. Acta, Part A, 1991, 47A, 1201 CrossRef CAS.
- S. F. Parker, Spectrochim. Acta, Part A, 1994, 50A, 1841 CrossRef CAS.
- C. G. Kontoyannis and M. Orkoula, Talanta, 1994, 41, 1981 CrossRef CAS.
- T. H. King, C. K. Mann and T. J. Vickers, J. Pharm. Sci., 1985, 74, 443 CAS.
- M. P. Fuller, G. L. Ritter and C. S. Draper, Appl. Spectrosc., 1988, 42, 217 Search PubMed.
- D. M. Haaland, in Practical Fourier Transform Infrared Spectroscopy, ed. J. R. Ferraro and K. Krishnan, Academic Press, San Diego, CA, 1990, pp. 395–468 Search PubMed.
- J. B. Cooper, Chemom. Intell. Lab. Syst., 1999, 46, 231 CrossRef CAS.
- R. Szostak and S. Mazurek, unpublished results.
Footnote |
| † Electronic Supplementary Information available. See http://www.rsc.org/suppdata/an/b1/b108240j/ |
| This journal is © The Royal Society of Chemistry 2002 |