DOI:
10.1039/B102818A
(Paper)
Lab Chip, 2001,
1, 10-15
The intensification of rapid reactions in multiphase systems using slug flow in capillaries
Received 27th March 2001, Accepted 24th May 2001
First published on 9th August 2001
Abstract
A multiphase microreactor based upon the use of slug flow through a narrow channel has been developed. The internal circulation, which is stimulated within the slugs by their passage along the channel, is responsible for a large enhancement in the interfacial mass transfer and the reaction rate. Mass transfer performance data has been obtained for a glass chip-based reactor in a 380 µm wide channel by monitoring the extraction of acetic acid from kerosene slugs as they moved along the reactor channel. Finally, the data was compared with that provided from other inter-phase contacting techniques.
1. Introduction
Improved methods of manufacturing at the micro scale are opening up new avenues for the development of compact devices for functions ranging from reactions to extraction and separation. Much of the initial work in this field has concentrated on the development of systems using single phase flow with diffusive transfer between parallel reacting fluid streams. Many examples of these systems can be found, such as the gas–gas reactor described by Tonkovich et al.1 and the liquid–liquid system described by Skelton et al.2 The majority of analytical microreactors are single phase devices.Devices in the field of microreactor-based production utilising multiphase flow have begun to emerge over the last few years. A greater focus has been placed on the gas–liquid operations using bubbly or slug flow in arrays of channels. Hessel et al.3 describe one such device utilising this type of flow for gas–liquid contacting. Immiscible liquid–liquid reactions have received less attention. The most common approach to contacting liquid–liquid streams is the use of diffusion between parallel streams of the two phases as described by Harper4 and Harston et al.5 A process for the emulsification of the two phases has also been developed in the form of the “IMM Micromixer” as described by Bayer et al.6
Each method relies purely upon reducing the path length for diffusion to control and maximise the rate of mass transfer, and hence the rate of reaction. Less attention has been paid to the use of slug flow, within narrow reactor channels, as a method of liquid–liquid contacting. Vortex motions generated by the shearing motion within slug flow at larger scales have long been known to enhance mixing within the slugs and improve mass transfer rates across the interface. An example of this at a larger scale was provided by Yonemoto et al.7 using nitrogen slugs to improve mixing within liquid slugs. The application of this method of multiphase contacting for liquid–liquid systems in a microreactor environment forms the basis of the research work presented below.
A further aim of this study was to establish whether microreactors could ultimately have enough production capability to replace conventional batch stirred vessels in the drug and fine chemical industries with outputs up to (say) 500 t yr−1. The work was part of a broader strategy to develop the “Desktop Continuous Fine Chemical Process” for which laboratory scale is the full scale, thereby avoiding the costs and delays associated with process certification. Our initial target is the performance and control of fast reactions which are mass transfer limited and which can give rise to run-away and explosion concerns when performed in stirred vessels. Typical reactions of interest are: (i) nitrations; (ii) hydrogenations; (iii) sulfonation (with oleum); and (iv) oxidation (with nitric acid). The high heat and mass transfer capability offered by capillary microreactors allows high intensity reactions to be precisely controlled for optimum yield and selectivity.
These reactors are intrinsically safer in view of their very small inventory of hazardous material.
A typical capillary flow is expected to be 0.1 µl s−1 to 10 µl s−1 for diameters in the range of 100 µm to 400 µm. Thus, with 10–100 capillaries engraved on a substrate 30 cm square and operating in parallel the output would be about 0.3–3 t yr−1. A matrix comprised of 100 bonded layers of substrate will therefore be capable of an output of 30–300 t yr−1. With this process design philosophy, scale up is achieved by replication rather than by increasing the size of the process units.
2. Slug flow method of liquid–liquid contacting
The experimental work discussed here is based on the use of alternating slugs of two liquid phases to provide the environment for mass transfer and reaction within the microreactor. In the absence of circulation within the slugs, the concentration gradient is axial and the mass transfer occurs across an area corresponding to the channel cross section and over a path length equal to half the length of the slug. However, in practice, as shown in Fig. 1, a circulation is generated within the slugs which is stimulated by the shear between the stationary fluid at the capillary wall and the slug axis. This convects fluid from the slug ends and establishes a concentration gradient in the radial direction. The resulting mass transfer between the wall flow and that along the axis is enhanced because: (i) the path length for diffusion is approximately equal to the tube radius—generally much shorter than the slug half length; (ii) diffusion occurs across an area
which approaches the cylindrical slug area—generally larger than the capillary cross-section area. Thus circulation can provide a powerful boost to the inter-phase mass transfer.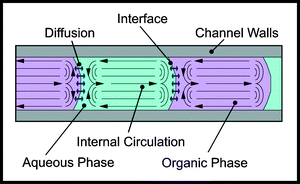 |
| | Fig. 1 Illustration of internal circulation generated within immiscible slug flow. | |
Various methods may be used to generate slugs of liquid within a microreactor. The method discussed in this work uses the continuous flow of both phases through T or cross-shaped intersections. Slugs are generated by the action of one phase flowing into the channel whilst the other phase moves into the intersection, eventually cutting off the flow of the first phase into the channel and reversing the process. Fig. 2 shows the design of a glass device designed for this process containing 380 µm wide and deep channels with a cross-shaped intersection. The channel entering from the right is a “dead end” with no flow and is a result of the method of manufacture discussed in the next section. Fig. 3 shows the typical pattern of slug generation within this device when an organic phase, with a room temperature viscosity of 27 cP, composed of 67% silicone oil (1000 cP) and 33% kerosene (dyed
blue) was used in conjunction with water. The slug lengths produced were around 1.5 mm long with a flow velocity of 5.6 mm s−1. Factors influencing slug length included liquid viscosity, flow velocity, channel geometry and surface properties. Specific details of these effects are not discussed within the scope of this work but may be reported in future publications.
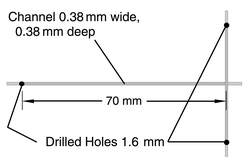 |
| | Fig. 2 Glass chip used for flow visualisation. | |
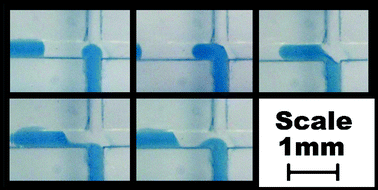 |
| | Fig. 3 Typical slug generation in glass device with 380 µm wide channels. | |
3. Experimental facility
All of the experiments reported here were performed using a soda-lime glass device. Channels were cut into the device using a 380 µm thick slitting saw. The depth of the channels was chosen to match their width, which was approximately 380 µm. Due to the use of a slitting saw in the production of the channel, a cross-shaped intersection was created rather than the usual T shape produced with milled or etched structures used for slug generation. Comparisons of slug generation in T and cross-shaped devices do not indicate any significant differences between the flow patterns when compared with the influence of other factors, such as surface energy and channel size.A lid which had three 1.6 mm holes drilled into it to accommodate feed and exit tubing was attached to the device by diffusion bonding. PTFE capillary tubes with 300 µm bore size (1/16″ or 1.59 mm outer diameter) were glued into the 1.6 mm holes using an epoxy (Araldite™ 2014). A syringe driver loaded with two 1 ml glass syringes was attached to the tubing using a modified luer fitting and was used to control the flow to the device. The flow ratio was therefore fixed at 1∶1 for all experiments.
A simple acid–base reaction was used as the basis of this study because, being extremely rapid, its progress was controlled by the diffusion of the reactants within the slugs. It had the further advantage that conventional pH indicators could be used to follow the reaction progress. These also clarified the photographic distinction between the phases. Phenol Red pH indicator was added to distilled water to create a saturated system, which was filtered and then diluted to by a factor of two with more distilled water. This was then used to produce aqueous solutions of KOH and NaOH in the range from 0.1 to 0.4 mol l−1. Kerosene was used as the basis of the organic phase with Sudan III (red) or Sudan IV (blue) dye added to aid flow visualisation. Acetic acid was then added to the kerosene to produce 0.5 and 0.65 mol l−1 solutions.
The solubility of KOH and NaOH in the organic phase was negligible whereas acetic acid is completely soluble in the aqueous phase. Experiments were performed to examine the partitioning behaviour of acetic acid between kerosene and water. Kerosene loaded with 0.65 mol l−1 of acetic acid had various quantities of water added and was shaken vigorously. Analysis of the kerosene, by gas chromatography, showed a strong partitioning in favour of the aqueous phase with only 3–4% acetic acid remaining in the organic for 1∶1 volume ratios. The reaction was therefore assumed to take place solely in the aqueous phase as acetic acid diffused across the interface.
The reaction mechanisms involved in this work are given in eqns. (1) and (2). These require one mole of acetic acid per mole of KOH or NaOH.
| | | CH3COOH + NaOH → CH3COONa + H2O | (1) |
| | | CH3COOH + KOH → CH3COOK + H2O | (2) |
Photographs were taken of the flow using a 35 mm camera with a reversed 24 mm macro lens and up to 55 mm extension tubes. A flash gun was targeted at a white board mounted 6 cm below the chip to provide back illumination. Colour change was observed within the aqueous slug as acetic acid diffused into the aqueous phase reacting with the KOH or NaOH and changing the pH of the slug.
4. Analysis of titration performance
Analysis of the titration within the microreactor was performed through measurements of the distance along the channel at which the pH indicator in the aqueous phase changed from pink to yellow. Since the pH indicator used changed colour as the local pH passed through 7, this change indicated that at least as many molecules of acetic acid had been transferred into the aqueous slug as molecules of KOH or NaOH present within the slug. An example of this process is shown in Fig. 4. From this data the maximum time requirement for the transfer of a given proportion of acetic acid from the organic slug to the aqueous slug could be established.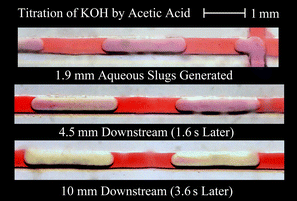 |
| | Fig. 4 Pattern of titration using acetic acid transfer into an aqueous phase containing KOH and phenol red pH indicator. | |
Four series of experiments were performed using this technique with different concentrations of reactants in the organic and aqueous phases. Details of these are provided in Table 1. All experiments were conducted with 1∶1 flow ratio of the two phases and the proportion of acetic acid required to change the indicator colour is given in the last column of Table 1. This was used to calculate the minimum quantity of acetic acid needed to be transferred to achieve a complete change in colour.
Table 1 Experimental concentrations in organic and aqueous phases
| Experiment | Aqueous phase/mol l−1 | Organic phase/mol l−1 | Mole ratio (α) |
|---|
| KOH (a) | 0.25 (KOH) | 0.50 (CH3COOH) | 0.50 |
| NaOH (a) | 0.25 (NaOH) | 0.65 (CH3COOH) | 0.42 |
| NaOH (b) | 0.40 (NaOH) | 0.65 (CH3COOH) | 0.62 |
| NaOH (c) | 0.10 (NaOH) | 0.65 (CH3COOH) | 0.15 |
4.1 Distance and time requirements for acetic transfer
The average distances required to achieve a complete colour change within the aqueous slug for the four experiments are shown in Fig. 5. For each of the experiments the distance was found to increase as velocity increased, starting at only a few mm for 1 mm s−1 up to 20–50 mm for velocities of a few cm s−1. This trend was not linear however, and indicated that transfer times, and hence mass transfer rates, were influenced by the flow velocity.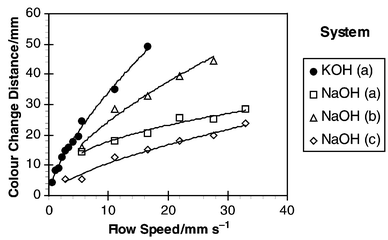 |
| | Fig. 5 Distance along channel at which titration is complete. | |
Fig. 6 shows the calculated colour change times from the data in Fig. 5. The results show that steadily decreasing times were required to transfer the acetic acid as flow velocity was increased. In conjunction with Table 1 it can be seen from Fig. 6 that at least 62% of acetic acid had been transferred in 1.6 s at 28 mm s−1 compared with a time of 3 s at the lower speed of 5 mm s−1. The results also showed a significant difference between transfer times for the KOH system compared with the NaOH based experiments. However, this difference can be explained by the differences in slug lengths produced which affected the mass transfer performance of the two systems. This is discussed in the next section.
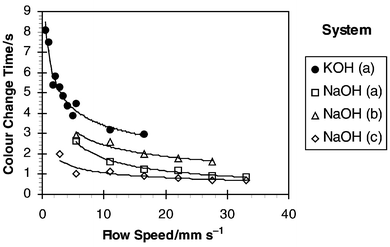 |
| | Fig. 6 Time required for complete titration. | |
4.2 Slug lengths produced
The lengths of the slug produced at the intersection of the two phases was found to be a strong function of the flow rate through the device. Fig. 7 shows the observed slug lengths for the four experiments. The most significant changes in slug length as the flow velocity was increased occurred at velocities below 20 mm s−1. For the KOH system, slug lengths were observed to decrease sharply from 3.8 mm down to 1.5 mm as flow velocity was increased up to 16 mm s−1. However, slug lengths for the three NaOH experiments were generally lower and at 16 mm s−1 were in the range of 1.0–1.2 mm. This may serve to explain the poorer performance of the KOH system shown in Fig. 6, which required 3 s for a 50% consumption of acetic acid [KOH (a)] compared with 2 s for 62% consumption [NaOH (b)] at the same flow velocity. Reasons for the difference in slug lengths may lie in the influence
of chemical composition on surface wetting and contact angles for the different systems. However, this did not appear to affect the general relationship between mass transfer and slug length or mass transfer and velocity.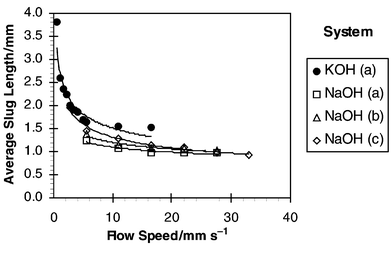 |
| | Fig. 7 Average slug length observed in glass channel. | |
4.3 Mass transfer during slug generation
The relative influence of slug formation (i.e., the “end effect”) was expected to be small for most operating conditions and was not investigated in this study. However, the characteristic time that the slug takes to form, tF, can be represented by the following equation,| |  | (3) |
From Figs. 6 and 7, tF ranged from 0.03 s for the fastest flow to 7 s for the slowest flow. However, for over 67% of the runs this value was below 0.3 s, and for flow velocities above 10 mm s−1, tF accounted for less than 6% of the transfer time. In most cases, therefore, the mass transfer occurring downstream of the slug generation zone was dominant and was under the control of convective internal circulation.4.4 Empirical model for acetic transfer
Linear regression was used to link the transfer times observed in the experiments with the proportion of acetic acid required to neutralise the aqueous phase, the flow velocity and the aqueous slug length. The resulting best fit equation produced for this system was| |  | (4) |
where v0 and L0 are characteristic velocity and length scales for the system which have values of 1 mm s−1 and 1 mm, respectively. The proportion of acetic acid transferred is α and is the value given in the last column of Table 1. The exponent in the relationship between transfer time and α is approximate as α represents the minimum quantity of acid transferred. Although this model is relatively simple with only four empirically derived constants it appears to provide a good fit across the whole
range of data, as shown in Fig. 8. It is therefore useful in highlighting the relative influence of slug length and velocity on the mass transfer between slugs.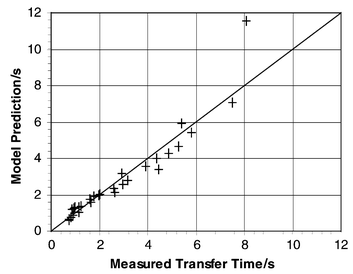 |
| | Fig. 8 Comparison of completed titration times of empirical model with experimental data. | |
4.5 Estimation of mass transfer coefficients
A more formal comparison of the mass transfer performance of the slug flow with other systems may be achieved through an estimation of the mass transfer coefficient. In general terms the transfer rate of acetic acid between the slugs can be written as follows| |  | (5) |
where ΔC is the concentration differential between the organic and aqueous slugs. The interfacial area per unit volume across which the transfer takes place is represented by a, and the mass transfer coefficient for the system by k. For the model reaction, which is the neutralisation of acetic acid, the intrinsic kinetics are extremely fast. Therefore it was assumed that acetic acid was consumed almost instantaneously as it entered the aqueous slug which contained an excess of NaOH or KOH. The concentration differential between the slugs was therefore assumed to be| | | ΔC
= CORG
−
CAQ
≈
CORG | (6) |
Combining the approximation given in eqn. (6) with eqn. (5) yields the following equation for the rate of consumption of acetic acid| |  | (7) |
From eqn. (7) the time required for the proportion α of the acetic to be consumed in the titration should be given by| |  | (8) |
Calculation of the surface area per unit volume available for mass transfer depends upon knowing how much of the slug surface area is actively taking part in mass transfer. Two general cases were considered. The first case assumed that the slugs were surrounded by a layer of the other phase and thus the whole of the slug surface was available
for mass transfer. The alternative case was that the slugs were attached to the channel walls with only the ends of the slugs available for mass transfer.Based on experimental observation of the slug flow there appeared to be no liquid layer surrounding the slugs within the resolution of the photography, which was well below 25 µm. It was therefore concluded that the most suitable model, based on experimental observation, was that only the ends of the slugs take part in mass transfer. Based on this assumption surface area per unit slug volume can be written as
| |  | (9) |
Combining
eqn. (8) and
(9) provided the following equation for the estimation of the mass transfer coefficient
| |  | (10) |
Values of the mass transfer coefficient
k were obtained from the experimental data using
eqn. (10). These are found to be in the range of 0.16 mm s
−1 to
0.56 mm s
−1, with higher values being obtained for the higher flow velocities where internal convection should be greater.
Discussion
A comparison of the mass transfer performance with slug flow and that with simple diffusion between two phases flowing in parallel, was performed by solving the one-dimensional diffusion equation| |  | (11) |
where C is the concentration of the transferring species and D is the diffusion coefficient. Crank9 provides numerical solutions for the case of diffusion into a flat slab, with an initial zero concentration, from one of the slab boundaries with a constant chemical concentration. The solutions provided were found to depend upon the dimensionless Fourier number Fo defined as| |  | (12) |
where t is the time required to reach the concentration profile and d the width of the slab into which the chemical is diffusing. This process of diffusion
was used as a simple model for the mass transfer of acetic acid out of the organic slug and into the aqueous slug. Eqn. (11) was solved numerically assuming an initial acetic acid concentration of C0 at t = 0 diffusing into the aqueous zone of constant zero concentration where the reaction takes place. Fig. 9 shows concentration profiles of this solution for various Fourier numbers defined by eqn. (12).Integration of these profiles was used to calculate the average acetic acid concentration remaining for a given Fourier number. Relating this to the proportion of acetic acid consumed, α in the experiments, allowed comparative Fourier numbers to be established for each condition.
It was found that 15% acetic acid transfer was equivalent to Fo = 0.02 and 62% transfer was equivalent to Fo = 0.30. The diffusivity of acetic acid in water at room temperature is given as 1.24 × 10⁻⁹ m2 s−1.8 Experimental results from the 380 µm wide glass reactor indicate times [eqn. (4)], at the higher flow speeds, of 0.7s for 15% acetic transfer and 2.8 s for 62% acetic transfer. Feeding this information into eqn. (12) implies that the mass transfer between the slugs is equivalent to a diffusive process with a path length d of between 110 µm and 200 µm, which is close to half the channel width of this device and much shorter than the slug length.
This rather crude comparison would imply that not only is mass transfer between slugs enhanced by internal circulation to beyond that expected for diffusion at millimetre slug length scales, but to levels at least as good as that expected from diffusion between two parallel flow streams. Slug flow therefore provides and attractive method of multiphase contacting within a microreactor environment.
6. Conclusions
The mass transfer results from this study indicate that slug flow offers a viable alternative for reacting two phase flow within a micro-channel environment. Circulation within the slugs provides enough enhancement to the mass transfer to make the performance equivalent to diffusion based processes with path lengths less than the channel width. Slug flow should therefore provide reaction performance similar to or better than that provided by diffusion between parallel flow streams. In the same channel slug flow also has the advantage of equal residence times for each phase, which often is not the case for parallel fluid flow. In addition the relatively large volume of the slugs allows quick and easy gravity based separation at the end of the reaction, in contrast to the separation of emulsion systems such as those generated by the “IMM micromixer” (for example ref. 6).An enhancement of the reaction and mass transfer performance is to be expected from eqn. (4), as the slug length in narrower channels is reduced. Work has been reported10 on the use of PTFE capillary tubes in this context as the surface characteristics of PTFE are conducive to the generation of short regular slug lengths. A typical example of 0.6 mm slugs in 150 µm bore tube is shown in Fig. 9 for a kerosene–water system. Development of on-chip devices continues and is directed towards generating slugs at reduced scales with a narrower size distribution and much more rapid mass transfer rates. Results from this development will be reported in future publications.
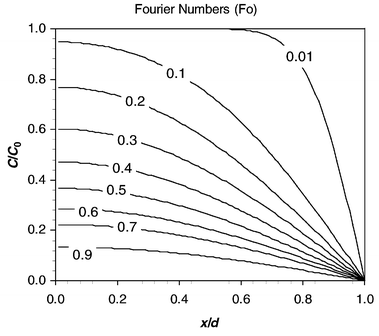 |
| | Fig. 9 Dimensionless solution to diffusion equation for various Fourier numbers. | |
Acknowledgements
This research was supported through the Lab-on-a-Chip consortium made up of UK based academic and industrial members and funded by the Engineering and Physical Science Research Council.Appendix: Notation
| Latin | | |
| a: | Interfacial area per unit volume of system | m−1 |
| C: | Chemical concentration | mol l−1 |
| CAQ: | Chemical concentration within the aqueous phase | mol l−1 |
| C0: | Chemical concentration at phase boundary | mol l−1 |
| CORG: | Chemical concentration within the organic phase | mol l−1 |
| d: | Characteristic diffusion path length | m |
| f: | Frequency of internal vortex motion | s−1 |
| Fo: | Dimensionless Fourier number | — |
| k: | Mass transfer coefficient | m s−1 |
| L: | Length of slug | m |
| L0: | Characteristic length of slug (1 mm) | m |
| t: | Transfer time | s |
| tF: | Characteristic slug formation time | s |
| v: | Average flow velocity | m s−1 |
| v0: | Characteristic slug flow velocity (1 mm s−1) | m s−1 |
| w: | Channel width | m |
| x: | Co-ordinate in one-dimensional diffusion equation | m |
| Greek | | |
| α: | Proportion of acetic acid consumed | — |
References
- A. L. Y. Tonkovich, J. L. Zilka, M. R. Powell and C. J. Call, The Catalytic Partial Oxidation of Methane in a Microreactor, Proceedings of the 2nd International Conference on Microreaction Technology, 1998, pp. 45–53 Search PubMed.
- V. Skelton, G. M. Greenway, S. J. Haswell, P. Styring, D. O. Morgan, B. H. Warrington and S. Wong, Micro Reaction Technology: Synthetic Chemical Optimisation Methodology of Wittig Synthesis Enabling a Semi-Automated Micro Reactor for Combinatorial Screening, Proceedings of the 4th International Conference on Microreaction Technology, 2000, pp. 78–88 Search PubMed.
- V. Hessel, W. Ehrfeld, Th. Herweck, V. Havercamp, H. Lowe, J. Sechiewe and Ch. Wille, Gas/Liquid Microreactors : Hydrodynamics and Mass Transfer, Proceedings of the 4th International
Conference on Microreaction Technology, 2000, pp. 174–186 Search PubMed.
![[*]](https://www.rsc.org/images/entities/char_e103.gif) Significant reference.
Significant reference. - M. J. Harper, Method and Apparatus for Diffusive Transfer Between Immiscible Liquids, International Patent WO 97/39814, 1997 Search PubMed.
- P. Harston, J. R. Burns and C. Ramshaw, Reactions of Aromatic Compounds, International Patent WO 99/22858, 1999 Search PubMed.
- T. BayerH. Heinichen and T. Natelberg, Emulsification of Silicon Oil in Water—Comparison between a Micromixer and a Conventional Stirred Tank, Proceedings of the 4th International Conference on Microreaction Technology, 2000, pp. 167–173 Search PubMed.
- T. Yonemoto, M. Kubo, T. Doi and T. Tadaki, Trans. I. Chem. E., Part A, , 1997, 75, 413 CrossRef CAS .
![[*]](https://www.rsc.org/images/entities/char_e103.gif) Significant reference.
Significant reference. - R. H. Perry and D. Green, Perry’s Chemical Engineers Handbook, McGraw
Hill, ISBN 0-07-066482-X, 6th edn., 1984 Search PubMed.
- J. Crank, The Mathematics of Diffusion, Clarendon Press, Oxford, 2nd edn., 1975 Search PubMed.
![[*]](https://www.rsc.org/images/entities/char_e103.gif) Significant reference.
Significant reference. - J. R. Burns and C. Ramshaw, A Microreactor for the Nitration of Benzene and Toluene, Proceedings of the 4th International Conference on Microreaction Technology, 2000, pp. 133–140 Search PubMed.
![[*]](https://www.rsc.org/images/entities/char_e103.gif)
![[*]](https://www.rsc.org/images/entities/char_e103.gif) Significant reference.
Significant reference.
|
| This journal is © The Royal Society of Chemistry 2001 |
Click here to see how this site uses Cookies. View our privacy policy here. 


![[*]](https://www.rsc.org/images/entities/char_e103.gif) Significant reference.
Significant reference.![[*]](https://www.rsc.org/images/entities/char_e103.gif) Significant reference.
Significant reference.![[*]](https://www.rsc.org/images/entities/char_e103.gif) Significant reference.
Significant reference.![[*]](https://www.rsc.org/images/entities/char_e103.gif)
![[*]](https://www.rsc.org/images/entities/char_e103.gif) Significant reference.
Significant reference.