Determination of rare earth elements in human blood serum by inductively coupled plasma mass spectrometry after chelating resin preconcentration
Kazumi Inagaki and Hiroki Haraguchi*
Department of Applied Chemistry, Graduate School of Engineering, Furo-cho, Chikusa-ku, Nagoya, 464-8603, Japan
First published on UnassignedUnassigned14th February 2000
Abstract
The determination of all rare earth elements (REEs) in human blood serum by inductively coupled plasma mass spectrometry (ICP-MS) was performed with the aid of chelating resin (Chelex 100) preconcentration after acid digestion with HNO3 and HClO4. When chelating resin preconcentration was carried out at room temperature, the recoveries of heavy REEs were lower than those of light REEs because of their stable complex formation with residual organic compounds remaining in the digested serum solution. These problems were overcome by heating the solution at 80 °C during the chelating resin preconcentration process. As a result, the recoveries for all REEs were improved to 92–102% in the case of a concentration factor of 4, where the analytical detection limits for REEs were below 0.2 × 10⁻¹² g ml−1. Consequently, all REEs in individual human blood sera collected from five healthy volunteers could be determined by ICP-MS with good precision. The concentrations of REEs in human blood serum were extremely low, in the range from ca. 1 × 10⁻¹² g ml−1 of Eu to ca. 230 × 10−12 g ml−1 of Ce.
Introduction
For the diagnosis of human health, disease and nutrition, trace and ultra-trace elements in human blood serum have attracted great attention and interest in medical and biological sciences.1–3 Among such trace elements, the biological and physiological functions of the lanthanide or rare earth elements (REEs) are not well known because of the lack of analytical data for biological systems. In our modern society, REEs are widely used in applications such as ceramics, semiconductors, magnets, magnetic resonance imaging (MRI) contrast reagents, fertilizers and so forth.4–6 Hence large amounts of REEs are emitted in to the environment, which may result in substantial exposure to humans. Therefore, studies on REEs in human systems are one of the most interesting research targets. In this context, analytical methods for the determination of REEs in human blood serum should be established to determine their background levels in the human body and to elucidate their physiological roles.Inductively coupled plasma mass spectrometry (ICP-MS) has the capability for rapid multi-element detection over a wide concentration range with very low detection limits.3 Therefore, ICP-MS has been extensively applied to the analyses of biological materials and fluids.7–10 In the determination of ultra-trace elements in biological samples by ICP-MS, however, major constituents such as organic compounds and inorganic salts cause matrix effects, which result in signal suppression or enhancement, clogging of the sampling interface orifices and spectral interference of polyatomic and doubly charged ions.11,12 In addition, the concentrations of REEs in biological samples are extremely low, so efficient preconcentration of REEs and their separation from major constituents are required for their accurate determination.
In a previous paper,13 we reported the determination of all REEs in human blood serum reference material (NIES No. 4 issued by the National Institute for Environmental Studies, Tsukuba, Japan) by ICP-MS, where the reference material was digested only with nitric acid and REEs were preconcentrated by using a chelating resin (Chelex 100) in a batch method. In the experiment, however, the recoveries of REEs with chelating resin preconcentration were poor (67–80%). It has been reported by several workers that incomplete digestion of biological samples strongly influences the recoveries of analytes in chemical separation processes.14–19 Pella et al. employed Chelex 100 separation for the determination of several trace elements in bovine liver reference material (NIST SRM 1577), where the recovery of iron was 77%.14 Yang et al. reported that some organic residues in the digested sample solutions lowered the recoveries of specific elements (Cu, Zn) in solvent extraction with ammonium pyrrolidinedithiocarbamate–chloroform.15,16 Martine and Schitt identified various organic compounds in residues after digestion with HClO4.19 Their work indicated that amino acids derived from proteins in biological samples could not be completely decomposed by acid digestion. From these experimental results, it is considered that the low recoveries of REEs in the Chelex 100 preconcentration might be caused by poor adsorption of the REEs on the resin owing to the competitive complex formation with residual organic compounds in the digested sample solution. We therefore used HClO4 together with HNO3 for digestion to achieve better recoveries of REEs.20 As a result, the recoveries of REEs were improved to 80–90%. However, there was still some influence on the recoveries of REEs due to some residual organic compounds, and it was impossible to determine all REEs in individual blood serum samples.
In this work, the experimental conditions such as pH, the amount of chelating resin and temperature in chelating resin preconcentration were further investigated to minimize the influences of residual organic compounds in order to improve the recoveries of REEs. The analytical method established here was then applied to the determination of REEs in the individual human serum samples collected from five healthy volunteers.
Experimental
Instrumentation
A Model SPQ 8000A ICP-MS instrument (Seiko Instruments, Chiba, Japan), which included a quadruple mass spectrometer, was used for the determination of REEs. Matrix effects and instrumental drift in the ICP-MS measurements were corrected by the internal standard method, where 103Rh (natural abundance 100%) and 187Re (62.6%) were used as the internal standard elements. These elements were chosen as the internal standard elements because they were not detected in blood serum even after preconcentration and they did not cause any polyatomic ion interferences with REEs. The internal standard correction was carried out as described in a previous paper.21,22 The polyatomic interferences of oxide ions with Eu, Gd, Tb, Yb and Lu were corrected by a mathematical correction method based on a procedure similar to that of Vaughan and Horlick.23 An Plasma AtomComp MK II ICP-AES instrument (Jarrell-Ash, Franklin, MA, USA) was also used for the determination of major and some trace elements in blood serum samples, and was operated under the usual conditions. The instrumental components and operating conditions for the ICP-MS instrument are summarized in Table 1. pH measurements were performed with a non-contact type compact pH meter (Model B-211, Horiba, Kyoto, Japan) to avoid contamination from the electrode.| ICP-MS instrument | Model SPQ8000A from Seiko Instruments |
| Plasma conditions— | |
| Rf frequency | 27.12 MHz |
| Incident rf power | 1.0 kW |
| Outer gas | Ar, 16 l min−1 |
| Intermediate gas | Ar, 1.0 l min−1 |
| Carrier gas | Ar, 1.0 l min−1 |
| Sampling conditions— | |
| Sampling depth | 12 mm from work coil |
| Sampling cone | Copper, orifice diameter 1.1 mm |
| Skimmer cone | Copper, orifice diameter 0.35 mm |
| Nebulizer | Glass concentric type (Meinhard TR-30-C2) |
| Sample uptake rate | 0.8 ml min−1 |
| Data acquisition— | |
| Scanning mode | Peak hopping |
| Data points | 3 points per peak |
| Dwell time | 10 ms per point |
| Integration | 100 times |
Chemicals
Multi-element standard solutions for ICP-MS measurement were prepared from the commercially available single-element standard solutions (1000 μg ml −1) for atomic absorption spectrometry (Wako Pure Chemicals, Osaka, Japan). A stock standard solution of Re (1000 μg ml−1) was prepared by dissolving the pure metal (99.99%) (Nakalai Tesque, Kyoto, Japan) in 1 M HNO3. Ammonia, acetic acid and hydrochloric acid were of electronics industry grade and nitric acid and perchloric acid were of Ultrapur grade, all purchased from Kanto Chemicals (Tokyo, Japan). Chelex 100 resin (sodium form, 200–400 mesh) was obtained from Bio-Rad Laboratories (Richmond, CA, USA). The resin was cleaned before use by keeping it in 5 M hydrochloric acid for 5 d (changed daily) and then washed with pure water and 2 M nitric acid in turn. Pure water used throughout was prepared with a Milli-Q water purification system (resistivity 18 MΩ cm) (Nihon Millipore Kogyo, Tokyo, Japan).Human blood serum samples
Human blood samples were collected from five healthy university students with a 30 ml polypropylene syringe equipped with a silicone-coated stainless steel needle. These samples were transferred to silicone-coated glass tubes and centrifuged at 3000 rpm for 20 min. The supernatants were collected as the blood serum samples. Freeze-dried human serum reference material (NIES No. 4) issued by the National Institute for Environmental Studies was also used as a test sample in the preliminary study.Digestion procedure for human blood serum
Blood serum samples were digested as follows. Blood serum (8 ml) was placed in a Teflon beaker (100 ml) and after adding 2 ml of concentrated HNO3 the serum sample was heated almost to dryness on a hot-plate at 110 °C. Then 2 ml of concentrated HNO3 were again added to the residue and the solution was heated at 150 °C for 2 h. After adding a further 2 ml of concentrated HNO3 and 1 ml of 60% HClO4, the solution was heated at 150 °C for 4 h until white fumes appeared. This procedure was repeated twice. Finally, 0.76 ml of concentrated HNO3 and ca. 1 ml of pure water were added to dissolve the residue with heating at 110 °C for 1 h, and the solution was diluted to 100 ml with pure water, then subjected to analysis in the following experiment.The digestion procedure described above was carried out in a clean draft (Yamato Science, Tokyo, Japan), and the evaporation process was performed in an evaporation chamber system (San’ai, Nagoya, Japan), which was composed of PFA sheet, three-piece PTFE drums, an infrared lamp (375 W) and a clean air pump.24 Human blood serum reference material was digested in a similar manner to that described above.
Preconcentration procedure and recovery test
After acid digestion of human blood serum, REEs in the digested sample solution were preconcentrated using Chelex 100 resin. The recommended preconcentration procedure established after optimization was as follows. First, 100 ml of the analysis solution were further diluted to 300 ml with pure water. The pH of the solution was adjusted to 6 by adding acetic acid solution and ammonia solution, and then the chelating resin (0.5 g) was added to the diluted solution. After stirring the solution at 80 °C for 3 h, the resin was collected on a glass filter and rinsed carefully with 10 ml of 1 M ammonium acetate solution and 2 ml of pure water to remove Ca and Mg adsorbed on the resin.25,26 Then, REEs adsorbed on the chelating resin were eluted with 10 ml of 2 M HNO3 solution. This eluted solution was evaporated to dryness in the evaporation chamber and the residue was dissolved in 2 ml of 0.1 M HNO3, which contained the internal standard elements Rh and Re (10 ng ml−1 each). In the preconcentration procedure employed here, the concentration factor for REEs in the final solution was four (by volume), compared with the sample volume (8 ml) of the original human blood serum.In the recovery test experiment, 5 ml of the multi-element standard solution containing all REEs (1 ng ml−1 each) was added to the digested solution of the human blood serum reference material (NIES No. 4) and the preconcentration procedure described above was carried out in the same way. Then, REEs were determined by ICP-MS to obtain their recoveries.
Results and discussion
In previous papers, we reported the determination of REEs in human blood serum reference material13 and real blood serum samples20 by ICP-MS after chelating resin preconcentration. As mentioned earlier, however, the recoveries of REEs in the preconcentration procedure were poor. Therefore, the experimental conditions such as pH, amount of chelating resin and temperature during the preconcentration process were further investigated in detail in order to obtain better recoveries of REEs in the chelating resin preconcentration. In the following experiments, the digested solution of human blood serum reference material (NIES No. 4) was used as the test solution.pH dependence of adsorption efficiencies of REEs in chelating resin preconcentration
Since the adsorption efficiencies of REEs on the chelating resin are generally influenced by the pH of the analysis solution, the pH dependence of the recoveries of REEs in preconcentration was examined in the pH range 3–8. In this experiment, the test solution was prepared by adding 5 ml of 1 ng ml−1 each of all REEs to the digested solution of human blood serum reference material. The preconcentration procedure at the different pHs was then carried out at room temperature and the concentrations of REEs in the preconcentrated test solution were determined by ICP-MS. In Fig. 1, the pH dependence of the recoveries for La, Tb and Yb is shown as typical examples of light, medium and heavy REEs, respectively. In order to show the uncertainties of the recovery values clearly, the error bars, which were estimated as the standard deviations of triplicate experiments, are shown on each recovery curve in Fig. 1. As can be seen, the recoveries were almost constant or increased slightly from pH 3 to 6, then decreased markedly above pH 6. These results were almost consistent with those obtained for the chelating resin preconcentration of REEs in coastal sea-water.26,27 Hence a pH of 6 was adopted as the optimum in the subsequent chelating resin preconcentration. It should be noted that the recoveries of La, Tb and Yb were significantly different from each other, and that of Yb (heavy REE) was the lowest.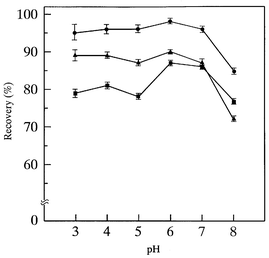 | ||
| Fig. 1 pH dependence of recoveries of REEs in blood serum reference material in chelating resin preconcentration, where 0.5 g of chelating resin was used. ●, La; ▲, Tb; ■, Yb. The test solution was prepared by adding 5 ml of the multi-element standard solution containing all REEs to give 50 pg ml−1 each in the digested solution of blood serum reference material. | ||
Effects of resin amounts and temperature on recoveries of REEs in chelating resin preconcentration
It is well known that the recoveries of REEs depend on the amount of resin used for preconcentration when the samples contain large amounts of salts.26 Therefore, the dependence of the recoveries of REEs on the resin amounts was examined by using the same test solution as described above, where the pH of the analysis solution was adjusted at 6. The experiment was carried out at 20 and 80 °C by adding different amounts of the resin to the test solution. The results obtained for Lu (heavy REE) is shown in Fig. 2. As can be seen, a better recovery of Lu was obtained with an increase in the amount of resin at both temperatures. It is also noticeable that the recovery of Lu was much improved at 80 °C during the stirring process.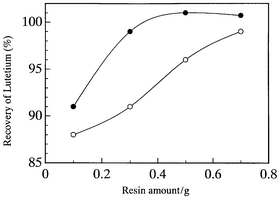 | ||
| Fig. 2 Dependence of recovery of lutetium on the amount of resin at different temperatures in chelating resin preconcentration, where the pH was adjusted at 6. ○, room temperature (ca. 20 °C); ●, 80 °C. Test solution as in Fig. 1. | ||
Since high concentrations of Na, K, Mg and Ca cause matrix effects, their concentrations in the preconcentrated test solution were determined by ICP-AES after chelating resin preconcentration at 80 °C. Both Na and K were removed at concentration levels less than 5 μg ml−1, while the concentrations of Ca and Mg in the final solution were 88.5 and 10.5 μg ml−1, respectively. The concentrations of these elements were more than double those at 20 °C (Ca 33.5, Mg 3.25 μg ml−1). The total amounts of the major elements at 80 °C, however, were low enough to correct matrix effects in the ICP-MS measurements by the internal standard method. Thus, the higher temperature of 80 °C in the chelating resin preconcentration was chosen because of the better recoveries of REEs. It can be seen from Fig. 2 that the recovery of Lu is almost constant above 0.5 g of the chelating resin at 80 °C. As a result, 0.5 g of the chelating resin and 80 °C in the preconcentration procedure were employed as the optimum conditions in subsequent experiments.
Recoveries of REEs in chelating resin preconcentration
The recoveries of REEs obtained by the digestion and preconcentration methods mentioned above are summarized in Fig. 3, together with those in the previous experiments.13,20 As can be seen in Fig. 3, the recoveries of all REEs in the test solution were significantly improved by using both HNO3 and HClO4 in the digestion procedure, compared with those digested only with HNO3. However, the recoveries of heavy REEs were still lower than those of light REEs when the chelating resin preconcentration was carried out at room temperature. These results suggest that some residual organic compounds remaining in the digested solution have a large influences on the adsorption of heavy REEs on the resin through complex formation. Accordingly, the experimental fact that heavy REEs gave the lower recoveries, as is seen in cases (A) and (B) in Fig. 3, may be explained by the competitive complex formation of REEs between the chelating resin and the residual organic species in the digested solution. | ||
| Fig. 3 Variation of recoveries of REEs obtained with different sample pre-treatment procedures. ▲, HNO3 digestion and preconcentration at room temperature;13 ●, HNO3 + HClO4 digestion and preconcentration at room temperature; 20 ◆, HNO3 + HClO4 digestion and preconcentration at 80 °C (this work). Test solution as in Fig. 1. | ||
It can be clearly seen in Fig. 3 that the recoveries of both heavy and medium REEs were markedly improved when the solution was heated during the stirring process in chelating resin preconcentration. These results indicate that the influence of residual organic compounds on the preconcentration of REEs could be substantially eliminated by heating the solution.
The recoveries of REEs obtained by the present method are summarized in the first column of Table 2. It is seen that the recoveries of all REEs were much improved in comparison with those in the previous reports,13,20 and they were in the range 92–102%. Under these conditions, the relative standard deviations of the recovery values estimated from the triplicate experiments were less than 2%, except for Ce (4.4%). These results indicate that the present preconcentration procedure is reproducible enough to be applied to the determination of REEs in human blood serum.
Analytical figures of merit
The analytical detection limits of REEs obtained in the present experiment are summarized in Table 2. In the estimation of the detection limits, first 10 ml of pure water were used as a blank, being subjected to the same digestion and preconcentration procedures as for human blood serum samples to obtain the analytical blank solution. The obtained analytical blank solution was used for the determination of the instrumental detection limits obtained as the concentration corresponding to three times the standard deviation (3ς) of the blank signal intensities, which was estimated from 10 repeated measurements of the analytical blank solution. The analytical detection limits in Table 2 were then calculated by dividing the instrumental detection limits by the preconcentration factor 4, where the recoveries of REEs in the chelating resin preconcentration were not corrected. As can be seen in Table 2, the analytical detection limits of all REEs were at the sub-ppt level.| Analytical | |||||
|---|---|---|---|---|---|
| Recoverya | detection | Blank valueb | |||
| Element | m/z | (%) | limit/pg ml−1 | /pg ml−1 | |
| a All values are expressed as mean ± s (n = 3). The recoveries of REEs were estimated by using a digested solution of human blood serum reference material (NIES No. 4) as the test solution. | |||||
| b All values are expressed as mean ± s (n = 3). | |||||
| La | 139 | 91.3 ± 1.7 | 0.07 | 22 ± 3 | |
| Ce | 140 | 92.7 ± 4.4 | 0.2 | 41 ± 11 | |
| Pr | 141 | 92.0 ± 1.7 | 0.04 | 4.5 ± 1.2 | |
| Nd | 146 | 91.0 ± 1.0 | 0.1 | 12 ± 2 | |
| Sm | 147 | 92.2 ± 1.7 | 0.2 | 2.4 ± 0.6 | |
| Eu | 151 | 92.6 ± 1.6 | 0.05 | 0.54 ± 0.16 | |
| Gd | 157 | 93.0 ± 1.2 | 0.2 | 2.2 ± 0.5 | |
| Tb | 159 | 93.8 ± 0.8 | 0.02 | 0.52 ± 0.10 | |
| Dy | 163 | 92.2 ± 1.3 | 0.1 | 2.1 ± 0.0 | |
| Ho | 165 | 93.1 ± 1.0 | 0.04 | 0.64 ± 0.03 | |
| Er | 166 | 101.9 ± 1.9 | 0.04 | 1.6 ± 0.2 | |
| Tm | 169 | 94.4 ± 1.1 | 0.03 | 0.29 ± 0.1 | |
| Yb | 174 | 93.5 ± 0.4 | 0.07 | 1.8 ± 0.1 | |
| Lu | 175 | 101.4 ± 1.0 | 0.03 | 0.38 ± 0.07 | |
The blank values are given in the last column of Table 2. In the determination of the blank values, 10 ml of pure water were used as the test solution, and acid digestion, chelating resin preconcentration and the ICP-MS measurement procedures were carried out according to the proposed method. As can be seen in Table 2, the blank values were significantly larger than the analytical detection limits. As will be mentioned later, however, these blank values were fortunately lower than the concentrations of REEs in blood serum. The sources of the blank were also examined with the aim of decreasing the blank level in the present experimental procedure, but the blank sources could not be elucidated at the present blank level.
Determination of REEs in human blood serum
In pilot work, the concentrations of REEs in human blood serum reference material (NIES No. 4) were determined by ICP-MS after acid digestion and chelating resin preconcentration as developed in the present experiment. The results are summarized in Table 3, together with those reported in the previous paper.13 The blank values in Table 2 were subtracted from the measured values to obtain the observed values for REEs. As can be seen from the comparison of the results in Tables 2 and 3, the concentrations of all REEs obtained in the present experiment were considerably higher than their analytical detection limits. The analytical values for blood serum reference material were also at least 10 times larger than the blank values, which is shown in Table 2. In the previous work, the analytical values for blood serum reference material were corrected by using the recovery of each element because of the low recovery in the chelating resin preconcentration.13 However, such a correction was not made for the analytical values obtained in the present experiment because the recoveries in preconcentration were 92–102%, being much improved. Even so, the analytical values for REEs obtained here were at almost the same levels as those in the previous experiment. Furthermore, as can be seen in Table 3, the standard deviations of the analytical values (n = 3), especially for light REEs, were significantly smaller than the previous ones. Hence it is considered that the analytical values for human blood serum reference material in the present experiment are more reliable than those in the previous experiment.| Element | Observed valuea/pg ml−1 | Literature value12 | |
|---|---|---|---|
| a All values are expressed as mean ± s (n = 3). | |||
| b Average (n = 2). | |||
| La | 209 ± 1 | 206 ± 20 | |
| Ce | 419 ± 12 | 440 ± 72 | |
| Pr | 45.6 ± 0.7 | 42.3 ± 5.2 | |
| Nd | 169 ± 5 | 171 ± 18 | |
| Sm | 41.1 ± 3.4 | 35.9 ± 2.5 | |
| Eu | 3.52 ± 0.85 | 3.1b | |
| Gd | 41.0 ± 3.7 | 46.5 ± 1.0 | |
| Tb | 5.99 ± 0.42 | 7.3 ± 0.8 | |
| Dy | 40.9 ± 3.8 | 43.2 ± 6.2 | |
| Ho | 8.53 ± 1.11 | 10.2 ± 0.6 | |
| Er | 33.7± 5.0 | 31.2 ± 1.8 | |
| Tm | 5.75 ± 1.03 | 5.1 ± 0.4 | |
| Yb | 38.6 ± 4.2 | 44.7 ± 8.7 | |
| Lu | 6.62 ± 0.90 | 5.6b | |
The analytical results for the individual human blood serum samples collected from five healthy volunteers (four male students and one female student) are presented in Table 4. In the last column, the average values of REEs for five specimens are also shown together with their relative standard deviations (RSDs) in parentheses. It can be seen that REEs in human blood serum from individual persons were extremely low with a wide concentration range from 8.2 × 10⁻¹³ g ml−1 of Eu to 2.14 × 10⁻¹⁰ g ml−1 of Ce on average. It should be noted that RSDs of the analytical values for REEs in five specimens were within 25%, even though their concentrations were extremely low. These results suggest that the concentrations of REEs in the individual human blood serum samples are maintained at an almost constant level under the homeostasis mechanism of the biological system. In addition, all REEs in the real serum samples were at lower concentration levels than those in the human blood serum reference material (NIES No. 4). The higher concentrations of REEs in the reference material might have been caused by the contamination of REEs during its preparation. It can also be seen from the data in Tables 2 and 4 that the concentrations of REEs in blood serum were four or more times higher than the blank values, but the analytical values for some of medium and heavy REEs in blood serum were much lower than those for light REEs. Therefore, such medium and heavy REEs might not be determined if the chelating resin preconcentration is not improved, as mentioned earlier.
| Concentrationa/pg ml−1 | ||||||||
|---|---|---|---|---|---|---|---|---|
| Element | Atomic number | A | B | C | D | E | Average valueb/pg ml−1 | RSD (%) |
| a A–E indicate five individual persons who donated the blood samples for the present experiment. | ||||||||
| b Average values of the data for A–E. | ||||||||
| La | 57 | 73.2 | 58.6 | 66.8 | 56.0 | 59.0 | 62.7 ± 7.1 | 11.4 |
| Ce | 58 | 235 | 187 | 235 | 195 | 216 | 214 ± 22 | 10.4 |
| Pr | 59 | 13.5 | 10.0 | 11.4 | 9.6 | 10.9 | 11.1 ± 1.5 | 13.9 |
| Nd | 60 | 39.8 | 31.6 | 35.4 | 28.4 | 33.5 | 33.7 ± 4.2 | 12.6 |
| Sm | 62 | 7.4 | 4.6 | 6.2 | 5.1 | 5.5 | 5.8 ± 1.1 | 18.8 |
| Eu | 63 | 1.08 | 0.67 | 0.99 | 0.66 | 0.72 | 0.82 ± 0.19 | 23.6 |
| Gd | 64 | 8.6 | 6.0 | 7.0 | 5.8 | 8.7 | 7.2 ± 1.4 | 19.0 |
| Tb | 65 | 1.64 | 1.11 | 1.15 | 1.23 | 1.43 | 1.30 ± 0.22 | 17.2 |
| Dy | 66 | 11.2 | 8.9 | 8.8 | 8.8 | 10.3 | 9.6 ± 1.1 | 11.2 |
| Ho | 67 | 3.44 | 2.20 | 2.15 | 2.34 | 2.83 | 2.55 ± 0.54 | 21.1 |
| Er | 68 | 12.4 | 8.3 | 7.8 | 8.7 | 10.3 | 9.5 ± 1.9 | 19.9 |
| Tm | 69 | 2.34 | 1.35 | 1.45 | 1.67 | 1.86 | 1.69 ± 0.42 | 24.9 |
| Yb | 70 | 17.8 | 11.3 | 10.4 | 11.4 | 15.4 | 13.2 ± 3.2 | 24.1 |
| Lu | 71 | 3.11 | 2.15 | 1.92 | 2.15 | 3.11 | 2.46 ± 0.58 | 23.7 |
According to the Oddo–Harkins rule,28 in general the abundance of an element with an even atomic number is larger than those of neighboring elements with odd atomic numbers. It can be seen in Table 4 that the Oddo–Harkins rule holds in the case of REEs in human blood serum. These facts indicate that some special mass selection does not occur for REEs in blood serum.
Comparison of the distribution patterns of REEs in human blood serum, sea-water and bovine whole blood
The concentration distribution patterns of REEs in human blood serum determined in the present study are shown in Fig. 4, together with the patterns for human blood reference material (Table 3), coastal sea-water,26 open sea-water29 and bovine whole blood,30 where the concentrations of REEs were normalized by those in a Post-Archean Average Australian Shale.31 Such a normalized distribution pattern of REEs is often referred to as the ‘REE pattern’. Although the Leedey chondrite-normalized REE pattern32,33 is mostly used in geological and geochemical studies, the REE abundances of shale, which are considered to represent the REE abundances of the continental crust, are popularly used for the normalization in the marine geochemistry. Hence the REE abundances of the Post-Archean Average Australian Shale31 were employed here for normalization. In Fig. 4, the average values of the REE concentrations for five persons presented in Table 4 were taken as the values for human blood serum. We also tried to determine REEs in human whole blood by a similar method to that proposed here, but the determination of REEs in whole blood has not been successful so far. Therefore, the REE concentrations in bovine whole blood were used in Fig. 4 for comparison, as reported in our previous paper.30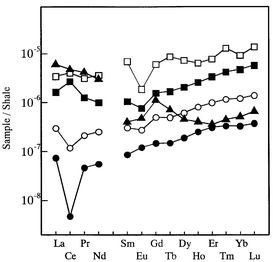 | ||
| Fig. 4 Post-Archean Average Australian Shale-normalized REE patterns for human blood serum, sea-water and bovine whole blood. □, human blood serum reference material (NIES No. 4) (this work); ■, human blood serum (average concentrations in Table 4); ○, coastal sea-water (Nagoya port);26 ●, open sea-water (north Pacific Ocean);29▲, bovine whole blood (IAEA A-13).30 | ||
It should be stressed that the REE pattern of human blood serum and those of coastal and open sea-waters are very similar to each other, although the concentrations of REEs in blood serum are markedly higher than those in coastal and open sea-waters. In contrast, since the concentrations of heavy REEs in bovine whole blood are very low, the REE pattern of bovine whole blood is different from that of human blood serum. It is often suggested that the origin of life on Earth might have occurred in the sea because the compositions of the elements in human blood and sea-water are similar to each other.34 If it were believed, the similarities of the REE patterns for blood serum and sea-water, shown in Fig. 4, might lead to the hypothesis that the homeostasis mechanism for REEs has been maintained in human blood serum since the origin of life in the sea. Further study is, of course, necessary to prove such a hypothesis for the origin of life. Even so, we consider that the concentration distribution patterns of REEs in biological systems might be one of the keys to solving the puzzle of the origin of life.
It is also noted that clear negative anomalies are found for Ce in the case of both coastal and open sea-waters and a small negative anomaly for Eu in the case of coastal sea-water. In contrast, in the case of human blood serum, a small negative anomaly was observed only for Eu, and a small positive anomaly was observed for Ce, as can be seen in Fig. 4. REEs usually exist with a valency of +3. However, Ce and Eu can have two different valencies, +3 and +4 for the former and +2 and +3 for the latter, under different redox conditions. Therefore, Ce and Eu in bio-geochemical samples often provide different distributions from other REEs, which results in the anomalies in the REE pattern. The small positive and negative anomalies for Ce and Eu observed for human blood serum, shown in Fig. 4, suggest that the degrees of the higher (+4) and lower (+2) valencies of Ce and Eu, respectively, with respect to the normal valencies (+3) in blood serum are different from those in sea-water, reflecting the different redox conditions in serum and sea-water.
Conclusion
The concentrations of all REEs in human blood serum were determined on an individual basis by ICP-MS after acid digestion and chelating resin preconcentration. Because of the limited sample amount (volume) of blood serum available for analysis, it was very important to perform efficient preconcentration of REEs to obtain accurate and reliable data. Since the residual organic compounds in the digested solution possibly have a great influence on the recoveries of REEs in chelating resin preconcentration, complete decomposition of the blood serum sample is also desirable for efficient preconcentration of REEs. Further investigations on the concentration distributions of REEs in blood serum and whole blood and also other biological organs are required to elucidate their physiological roles in the biological systems. Such work might help in solving the puzzle of the origin of life in the sea.Acknowledgement
Thet authors express their sincere thanks to the late Professor Shigeo Takeuchi of Nihon University School of Medicine for his help in obtaining the blood serum samples.References
- G. V. Iyengar,
Elemental Analysis of Biological Systems, CRC
Press, Boca Raton, FL,
1989. Search PubMed
.
- J. Versieck and
R. Cornelis,
Trace Elements in Human Plasma or Serum, CRC
Press, Boca Raton, FL,
1989. Search PubMed
- H. Haraguchi, Bull. Chem. Soc. Jpn., 1999, 72, 1163 CrossRef CAS
- L. Liang, P. C. D’Haese, L. V. Lamberts, F. L. Van de Vyver and E. De Bore, Anal. Chem., 1991, 63, 423 CrossRef CAS
- A. V. Gorbunov, M. V. Frontasyeva, S. F. Gundorina, T. L. Onischenko, B. B. Maksjuta and C. S. Pal, Sci. Total Environ., 1992, 122, 337 CrossRef CAS
- E. Diatloff, F. W. Smith and C. J. Asher, J. Plant Nutr., 1995, 18, 1991 Search PubMed
- H. Vanhoe, R. Dams and J. Versieck, J. Anal. At. Spectrom., 1994, 9, 23 RSC
- A. Taylor, S. Branch, H. M. Crews, D. J. Halls and M. White, J. Anal. At. Spectrom., 1997, 12, 119R Search PubMed
- A. Taylor, S. Branch, D. J. Halls, L. M. W. Owen and M. White, J. Anal. At. Spectrom., 1998, 13, 57R RSC
- H. Haraguchi,
E. Fujimori and
K. Inagaki, in
Free Radical and Antioxidant Protocols, ed. D. Armstrong,
Humana Press, Totowa, NJ,
1998, 389-411. Search PubMed
- K. E. Jarvis,
A. L. Gray and
R. S. Houk,
Handbook of Inductively Coupled Plasma Mass Spectrometry,
Chapman and Hall, New York,
1992. Search PubMed
- Inductively Coupled Plasmas Mass Spectrometry, ed. A.
Montaser, Wiley-VCH, New York,
1998. Search PubMed
- E. Fujimori, Y. Tomosue and H. Haraguchi, Tohoku J. Exp. Med., 1996, 178, 63 Search PubMed
- P. A. Pella, H. M. Kingston and J. R. Sleber, Anal. Chem., 1983, 55, 1193 CAS
- J. Y. Yang, M. H. Yang and S. M. Lin, Anal. Chem., 1985, 57, 472 CrossRef CAS
- J. Y. Yang, M. H. Yang and S. M. Lin, Anal. Chem., 1990, 62, 146 CrossRef CAS
- J. W. Jones, G. Capar and T. C. O’Haver, Analyst, 1982, 107, 353 RSC
- J. W. Jones and T. C. O’Haver, Spectrochim. Acta, Part B, 1985, 40, 263 CrossRef
- G. D. Martine and A. A. Schitt, Anal. Chem., 1976, 48, 70 CrossRef
- K. Inagaki and H. Haraguchi, Chem. Lett., 1997, 8, 775 CrossRef
- H. Sawatari, E. Fujimori and H. Haraguchi, Anal. Sci., 1995, 11, 369 Search PubMed
- W. Doherty, Spectrochim. Acta, Part B, 1989, 44, 263 CrossRef
- M. A. Vaughan and G. Horlick, Appl. Spectrosc., 1990, 44, 587 Search PubMed
- H. Isoyama, T. Uchida, K. Oguchi, C. Iida and G. Nakagawa, Anal. Sci., 1990, 6, 385 Search PubMed
- H. M. Kingston, I. L. Barnes, T. J. Brady, T. C. Rains and M. A. Champ, Anal. Chem., 1978, 50, 2064 CrossRef CAS
- H. Sawatari, T. Toda, T. Saizuka, C. Kimata, A. Ito and H. Haraguchi, Bull. Chem. Soc. Jpn., 1995, 68, 3065 CAS
- T. Yabutani, J. Shan, F. Mouri, A. Itoh, H. Sawatari, K. Chiba and H. Haraguchi, Bull. Chem. Soc. Jpn, 1999, 72, 2253 CAS
- P. K. Kuroda,
The Origin of the Chemical Elements and the Oklo Phenomenon,
Springer-Verlag, Berlin,
1982. Search PubMed
- J. Zhang and Y. Nozaki, Geochim. Cosmochim. Acta, 1996, 60, 4631 CrossRef CAS
- E. Fujimori, T. Hayashi, K. Inagaki and H. Haraguchi, Fresenius’ J. Anal. Chem., 1999, 363, 277 CrossRef CAS
- S. M. McLeman, in
Geochemistry and Mineralogy of Rare Earth Elements, ed. B.
R. Lipin and G. A. McKay, Mineralogy Society of America,
Washington, DC, 1989, pp.
169-200. Search PubMed
- C. D. Coryell, J. W. Chase and J. W. Winchester, J. Geophys. Res., 1963, 68, 559 CAS
- A. Masuda and Y. Matsui, Geochim. Cosmochim. Acta, 1966, 30, 239 CrossRef CAS
- A. M. Fiabane and
D. R. William,
The Principles of Bio-inorganic Chemistry,Royal
Society of Chemistry, London,
1981. Search PubMed
| This journal is © The Royal Society of Chemistry 2000 |