Direct spectrophotometric determination of aluminium oxide in Portland cement and cement clinker. An insight into the solution equilibria and analytical aspects of the aluminium–quinizarin system
Kamal A. Idriss*a, Elham Y. Hashema, M. Shafie Abdel-Azizb and Hassan M. Ahmedb
aChemistry Department, Faculty of Science, Assiut University, Assiut, Egypt
bAssiut Cement Company, Assiut, Egypt
First published on UnassignedUnassigned7th January 2000
Abstract
A spectrophotometric study of the complexation reaction between Al3+ and quinizarin (QUIN) was carried out to ascertain the suitability of the complex formed for direct spectrophotometric determination of aluminium. The absorbance at 550 nm, due to the aluminium–QUIN complex, formed at pH 3.8, is recommended for the determination of the alumina content of Portland cement and cement clinker. The proposed method is simple and rapid and possesses reasonable selectivity. Interference of iron(III), generally present in Portland cement, is eliminated by addition of ascorbic acid. The results obtained for several SRM Portland cement samples and for a variety of cement materials demonstrate that the proposed method allows the precise and accurate determination of Al2O3 content over the concentration range 1.4–5.75 μg mL−1 of aluminium. The determination of Al can be carried out successfully in the absence of a masking agent by using first-derivative spectrophotometry. Verification and the use of control charts in the spectrophotometric determination of Al is achieved. The record of the verifier response during routine operation establishes that the method is being maintained in statistical control.
The determination of Al2O3 according to the current ASTM method1 for chemical analysis of hydraulic cements is lengthy and the final results obtained for aluminium oxide are subject to the summation of possible errors involved in the determination of the total oxides and the oxides of iron, phosphorus and titanium.
Over many years, many analysts and ASTM members have expressed the opinion that ‘ASTM Methods for Chemical Analysis of Hydraulic Cement’ (C-114) needs a direct method for determining alumina (Al2O3) rather than determining it by difference as in the present scheme of chemical analysis. This ‘by difference’ approach has generated considerable controversy over the years as to just what was to be subtracted from the ‘ammonium hydroxide group’ (R2O3) to determine ‘Al2O3’ and what was to be used in calculating the ‘Bogue potential compounds’2 both for research and for specification purposes.
The ASTM specification for Portland cement (C-150)3 contains maximum limits for the aluminium oxide and tricalcium aluminate contents for some types of cements. When an accurate Al2O3 value is needed to meet specification requirements or for other purposes, the interference caused by P2O5 and TiO2 must be eliminated. This may be done by either (1) determining these compounds separately and calculating the Al2O3 content by difference or (2) determining the Al2O3 content directly by a procedure that eliminates the interfering components. Possible confusion exists between ‘Specification C-150’ and ‘Test Methods C-114’ of the ASTM Standards for Portland cement with regard to calculation of Bogue potential compounds required in ‘Specification C-150’ for the determination of conformance to specifications. ‘Test Methods C-114’ allow any method of demonstrated precision and bias to be used, and consequently any method may be used which legitimately obtains the Al2O3 value for the purpose of calculating the potential mineralogical composition of the cement clinker.
Numerous spectrophotometric methods for aluminium determination have been published, many of which are not simple and usually have low selectivity. The reagents most frequently used are 8-hydroxyquinoline, aluminon, Eriochrome Cyanine R, Chrome Azurol S and stilbazo.4,5 Also, Hydroxy Naphthol Blue6 and morin7 have been used for the determination of aluminium.
Although various techniques are utilized for the composition analysis of cement, spectrophotometry continues to enjoy wide popularity. The common availability and low cost of instrumentation, the simplicity of procedures and the accuracy of the technique make spectrophotometry advantageous for several investigations.1,8–12 Based on preliminary results on the reactivity of quinizarin toward metal ions13 and previous studies in this laboratory,9 this reagent was chosen for a detailed spectrophotometric equilibrium study in aqueous ethanol, the aim being to develop a rapid method for the direct determination of the Al2O3 content of Portland cement. An insight into the complex-forming equilibria in solution and the analytical characteristics of the Al–quinizarin complex is given. The proposed method shows considerable promise with respect to accuracy, and possesses reasonable selectivity. It saves a lot of time in determining aluminium oxide in Portland cement and could replace the present test methods for alumina determination.
Experimental
Chemicals and solutions
A 10−3 mol L−1 stock standard solution of quinizarin (1,4-dihydroxyanthraquinone) (QUIN) was prepared by dissolving an accurately weighed amount of Aldrich (Gillingham, Dorset, UK) pure grade reagent in absolute ethanol. A 10−2 mol L−1 stock standard solution of aluminium nitrate was prepared using the AnalaR grade product (E. Merck, Darmstadt, Germany). The metal content of the solution was determined by conventional methods.14 Solutions of perchloric acid, sodium perchlorate, sodium acetate and, L-ascorbic acid and standard sodium hydroxide solution were all prepared from analytical-reagent grade reagents. Solutions of diverse ions used for interference studies were prepared from AnalaR nitrate and chloride salts of the metal ions and potassium or sodium salts of the anions to be tested.Cement samples
National Institute of Standards and Technology (NIST; Gaithersburg, MD, USA) Standard Reference Materials (SRMs) 1880, 1881, 1885, 1886 and 1889 were used as the Portland cement matrix in this study. Precautions for handling and use were taken in accordance with the instructions15 on the NIST data sheet and the certificate of analysis of percentage constituents. Other samples of ordinary Portland cement, clinker, clay and raw meal were supplied by Assiut Cement (Assiut, Egypt) and analysed using XRF spectrometry in the Assiut Cement XRF laboratories or F. L. Smidth & Co. A/S (Copenhagen, Denmark).Procedures
Apparatus
A Perkin-Elmer (Norwalk, CT, USA) Lambda 40 double beam spectrophotometer was used for ordinary and first-derivative spectral measurements using 1 cm matched quartz cells. pH values were measured using a Radiometer (Copenhagen, Denmark) M 201 pH meter equipped with a Radiometer combined glass electrode. The pH meter was calibrated regularly before use with standard buffer solutions and the pH values in water–ethanol medium were corrected as described elsewhere.16Results and discussion
Acid–base properties of the reagent
The QUIN reagent yields three coloured acid–base forms in solutions of pH ≡2–11.2: LH2, LH− and L2−. There is a pronounced transformation from the yellow form (LH2) to the orange–red species (LH−) at pH 8.2–9.0. The red form is converted into the violet from (L2−) at pH > 10.8. Distinct isosbestic points are observed for the particular acid–base equilibrium. The protonation scheme of this reagent indicates that gradual association of protons with the oxygen atoms of the bis(hydroxy) substituents occurs at pH ⩽ 10.8 and pH ⩽ 8.2. The absorbance versus pH graphs were interpreted assuming that a particular equilibrium is established under selected conditions. Under our experimental conditions, pKa1 (LH2/LH−) = 8.5 ± 0.04 and pKa2 (LH−/L2−) = 10.65 ± 0.02 (I = 0.1, 25 °C).Complexation equilibria of Al3+ with QUIN
The absorption spectra of the Al–QUIN system were recorded as a function of pH in the presence of an excess of metal ion, in equimolar solutions and in solutions with an excess of reagent. In acidic medium with pH 3.8, the solution spectra have the same shape and exhibit the characteristic double absorption maximum in the wavelength region 510–550 nm corresponding to the formation of the Al3+ complex with QUIN.The absorbance versus pH graphs of the Al–QUIN solution with a concentration excess of aluminium were plotted at different CM/CL ratios. All the graphs, including those obtained for solution with excess of reagent, have the same shape with a single formation branch in the pH range 2.5–4.0. The already tested graphical logarithmic analysis of the absorbance curves for the treatment of spectrophotometric data was employed.17–20
Absorbance versus pH graphs for the solutions investigated were interpreted using the transformations given in Table 1.
| Conditions | Equilibrium/transformation | |
|---|---|---|
| a Symbols used: Z = 1 + [H]/Kai, ΔA = A−AL, differences in the overall absorbances and absorbance of the reagent blank under the same conditions. CL and CM = total concentration of the ligand and metal ion, respectively. | ||
| M + LH2(εL2) ⇌ MLH(ε1) + H+ | (A) | |
| CM > CL | CL/ΔA = 1/ε1 + ΔA[H]/A*K ε1CM | (1) |
| Log [ΔA/(ε1CL−A )] = pH + log CM + log *K | (2) | |
| CL ≈ CM | CM/ΔA = 1/(ε1−AL/CL) +[H] Z/(CL−A/ε1) ε1 *K | (3) |
| Log {ΔA (ε1−AL/CL) Z/[CM(ε1−A L/CL)− | ||
| ΔA/(CL−A/ ε1)]} = pH + log *K | (4) | |
| CL >CM | CM/ΔA = 1/ε1 + [H] Z/*K ε1CL | (5) |
| Log [ΔAZ/(ε1CM−ΔA )] = pH + log CL + log *K | (6) | |
| MLH (ε1) ⇌ ML (ε2) + H+ | (B) | |
| CM > CL | CL/ΔA = 1/ε2 + (ΔA−ε1CL)[H]/ ΔAKKa1ε2 | (7) |
| Log [(ΔA−ε1CL)/( ε2CL−ΔA)] = pH + log KKa1 | (8) | |
| CL > CM | CM/ΔA = 1/ε2 + (ΔA−ε1CM)[H]/ ΔAKKa1ε2 | (9) |
| CM/ΔA = 1/ε1−(ε2CM −ΔA) KKa1/ΔA[H] ε1 | (10) | |
| Log [(ΔA−ε1CM)/( ε2CM−ΔA)] = pH + log KKa1 | (11) | |
| MLbHc(ε1 ) + sLH2 ⇌ MLnHz(ε2) + qH+ | (C) | |
| CL > CM | CM/ΔA = 1/ε1 + (ΔA−ε2CM) CLsK/ΔA [H]qZsε1 | (12) |
| CM/ΔA = 1/ε2 + (ΔA−ε1CM)[H] qZs/ΔAK ε2CLs | (13) | |
| Log [(ΔA−ε1CM)Z s/(ε2CM −ΔA)] = q pH + s log CL + log *K | (14) | |
For the complexation equilibria in solutions with excess of Al3+, the best agreement with the experimental conditions was found for equilibrium (A) involving the molecular form of the reagent LH2 and the formation of an Al–LH2+ complex. This complex was also established in solutions with excess reagent or in equimolar solutions. Equilibrium (B) was tested in solution with an excess of one component using eqns. (7)–(11). Also, the equilibrium representing complex transition (C) in solutions with excess of ligand was tested using transformations (12)–(14). The results obtained indicate no evidence for the existence of the deprotonation equilibrium (B) or the formation of a biligand complex species in accordance with equilibrium (C). The stoichiometry of the Al–QUIN complex was further verified by the method of continuous variations. In solutions having Co = CM + CL = 3.0 × 10⁻⁴ mol L−1 and at pH 3.8, a component ratio of 1:1 (metal to ligand) was obtained at 550 nm.
As far as the complexation equilibria are concerned, the complex formation of QUIN with Al3+ does not compete with the deprotonation equilibrium of the free ligand under the present experimental conditions. According to our results, the only reacting species of the reagent is the molecular form (LH2), which is the prevalent one at the pH employed, and hence any contribution from the anionic form of QUIN in the complexation reaction can be precluded.
The calculated values of the equilibrium constant (log *K11) and stability constant (log *β11) of the complex-forming reaction (A) were found to be –0.54 (+ 0.02) and 8.1 (+ 0.03), respectively.
Analytical characteristics of the method
Under the optimum conditions, a linear calibration graph for the Al–QUIN system was obtained up to a concentration of 6.75 μg mL−1 of Al with a molar absorptivity of 3.15 × 10³ L mol−1 cm−1 at 550 nm. A Ringbom plot showed that the optimum concentration range for the determination of aluminium was 1.5–6.6 μg mL−1. Sandell’s sensitivity of the reaction was found to be 11.7 × 10⁻³ μg cm−2. The reproducibility of the method was checked by analysing a series of five solutions with an Al concentration of 2.7 μg mL−1. The relative standard deviation (RSD) was found to be 0.96%.Effect of diverse ions
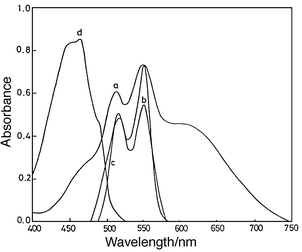
To assess the usefulness of the proposed method, the effects of diverse ions that are often associated with Al3+ were studied. Aluminium was then determined as Al–QUIN under the optimum conditions as described in the given procedure. The tolerance of the method to foreign ions was investigated with solutions containing 0.1 mg of Al per 25 mL and various amounts of foreign ions. The tolerance criterion for a given ion was taken to be the deviation of the absorbance values by more than ±2% from the expected value. The determination of aluminium as the Al–QUIN complex was possible in the presence of Ti4+, V5+, Cr3+, Zn2+, Zr4+, Mo6+, Pd2+, Cd2+, Pb2+, Hg2+, W6+ (about 2.5 mg) and of Cr3+, Co2+, Ni2+, Cu2+ (about 4 mg). The presence of 12 mg of any of the alkali or alkaline- earth metal ions (Mg2+ , Ca2+, Si2+, Ba2+), Cl−, Br−, SO42−, B4O72− and PO43− had no effect on the procedure. The existence of Fe3+ caused a serious interfering effect on the determination of Al. In such a case, the solution spectrum of the Al–QUIN system reveals an absorption band (at 590 nm) overlapped with the characteristic double-maximum absorption of the Al–QUIN complex.The reagent QUIN reacts with Fe3+ in 50% v/v ethanol at pH 2–3.5 to form a blue–violet complex with a characteristic absorption maximum at 590 nm. According to our results, a monoligand Fe–QUIN complex is formed in solution under the present experimental conditions. The solution spectra of the iron(III)–QUIN system in the presence of excess metal ion, in equimolar solutions and in the presence of excess reagent were recorded. The analysis of the absorbance versus pH graphs in the pH range studied indicated the best fit for equilibrium (D):
| Fe3+ + LH2 FeLH2+ + H+(D) | (1) |
 | ||
| Fig. 1 Curves a and b, solution spectra of a cement sample (10 mg per 25 mL) with QUIN (2.5 × 10⁻⁴ mol L−1), pH 3.8, 50% v/v ethanol, in the absence of ascorbic acid (a) and in the presence of 10−3 mol L−1 ascorbic acid (b); curve c, absorption spectrum of Al3+–QUIN complex (CL = CM = 2.5 × 10⁻⁴ mol L−1 , pH 3.8, 50% v/v ethanol); curve d, absorption spectrum of 10−4 mol L−1 QUIN at pH 3.8, 50% v/v ethanol. | ||
First derivative spectrophotometric determination of aluminium
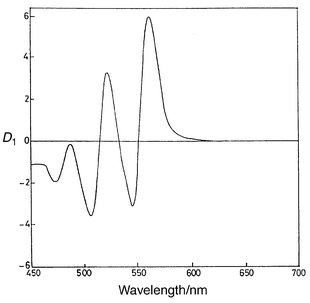
In the wavelength range 540–600 nm, the derivative spectrum of the Fe3+ complex reveals an insignificant amplitude (approaching zero), whereas that of the aluminium complex has a trough at 545 nm and a peak at 560 nm. The presence of Fe3+ has no effect on the first-derivative spectrum of the Al–QUIN complex in the wavelength range 540–600 nm and, accordingly, this range seems to be suitable for the determination of aluminium in the presence of iron(III), using peak-to-trough measurement. The first-derivative spectra of a series of solutions containing the reagent QUIN (2.5 × 10⁻⁴ mol L−1), increasing amounts of Al3+ (1.35–6.75 μg mL−1) and a fixed concentration of Fe3+ (7 μg mL−1) are shown in Fig. 2. The aluminium(III) concentration is found to be proportional to the sum of the amplitudes of the trough (at 545 nm) and the peak (at 560 nm). A linear calibration graph passing through the origin is obtained on plotting the peak-to-trough vertical distance versus aluminium concentration. The calculated regression equation [95% confidence interval (CI), n = 5] is| D1 = 0.977 CAl (±2.4 × 10⁻³) + 0.008 (±1.1 × 10⁻³)(15) | (2) |
![First-derivative spectra of Al–QUIN system at pH 3.8,
CL = 2.5 × 10⁻⁴ mol
L−1, 50% v/v ethanol, [Fe3+] = 1.25 ×
10−4 mol L−1 , [Al3+] = (1) 5
× 10−5 (2) 1.0 × 10⁻⁴ (3) 1.5
× 10−4, (4) 2.0 × 10⁻⁴ and
(5) 2.5 × 10⁻⁴ mol L−1.](/image/article/2000/AN/a906307b/a906307b-f2.gif) | ||
| Fig. 2 First-derivative spectra of Al–QUIN system at pH 3.8, CL = 2.5 × 10⁻⁴ mol L−1, 50% v/v ethanol, [Fe3+] = 1.25 × 10⁻⁴ mol L−1 , [Al3+] = (1) 5 × 10⁻⁵ (2) 1.0 × 10⁻⁴ (3) 1.5 × 10⁻⁴, (4) 2.0 × 10⁻⁴ and (5) 2.5 × 10⁻⁴ mol L−1. | ||
Determination of Al2O3 content of Portland cement and cement materials
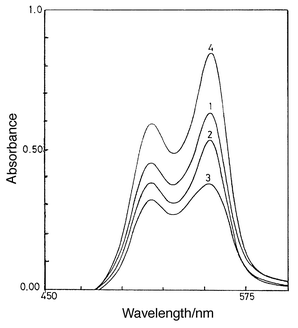
The potential of QUIN as a reagent for the direct spectrophotometric determination of aluminium prompted us to explore the applicability of the method for the determination of alumina in Portland cement and cement clinker. The validity of both the normal and first-derivative methods was thoroughly examined. It was observed that the determination of Al2O3 content of cement can be achieved precisely under the optimum conditions (representative spectra are shown in Fig. 3 and 4). Replicate Al2O3 content analysis of NIST cement samples SRM 1880, 1881, 1885, 1886, and 1889 were performed. In the precision study, five determinations were carried out for each sample. A good precision of the proposed method was obtained, which allows the application of the method to the routine analysis of cement. The analysis of cement materials containing various amounts of Al2O3 is feasible over the concentration range 1.4–5.75 μg mL−1 of Al. | ||
| Fig. 3 First-derivative spectrophotometric determination of Al2O3 content of cement sample (10 mg per 25 mL) with QUIN, CL = 2.5 × 10⁻⁴ mol L−1, pH 3.8, 50% v/v ethanol. Al2O3 found = 4.45%. | ||
 | ||
| Fig. 4 Spectrophotometric determination of Al2O3 content of cement materials with QUIN (CL = 2.5 × 10⁻⁴ mol L−1, pH 3.8, 50% v/v ethanol, 10−3 mol L−1 ascorbic acid). Curves 1–3, 10 mg; and curve 4, 5 mg of sample per 25 mL. 1 = clinker; 2 = cement; 3 = kiln feed; 4 = clay. Al2O3 found: = (1) 5.21; (2) 4.72; (3) 3.22; (4) 14.59%. | ||
The detection limits (at the 95% confidence level) of the proposed methods for the mean of five analyses (N1) were calculated. The minimum detectable amount, Δxmin , is given by21,22
 | (3) |
In real sample analyses, cement, clinker and clay were analysed for Al2O3 content by XRF spectrometry. There was no significant difference between the results obtained by the proposed method and XRF. The method provides the rapid determination of Al2O3 in Portland cement and could replace the present test method for cement analysis.
 | ||
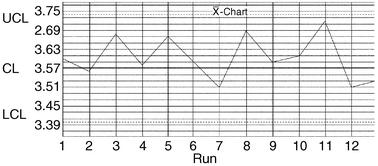
| Fig. 5 Control chart plot for monitoring aluminium in Portland cement. CL = control limit (μg mL−1); U = upper; L = lower. | ||
| Aluminium determinationb | XRF: | ||||
|---|---|---|---|---|---|
| AL2O3 | |||||
| Material | Samplec | xc | sc | 95% CI | (%) |
| a Number of determinations for each sample: n = 5. | |||||
| b x = Mean recovery (% Al2O3); s = standard deviation (%). | |||||
| c Test solutions of the samples investigated contained 4–15 mg of cement material per 25 mL. | |||||
| d OPC = Ordinary Portland cement. | |||||
| e Certified amounts (% Al2O3): SRM 1889, 5.61; 1886, 3.99; 1885, 3.68; 1881, 4.16 and 1880, 5.03. | |||||
| Cement (OPCd) | 1 | 4.90 | 9.79 × 10⁻² | x ± 0.09 | 4.86 |
| 2 | 5.48 | 7.74 × 10⁻² | x ± 0.07 | 5.46 | |
| 3 | 4.86 | 10.10 × 10⁻² | x ± 0.10 | 4.81 | |
| Clinker | 1 | 5.18 | 9.97 × 10⁻² | x ± 0.10 | 5.05 |
| 2 | 5.24 | 9.40 × 10⁻² | x ± 0.09 | 5.18 | |
| 3 | 5.10 | 8.26 × 10⁻² | x ± 0.08 | 5.14 | |
| Clay | 1 | 14.80 | 12.40 × 10⁻² | x ± 0.12 | 14.72 |
| 2 | 14.05 | 10.68 × 10⁻² | x ± 0.10 | 13.92 | |
| 3 | 14.63 | 10.86 × 10⁻² | x ± 0.11 | 14.50 | |
| NIST SRM | |||||
| Cementd | 1889 | 5.55 | 13.84 × 10⁻² | x ± 0.13 | 5.64 |
| 1886 | 4.03 | 11.40 × 10⁻² | x ± 0.11 | 3.96 | |
| 1885 | 3.70 | 7.42 × 10⁻² | x ± 0.07 | 3.64 | |
| 1881 | 4.20 | 6.66 × 10⁻² | x ± 0.06 | 4.16 | |
| 1880 | 5.11 | 9.10 × 10⁻² | x ± 0.09 | 5.05 | |
Validation of the method
Based on running duplicates, a control chart was prepared for monitoring aluminium in Portland cement analysis. The distribution of measurements and range for the determination under investigation indicated that it is in statistical control.References
- Annual Book of ASTM Standard, American Society for Testing and Materials, Philadelphia, PA, 1996, vol. 04.01, ‘Cement, Lime, Gypsum’, C-114. Search PubMed.
- R. H. Bogue, The Chemistry of Portland Cement, Chemical Publishing, New York, 1955, p. 677. Search PubMed.
- Annual Book of ASTM Standard, American Society for Testing and Materials, Philadelphia, PA, 1996, vol. 04.01, ‘Cement, Lime, Gypsum’, C-150. Search PubMed.
- F. D. Snell, Photometric and Fluorometric Methods of Analysis, Part I, Wiley, New York, 1978, p. 585. Search PubMed.
- Z. Marezenko, Spectrophotometric Determination of Elements, Ellis Horwood, Chichester, 1976, p. 110. Search PubMed.
- S. L. Ferreira, N. O. Lette, A. F. Dantas, J. B. Andrade and A. C. Costa, Talanta, 1994, 41(10), 1634.
- M. Ahmed and J. Hossan, Talanta, 1995, 42, 1135 CrossRef CAS.
- H. Sedaira, K. A. Idriss and M. Sh. Abdel-Aziz, Analyst, 1996, 121, 1079 RSC.
- H. Sedaira, K. A. Idriss, M. Seleim and M. Sh. Abdel-Aziz, Monatsh. Chem., 1998, 129, 49 CAS.
- K. A. Idriss, H. Sedaira, M. Sh. Abdel-Aziz and H. M. Ahmed, Talanta, 1999, 50, 913 CrossRef CAS.
- M. G. Vargass, S. Trevilla and M. Milla, Talanta, 1986, 33(3), 209 CrossRef CAS.
- F. Salinas and P. Valiente, Talanta, 1987, 34(3), 321 CrossRef CAS.
- A. V. Diaz, Talanta, 1991, 38(6), 571 CrossRef CAS.
- A. I. Vogel, Text Book of Quantitative Inorganic Analysis, ELBS, London, 4th edn., 1978. Search PubMed.
- Certificate of Analysis, SRM Portland Cement, National Institute of Standards and Technology (NIST), Gaithersburg, MD, 1989..
- G. Douheret, Bull. Soc. Chim. Fr., 1967, 1412 Search PubMed.
- V. Koblizkov, V. Kuban and L. Sommer, Collect. Czech. Chem. Commun., 1978, 43, 2711.
- P. Voznica, J. Havel and L. Sommer, Collect. Czech. Chem. Commun, 1980, 45, 54. Search PubMed.
- K. A. Idriss, M. Seleim, M. Saleh, M. Abu-Bakr and H. Sedaira, Analyst, 1988, 113, 1643 RSC.
- M. Saleh, K. A. Idriss, H. Sedaira and S. Idriss, Monatsh. Chem., 1990, 121, 481 CAS.
- D. A. Skoog, D. M. West and F. J. Moller, Fundamentals of Analytical Chemistry, Saunders, Florida, 6th edn., 1992. Search PubMed.
- Annual Book of ASTM Standards, American Society for Testing and Materials, Philadelphia, PA, 1997, vol. 03.06, ‘Analytical Chemistry for Metals, Ores and Related Materials’, E-876. Search PubMed.
| This journal is © The Royal Society of Chemistry 2000 |
