DOI:
10.1039/C2RA21108D
(Paper)
RSC Adv., 2012,
2, 9914-9920
Application of tomato peel as an efficient adsorbent for water purification—alternative biotechnology?
Received
1st June 2012
, Accepted 19th August 2012
First published on 10th September 2012
Abstract
Heavy metal ions and dissolved organic compounds in waste water are known to adversely affect human health, aquatic life and the overall ecosystem. Many hazardous pollutants need to be removed from drinking water; however, such technologies are not accessible for economically disadvantaged people around the world. Naturally abundant tomato peels or other biomembranes are used as an efficient biomaterial to remove toxic metal ions and organic pollutants from aqueous solution. The functional groups and morphologies of the tomato peels were characterized using FT-IR and FESEM, respectively. Factors such as pH, nature and amount of adsorbent used for extraction were studied to establish the optimum conditions. The maximum adsorption capacity was observed at different pH values for different pollutants. The equilibrium adsorption data were interpreted by using Freundlich and Langmuir isotherms and the adsorption mechanism was investigated by kinetic studies. Results showed that tomato peels have good potential as an efficient adsorbent to remove various pollutants from water.
1. Introduction
Scarcity of clean water is a common problem throughout the world. Dissolved heavy metal salts, organic pollutants and nanomaterials show chronic toxicity for human health.1–3 Many water purification methods have been developed such as chemical coagulation, flocculation, membrane separation, activated sludge formation, trickling filtration, photodegradation and ion exchange to remove such pollutants.4–7 But there is no ideal material or method that can eliminate all pollutants from drinking water. Among water purification techniques, active adsorption has been a promising method of treating effluents, offering advantages over conventional processes. Desirable qualities such as low cost, simplicity of design, availability in large amounts and ability to treat pollutants in a more concentrated form, made the design and synthesis of new adsorption materials of particular interest. Activated carbon was considered to be a suitable adsorbent for most of the pollutants,8–13 but it suffers from limitations such as poor regeneration, low surface area and disposal of used contaminated carbon. Many natural polymers, such as pectin, cellulose, hemicelluloses, protein, chitosan and chitin have functional groups to bind different pollutants. In addition, natural polymers are biodegradable, non-toxic and readily available. Several studies have been reported during recent years to investigate the pollutant binding efficiency of several biosorbents (e.g. fungus, chitosan and silk worm).14–16 Utilization of biowaste (e.g. almond shell, wheat shell, coconut husk and coir pith)17,18 and biomembranes (e.g. orange peel, banana peel, rice husk, lemon peel)19–23 for the extraction of heavy metal ions, pesticides and organic dyes offers an alternative low cost option for water purification for economically poor countries. Often, people living in poor countries depend on the contaminated ground water or local rivers for their daily water needs. Here we show a low cost and highly efficient method of using materials that are easily accessible in rural areas for water purification.
Tomato (Lycopersicon esculentum) is the second most consumed (37 million tonnes/year) vegetable in the world and approximately 30% is consumed as processed products.24 Disposal of the skin and other fibrous materials (90% tomato skin) is an economic waste for many food processing industries. Developing a route to use tomato peel for water treatment solves the problem of waste disposal and serves as an alterative biotechnology for water purification. Tomato peel contains pectin, carotene and phenolic compounds with functional groups such as –NH2, –OH and –COOH.25–27 These functional groups act as potential adsorption sites for various pollutants, especially for cationic pollutants. The present investigation offers complete characterization of a readily available and low cost tomato peel as a strong adsorbent, which can be used for extraction of different types of pollutants from water (Fig. 1). In order to understand the adsorption mechanism, extractions of heavy metal ions (Pb2+, Ni2+, As3+ and Cr6+), dyes (alcian blue (AB), brilliant blue (BB), methylene blue (MB) and neutral red (NB)) and pesticides (phenol, p-chlorophenol, 2,4,6-tricholorophenol and p-nitrophenol) from water were investigated and analysed.
 |
| | Fig. 1 Schematic representation of pollutant extraction using tomato peel. Different dots indicate different classes of pollutants in water. | |
2. Materials and methods
2.1. Materials
Tomatoes were bought from a local supermarket and boiled for 10 min in water. The outer layer was carefully peeled off and cut into small pieces of around 0.4 cm2 in size. The peels were washed with 2-propanol to remove anthocynins, followed by water. The thoroughly washed peels were dried and stored for further characterisation. 2,4,6-Trichlorophenol (TCP), p-chlorophenol (PCP), phenol and p-nitrophenol (PNP) (1.00 g of each) were dissolved separately in 1.00 L Millipore water to make a 1000 ppm stock solution. Alcian blue (AB), coomassie brilliant blue G-250 (BB), neutral red (NR) and methylene blue (MB) were dissolved separately in 50% methanol to prepare stock solutions. Stock solutions of As3+, Cr6+, Pb2+ and Ni2+ were prepared by dissolving stoichiometric amounts of NaAsO2, K2Cr2O7, Pb (NO3)2 and Ni (NO3)2·6H2O in Millipore water, respectively. HCl (0.1 mol L−1) and NaOH (0.1 mol L−1) were used to adjust the pH. All chemicals and reagents used were AR grade and purchased from Sigma Aldrich.
2.2. Characterisation of peels
The surface structure of the peel was captured using Field Emission Scanning Electron Microscopy (JEOL JSM-6701F). Dried tomato peels were coated with platinum metal before SEM analysis to make the surface conductive. Energy dispersive X-ray spectroscopy (EDS) was undertaken in conjunction with SEM to investigate the chemical composition of the tomato peel. The IR spectra were recorded in the range 4000–400 cm−1 using a Bruker ALPHA FT-IR Spectrophotometer with a resolution of 4.0 cm−1. Specimens were first mixed with KBr powder and then ground in an agate mortar. The mixture was pressed at 10 tons for 5 min to form a 100 mg disk using a KBr press model MP-15. Quantitative analysis of heavy metal ions was done using a dual view optima 5300DV ICP-OES system and that of organic pollutants was done using a Shimadzu UV-1601 UV-Vis spectrophotometer.
2.3. Effect of initial adsorbate concentration and time
Tomato peel (0.1 g) was added to solutions (10 mL) of different concentrations of pollutants. All adsorption experiments were carried at 30 °C using an orbital shaker at 200 rpm. The residual concentrations of pollutants were analysed after a predetermined time interval until the system reached equilibrium. The pollutant adsorbed at equilibrium qe (mg g−1) was calculated using the following equationwhere C0 and Ce (mg L−1) are the concentration of the pollutant at the initial stage and under equilibrium conditions, V (L) is the volume of the pollutant solution and M (g) is the mass of adsorbent used. The initial concentrations of the dye solution tested were 5, 10, 20, 40, 70, 100 and 200 mg L−1 and the experiments were carried out at 303 K for 24 h.
2.4. Kinetic and isotherm studies
Samples consisting of a portion (0.1 g) of the adsorbent material (tomato peel) and various initial pollutant concentrations 5–200 mg L−1 were poured into the conical reaction flask. Flasks were agitated using an orbital shaker at 200 rpm at 30 °C. The time required to reach equilibrium was maintained, as determined in equilibrium studies. The equilibrium adsorption isotherms and kinetics for heavy metal ions and dyes were studied using Langmuir and Freundlich models. The adsorption mechanisms of different pollutants on tomato peels were proposed by studying the kinetics of adsorption.
2.5. Effect of solution pH
The effect of solution pH on pollutant removal was studied by varying the pH from 2 to 12, where the pH was adjusted by adding either 0.01 M HCl or 0.01 M NaOH. The initial concentrations used were 100 mg L−1 for TCP, PCP, phenol, AB, Pb2+ and Ni2+ and 20 mg L−1 for PNP, As3+, Cr6+, BB, NR and MB. Other parameters such as adsorbent dosage, agitation speed and solution temperature remained constant. The percentage removal of pollutant was calculated as:| |  | (2) |
where Ci and Cf (mg L−1) are the initial and final concentrations of the pollutants in the water.
2.6. Desorption studies
Samples were prepared by adding tomato peel (0.01 g) to a solution (10 mL) of double distilled water. The solutions were equilibrated for different time periods and stirred constantly. Desorption studies were conducted at different values of pH and samples were analysed at different time intervals. The concentrations of organic pollutants were measured with a UV-Vis spectrophotometer and those of heavy metal ions with ICP-OES. Each experiment was repeated under identical conditions to check reproducibility.
3. Results and discussion
The chemical constituents of tomato peels were well studied.27 The FT-IR spectra of tomato peel in the range 4000–400 cm−1 are shown in Fig. 2. The broad band in the range 3226–3670 cm−1 corresponds to the O–H bond stretch of phenols (usually between 3700 and 3200 cm−1), and the O–H bond vibration of carboxylic acids (3400 and 2400 cm−1). The sharp peak at 2920 cm−1 belongs to the sp3 C–H stretch. The sharp peak at 1760 cm−1 corresponds to the C![[double bond, length as m-dash]](https://www.rsc.org/images/entities/char_e001.gif) O stretch in the carbonyl group of –COOH. The absorptions in the ranges 1600–1585 cm−1 and 1500–1400 cm−1 can be attributed to the stretching of the C
O stretch in the carbonyl group of –COOH. The absorptions in the ranges 1600–1585 cm−1 and 1500–1400 cm−1 can be attributed to the stretching of the C![[double bond, length as m-dash]](https://www.rsc.org/images/entities/char_e001.gif) C bond in the aromatic rings. The peaks due to angular deformation in the plane of the C–H bonds of the aromatic rings (1300–1000 cm−1), axial bending of the C–O bond in phenols (1260–1000 cm−1), and axial bending of the C–O bond in –COOH (1320–1210 cm−1) were visible in the spectrum. IR analysis of the functional groups present in tomato peel matches with the reported literature values.25,26 Upon comparing FT-IR spectra before and after adsorption of the pollutants, significant differences were observed in the positions of the peaks in the spectrum. A noticeable shift in the asymmetric stretch of the –O–H vibration from 3425 cm−1 to 3445 cm−1, and in the asymmetric and symmetric stretches of the C–O bond from 1638 cm−1 to 1650 cm−1 and from 1464 cm−1 to 1458 cm−1, respectively, were observed. The SEM image of tomato peel is shown in Fig. 3, showing a fibrous structure with a fiber thickness in the range 9–25 μm. EDS analysis (Fig. 3b) shows that the major chemical constituents present on the fiber surface are carbon, oxygen and sulphur atoms, which is useful for extracting pollutants from water.14–23
C bond in the aromatic rings. The peaks due to angular deformation in the plane of the C–H bonds of the aromatic rings (1300–1000 cm−1), axial bending of the C–O bond in phenols (1260–1000 cm−1), and axial bending of the C–O bond in –COOH (1320–1210 cm−1) were visible in the spectrum. IR analysis of the functional groups present in tomato peel matches with the reported literature values.25,26 Upon comparing FT-IR spectra before and after adsorption of the pollutants, significant differences were observed in the positions of the peaks in the spectrum. A noticeable shift in the asymmetric stretch of the –O–H vibration from 3425 cm−1 to 3445 cm−1, and in the asymmetric and symmetric stretches of the C–O bond from 1638 cm−1 to 1650 cm−1 and from 1464 cm−1 to 1458 cm−1, respectively, were observed. The SEM image of tomato peel is shown in Fig. 3, showing a fibrous structure with a fiber thickness in the range 9–25 μm. EDS analysis (Fig. 3b) shows that the major chemical constituents present on the fiber surface are carbon, oxygen and sulphur atoms, which is useful for extracting pollutants from water.14–23
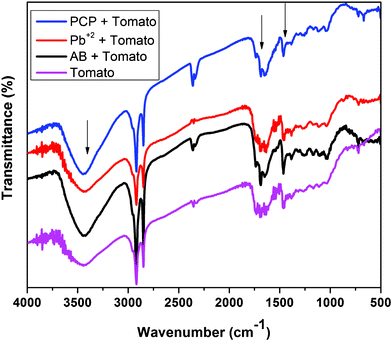 |
| | Fig. 2 FT-IR spectrum of tomato peel before and after adsorption of pollutants. | |
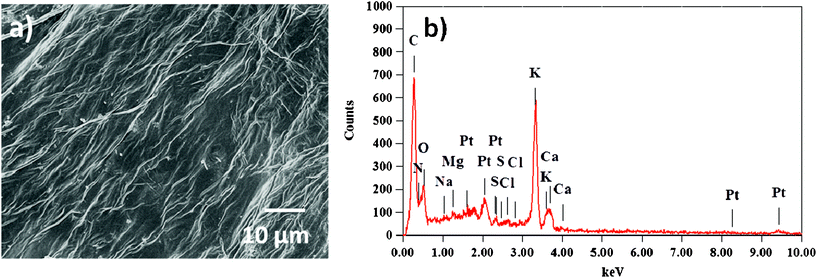 |
| | Fig. 3 FESEM (a) and EDS (b) of the tomato peel surface. | |
3.1. Effects of initial pollutant concentration and contact time
The adsorption uptake versus the adsorption time for different pollutants at 303 K is shown in Fig. 4. The amount of pollutant adsorbed (mg g−1) increased with increasing time and then reached equilibrium. The adsorption of organic pesticides (Fig. 4c) is less than that of heavy metal ions (Fig. 4b) and dyes (Fig. 4a), which may be due to weak interactions (π–π and hydrogen bonding) with the adsorbent,28 but the adsorption efficiencies are comparable with the reported natural peels.29–31 Metal cations and cationic dyes showed higher adsorption values, whereas arsenate and chromate anions and anionic dyes showed lower values. These results indicate that the tomato peel tends to bind cationic pollutants more favourably than anionic pollutants. This may be due to the presence of a higher percentage of acid and alcoholic functional groups on the surface of the tomato peel.
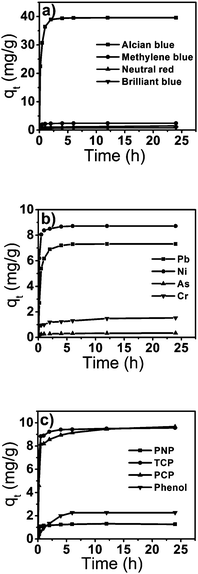 |
| | Fig. 4 The variation in adsorption capacity of dyes (a), heavy metal ions (b) and pesticides (c) with time. | |
3.2. Effect of pH
The removal percentages of different pollutants with varying pH are presented in Fig. 5. The pKa values of PNP, PCP, TCP and phenol are 7.15, 9.41, 6.15 and 9.89, respectively,32 making them strongly pH dependent. At a pH above the pKa, the phenol groups were converted to phenolate ions. This generated repulsion between the negatively charged ions and the tomato surface, reducing adsorption. Similar trends were reported in the adsorption of PCP, PNP and phenol on the chitosan membrane.31 However, the removal of cationic pollutants (Ni2+, Pb2+, AB, NR, and MB) was found to increase as the pH increases. It is assumed that ionic interactions are involved in the adsorption process. For cationic pollutants, the lower adsorption at acidic pH was due to the presence of excess H+ ions competing with the pollutant cations for the adsorption sites. At higher pH, the acidic functional groups on the surface of the peels get ionised, which enhances the adsorption of positively charged cations through electrostatic attraction.20 In the case of anionic pollutants (BB, As3+, Cr6+), the lower pH resulted in a higher adsorption as the positively charged surface of the peels could absorb negatively charged pollutants. Further, the adsorption of arsenic(III) is not a strong function of pH because it exists mostly as neutral H3AsO3, preventing adsorption. Adsorption of chromium(VI) and arsenic(III) was higher at acidic pH, owing to electrostatic attraction between the positively charged peel and the anions.
 |
| | Fig. 5 Effect of pH on the adsorption of dyes (a), metal ions (b) and pesticides (c). | |
3.3. Isotherm studies
3.3.1. Langmuir isotherm.
The Langmuir isotherm, which has been commonly used for sorption processes, can be applied to explain the adsorption of pollutants on tomato peel. The basic assumption of the Langmuir theory is that adsorption takes place at specific sites within the adsorbent.33–35 The data obtained from the adsorption experiment for different pollutants were analysed using the isotherm equation. The saturation monolayer can be expressed by the equation| |  | (3) |
| |  | (4) |
A plot of 1/qeversus 1/Ce results in a linear graphical relation, indicating the applicability of the Langmuir model for different pollutants, as shown in Fig. 6. The Langmuir constants are elucidated from the slope and intercept of the straight lines for different pollutants. The observed linear relationship is statistically significant, as evidenced by the R2 values (close to unity), implying the applicability of the isotherm for our extraction studies. The Langmuir isotherm constants, along with their correction coefficients, are reported in Table 1. The essential characteristic of the Langmuir isotherm can be expressed in terms of a dimensionless equilibrium parameter, such as the separation factor (RL) used in the following equation
| |  | (5) |
where
K is the Langmuir constant and
Ce is the initial concentration of the adsorbate in solution. This parameter indicates that the isotherm will be shaped according to the following adsorption characteristics:
RL > 1 is unfavourable;
RL = 1 corresponds to a linear isotherm; 0 <
RL< 1 is favourable and
RL = 0 is irreversible. It can be seen that the adsorption of pollutants onto tomato peel is favourable (
Table 1).
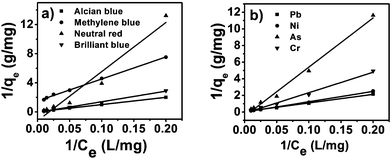 |
| | Fig. 6 Langmuir isotherms for dyes (a) and metal ions (b). | |
Table 1 Langmuir and Freundlich isotherm model constants and correlation coefficients for adsorption of different pollutants on tomato peel
| Pollutant |
Langmuir constants |
Freundlich constants |
|
K (L g−1) |
R
L
|
R
2
|
K
f (mg g−1)(L g−1)n |
1/n |
R
2
|
| Alcian blue |
0.0011 |
0.9947 |
0.999 |
0.1012 |
0.9868 |
0.999 |
| Brilliant blue |
0.0039 |
0.9960 |
0.996 |
0.0651 |
1.0544 |
0.999 |
| Methylene blue |
0.0496 |
0.9527 |
0.998 |
0.0683 |
0.4847 |
0.974 |
| Neutral red |
0.0180 |
0.9822 |
0.957 |
0.0112 |
1.3189 |
0.984 |
| Pb2+ |
0.0081 |
0.9919 |
0.994 |
0.2131 |
0.6632 |
0.920 |
| Ni2+ |
0.0001 |
0.9998 |
0.997 |
0.1101 |
0.8863 |
0.991 |
| As3+ |
0.0025 |
0.9974 |
0.996 |
0.0173 |
1.0776 |
0.990 |
| Cr6+ |
0.0044 |
0.9956 |
0.992 |
0.0442 |
1.0174 |
0.994 |
3.3.2. Freundlich isotherm.
The Freundlich model is an empirical equation based on adsorption onto heterogeneous surfaces. It is assumed that the stronger binding sites are occupied first and that the binding affinity decreases with increasing degree of site occupation.36,37 The isotherm is expressed as:| |  | (6) |
where Kf and n are Freundlich constants related to sorption capacity and sorption intensity of the adsorbent, respectively. Kf can be defined as the adsorption coefficient and represents the quantity of pollutant adsorbed onto the tomato peel for a unit equilibrium concentration. A value of 1/n below one indicates a normal Langmuir isotherm while 1/n above one is indicative of cooperative adsorption. The Freundlich isotherm model (Fig. 7, Table 1) yielded the best fit with the highest R2 value (0.99) for pollutants as compared to the Langmuir model. Table 4 lists the comparison of maximum monolayer adsorption capacities for various pollutants on the tomato peel surface. It can be seen from the table that the Freundlich model was found to fit the data significantly better, indicating the heterogeneous nature of the tomato peel.
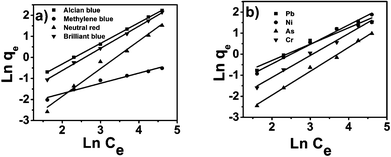 |
| | Fig. 7 Freundlich isotherms for dyes (a) and metal ions (b). | |
3.4. Adsorption kinetics
Kinetic models elucidating the mechanism by which pollutants are adsorbed on adsorbent surfaces have been proposed.38–40 Both Langmuir and Freundlich adsorption kinetic models were used to investigate the adsorption mechanism. A pseudo-first-order eqn (7) was used for data analysis:| |  | (7) |
where qe and qt indicate the amount of pollutant adsorbed (mg g−1) at equilibrium and at time t, respectively. k1(min−1) is the first order rate constant applied in the present studies of pollutant adsorption. The plot of log(qe − qt) versus t for different pollutants (Fig. 8) gave the first order rate constants k1 (slope) and equilibrium concentrations qe (intercept). The values of k1 and qe for different pollutants were calculated from the plots and shown in Table 2. The adsorption kinetics of some systems can also be explained by a pseudo-second-order reaction (Fig. 9). The pseudo-second-order equation based on adsorption equilibrium capacity may be expressed in the form| |  | (8) |
where k2 is the rate constant of the pseudo-second-order adsorption and qe is the equilibrium adsorption capacity (mg g−1). The k2 and qe values of the different pollutants can be calculated experimentally from the slope and intercept of the t/qt versus t plots. From Table 2, the correlation coefficient R2 shows that the pseudo-second-order model fits the experimental data better than the pseudo-first-order model. The calculated correlations are closer to unity for the second-order kinetics model and the calculated equilibrium adsorption capacities of all pollutants matched with the experimental values. The calculated k2 (g mg−1 min) and qe are listed in Table 2.
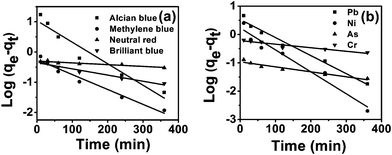 |
| | Fig. 8 Pseudo first order kinetics for adsorption of dyes (a) and heavy metal ions (b) onto tomato peel. | |
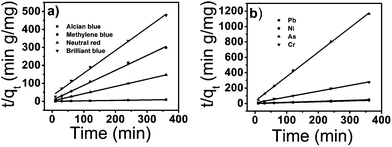 |
| | Fig. 9 Pseudo second order kinetics for adsorption of dyes (a) and heavy metal ions (b) onto tomato peel. | |
Table 2 Pseudo first order and pseudo second order constants and correlation coefficients for adsorption of different pollutants onto tomato peel
| Pollutant |
q
e (exp) |
Pseudo first order kinetic model |
Pseudo second order kinetic model |
|
q
e (mg g−1) |
k
1 (min−1) |
R
2
|
q
e (mg g−1) |
k
2 (g mg−1 min) |
R
2
|
| Alcian blue |
39.5632 |
10.8019 |
0.0164 |
0.941 |
39.6825 |
0.0052 |
0.999 |
| Brilliant blue |
0.8435 |
0.4432 |
0.0046 |
0.969 |
0.8095 |
0.0457 |
0.999 |
| Methylene blue |
2.4405 |
0.5566 |
0.0113 |
0.971 |
2.4770 |
0.0730 |
0.999 |
| Neutral red |
1.5074 |
0.4986 |
0.0138 |
0.971 |
1.3192 |
0.0408 |
0.996 |
| Pb2+ |
7.3120 |
3.3705 |
0.0147 |
0.980 |
7.6104 |
0.0091 |
0.999 |
| Ni2+ |
8.7160 |
1.6904 |
0.0177 |
0.958 |
8.7951 |
0.0329 |
0.999 |
| As3+ |
0.3373 |
0.0939 |
0.0028 |
0.904 |
0.3252 |
0.2172 |
0.990 |
| Cr6+ |
1.5333 |
0.6106 |
0.0032 |
0.975 |
1.4940 |
0.0242 |
0.994 |
3.5. Effect of temperature on adsorption
The adsorption capacities of tomato peel with different pollutants at various temperatures were determined. Tomato peels (0.05 g) were added to aqueous solutions (10 mL) of three different pollutants (AB, Pb2+, PCP) in separate tubes with an initial concentration of 100 mg L−1 each. The solutions were placed on an orbital shaker incubator for 2 h at 250 rpm. The data presented in Table 3 show that the adsorption of pollutants by the tomato peel increased with increasing temperature.41 However, the magnitude of such an increase in adsorption decreased with the increase in temperature from 30 to 60 °C. Such a decrease may be due to the increase in desorption of pollutants from the membrane surface and the increase in solubility of the pollutants in water. The actual mechanism can only be established after a detailed investigation.
Table 3 Adsorption capacities of tomato peels towards different pollutants at different temperatures
|
T (°C) |
Adsorption capacity (mg g−1) |
| Alcian blue |
Pb2+ |
p-Chlorophenol |
| 30 |
25.64 |
6.43 |
10.00 |
| 40 |
27.18 |
7.36 |
15.52 |
| 50 |
30.77 |
7.75 |
7.59 |
| 60 |
31.80 |
8.39 |
4.83 |
3.6. Diffusion rate constant study
In the process of adsorption of pollutants onto tomato peel, there is a possibility of intra-particle diffusion:
According to Weber and Morris,42,43 if the adsorption mechanism involves an intra-particle diffusion processes, a plot of qt versus t1/2 should be a straight line with slope Kp and intercept C. Kp was calculated from the slope of the linear portions of these plots, as shown in Table 4. It is conceivable that the initial curved portion shows the boundary layer diffusion effects (Fig. 10) and the linear portion arises from the intra-particle diffusion effects. The linear plots are explained using fast diffusion to the accessible site for adsorption via available adsorbing sites on the adsorbent surface. The adsorption process for solids can be separated into three stages: (a) mass transfer (boundary-layer diffusion); (b) sorption of ions onto sites and (c) intra-particle diffusion. The correlation coefficient R2 values are close to unity (Table 4), which supports the appropriateness of the application of this model. The divergence in the value of the slope from 0.5 indicates that the contribution of intra-particle diffusion is one of the rate-limiting steps. In addition, there are many other processes controlling the rate of adsorption, all of which are most likely operating simultaneously.
Table 4 Intraparticle diffusion model constants and correlation coefficients for adsorption of different pollutants onto tomato peel
| Pollutant |
Intraparticle diffusion model |
|
K
p1
|
C
1
|
R
2
|
K
p2
|
C
2
|
R
2
|
| Alcian blue |
23.6110 |
13.2210 |
0.990 |
0.1407 |
38.994 |
0.531 |
| Brilliant blue |
0.2516 |
0.2647 |
0.944 |
0.0556 |
0.5857 |
0.893 |
| Methylene blue |
0.8261 |
1.4187 |
0.994 |
0.1208 |
2.3629 |
0.568 |
| Neutral red |
0.1549 |
0.9179 |
0.987 |
0.0236 |
0.9059 |
0.985 |
| Pb2+ |
5.8783 |
0.6033 |
0.911 |
0.1860 |
6.7407 |
0.699 |
| Ni2+ |
3.6860 |
4.9438 |
0.862 |
0.0938 |
8.4324 |
0.640 |
| As3+ |
0.0947 |
0.1706 |
0.994 |
0.0157 |
0.2645 |
0.931 |
| Cr6+ |
0.1061 |
1.0464 |
0.934 |
0.1545 |
0.8393 |
0.972 |
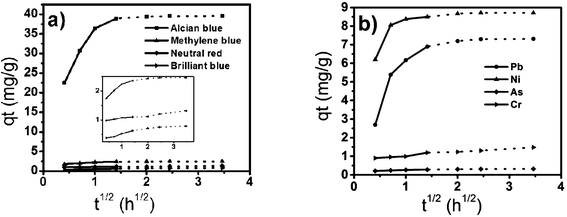 |
| | Fig. 10 Weber and Morris intraparticle diffusion plots for removal of dyes (a) and heavy metal ions (b) by tomato peel. | |
3.7. Regeneration of adsorbent
The mechanism of adsorption can be further investigated using the desorption and regeneration process. The nature of the adsorption of a pollutant onto the surface of the material involves electrostatic attractions between –OH and –COOH on the surface of peels and positive centres of the pollutants. Adsorption experiments show that tomato peel can adsorb cationic pollutants (cationic dyes, Pb2+ and Ni2+) more efficiently than other pollutants. Desorption of these cationic pollutants was studied at different pH values (4, 7 and 10) at a constant temperature of 30 °C. 2% desorption was observed at pH 10 but 96% of pollutants was desorbed at pH 4 within 10 min. Under acidic conditions, H+ ions will replace cationic pollutants from the tomato peel surface. The low extraction capacity of the anionic pollutants (anionic dyes, arsenate and chromate ions) further supports such an adsorption mechanism. In order to show the reusability of the adsorbent, the adsorption–desorption cycle of pollutants was repeated five times using the same experimental conditions. These results showed that recycling tomato peel is efficient and can be used in consecutive pollutant adsorption studies without detectable loss in their adsorption capacity.
4. Conclusions
The adsorption of different pollutants was evaluated using tomato peel as an adsorbent. Adsorption and desorption studies were conducted to understand the adsorption mechanism. Langmuir and Freundlich isotherm models were used to validate the adsorption process. Kinetic studies were undertaken to further understand the adsorption process. Adsorption on tomato peel follows pseudo-second-order kinetics. The tomato peel showed efficient adsorption towards different cationic pollutants such as alcian blue (39.6 mg g−1) dye and metal cations such as Ni2+(8.7 mg g−1). Experimental factors such as pH and temperature of the medium also influence the extraction efficiency. The functional groups on tomato peel can be further modified for the extraction of different contaminants in water. It is conceivable that the use of such biowaste is simple, cost effective and an efficient method for water treatment and can be used in large scale applications.
Acknowledgements
The authors thank the Environment and Water Industry Programme Office (EWI) under the National Research Foundation of Singapore (PUBPP 21100/36/2, NUS WBS no. R-706-002-013-290, R-143-000-458-750, R-143-000-458-731) for their financial support of the work. RM also thanks the National University of Singapore for a scholarship for graduate studies.
References
- B. Jezierska, K. Ługowska and M. Witeska, Fish Physiol. Biochem., 2009, 35, 625–640 CrossRef CAS.
- K. Jomova, Z. Jenisova, M. Feszterova, S. Baros, J. Liska, D. Hudecova, C. J. Rhodes and M. Valko, J. Appl. Toxicol., 2011, 31, 95–107 CAS.
-
S. A. Mansour, in Advances in Food Protection, ed. M. Hefnawy, Springer, Netherlands, 2011, pp. 73–117 Search PubMed.
- N. Mahanta, W. Y. Leong and S. Valiyaveettil, J. Mater. Chem., 2012, 22, 1985–1993 RSC.
- R. Mallampati and S. Valiyaveettil, J. Nanosci. Nanotechnol., 2012, 12, 618–622 CrossRef CAS.
- A. Fernandes, A. Morao, M. Magrinho, A. Lopes and I. Goncalves, Dyes Pigm., 2004, 61, 287–296 CrossRef CAS.
- N. M. Mahmoodi, M. Arami, N. Y. Limaee and N. S. Tabrizi, J. Colloid Interface Sci., 2006, 295, 159–164 CrossRef CAS.
- V. K. Gupta, A. Mittal, R. Jain, M. Mathur and S. Sikarwar, J. Colloid Interface Sci., 2006, 303, 80–86 CrossRef CAS.
- K. Mohanty, J. T. Naidu, B. C. Meikap and M. N. Biswas, Ind. Eng. Chem. Res., 2006, 45, 5165–5171 CrossRef CAS.
- O. Hamdaoui and E. Naffrechoux, J. Hazard. Mater., 2007, 147, 401–411 CrossRef CAS.
- S. L. Wang, Y. M. Tzou, Y. H. Lu and G. Sheng, J. Hazard. Mater., 2007, 147, 313–318 CrossRef CAS.
- A. M. F. Orozco, E. M. Contreras and N. E. Zaritzky, J. Hazard. Mater., 2008, 150, 46–52 CrossRef CAS.
- D. Prahas, Y. Kartika, N. Indraswat and S. Ismadji, Chem. Eng. J., 2008, 140, 32–42 CrossRef CAS.
- A. Gunay, E. Arslankaya and I. Tosun, J. Hazard. Mater., 2007, 146, 362–371 CrossRef.
- R. Han, W. Zou, W. Yu, S. Cheng, Y. Wang and J. Shi, J. Hazard. Mater., 2007, 141, 156–162 CrossRef CAS.
- B. H. Hameed, D. K. Mahmoud and A. L. Ahmad, J. Hazard. Mater., 2008, 158, 499–506 CrossRef CAS.
- K. K. Krishnani, X. Meng, C. Christodoulatos and V. M. Boddu, J. Hazard. Mater., 2008, 153, 1222–1234 CrossRef CAS.
- J. Febrianto, A. N. Kosasih, J. Sunarso, Y. H. Ju, N. Indraswati and S. Ismadji, J. Hazard. Mater., 2009, 162, 616–645 CrossRef CAS.
- A. Mittal, A. Malviya, D. Kaur, J. Mittal and L. Kurup, J. Hazard. Mater., 2007, 148, 229–240 CrossRef CAS.
- W. S. Wan Ngah and M. A. K. M. Hanafiah, Bioresour. Technol., 2008, 99, 3935–3948 CrossRef CAS.
- G. Crini, Bioresour. Technol., 2006, 97, 1061–1085 CrossRef CAS.
- B. H. Hameed, D. K. Mahmoud and A. L. Ahmad, Colloids Surf., A, 2008, 316, 78–84 CrossRef CAS.
- A. Bhatnagar, A. K. Minocha and M. Sillanpaa, Biochem. Eng. J., 2010, 48, 181–186 CrossRef CAS.
-
(a)
http://www.foodproductiondaily.com/Packaging/Using-tomato-waste-in-food-production
;
(b)
http://www.tomatonews.com/resources.html
.
- I. Navarro-Gonzalez, V. Garcia-Valverde, J. Garcia-Alonso and M. J. Periago, Food Res. Int., 2011, 44, 1528–1535 CrossRef CAS.
- A. Hetzroni, A. Vana and A. Mizrach, Postharvest Biol. Technol., 2011, 59, 80–84 CrossRef.
- I. Navarro-Gonzalez, V. Garcia-Valverde, J. Garcia-Alonso and M. J. Periago, Food Res. Int., 2011, 44, 1528–1535 CrossRef CAS.
- A. Denizli, N. Cihangir, N. Tüzmen and G. Alsancak, Bioresour. Technol., 2005, 96, 59–62 CrossRef CAS.
- M. W. Jung, K. H. Ahn, Y. Lee, K. P. Kim, J. S. Rhee, J. T. Park and K. J. Paeng, Microchem. J., 2001, 70, 123–131 CrossRef CAS.
- L. J. Kennedy, J. J. Vijaya, K. Kayalvizhi and G. Sekaran, Chem. Eng. J., 2007, 132, 279–287 CrossRef CAS.
- M. Radhika and K. Palanivelu, J. Hazard. Mater., 2006, 138, 116–124 CrossRef CAS.
- J. M. Li, X. G. Meng, C. W. Hu and J. Du, Bioresour. Technol., 2009, 100, 1168–1173 CrossRef CAS.
- I. Langmuir, J. Am. Chem. Soc., 1916, 38, 2221–2295 CrossRef CAS.
- I. Langmuir, J. Am. Chem. Soc., 1918, 40, 136–403 CrossRef.
- I. Langmuir, J. Am. Chem. Soc., 1918, 40, 1361–1403 CrossRef CAS.
- H. Freundlich, Z. Phys. Chem., 1906, 57, 385–470 CAS.
- O. Redlich and D. L. Peterson, J. Phys. Chem., 1959, 63, 1024 CrossRef CAS.
- V. K. Verma and A. K. Mishra, Global Nest. J., 2010, 12, 190–196 Search PubMed.
- C. Duran, D. Ozdes, A. Gundogdu and H. B. Senturk, J. Chem. Eng. Data, 2011, 56, 2136–2147 CrossRef CAS.
- K. G. Bhattacharyya and S. Sen Gupta, Desalination, 2011, 272, 66–75 CrossRef CAS.
- G. N. Manju, C. Raji and T. S. Anirudhan, Water Res., 1998, 32, 30662–30670 CrossRef.
- W. J. Weber and J. C. Morris, J. Sanit. Eng. Div. Am. Soc. Civ. Eng., 1963, 89, 31–59 Search PubMed.
- W. J. Weber Jr and R. R. Rummer, Water Resour. Res., 1965, 1, 361–368 CrossRef.
|
| This journal is © The Royal Society of Chemistry 2012 |


![[double bond, length as m-dash]](https://www.rsc.org/images/entities/char_e001.gif) O stretch in the carbonyl group of –COOH. The absorptions in the ranges 1600–1585 cm−1 and 1500–1400 cm−1 can be attributed to the stretching of the C
O stretch in the carbonyl group of –COOH. The absorptions in the ranges 1600–1585 cm−1 and 1500–1400 cm−1 can be attributed to the stretching of the C![[double bond, length as m-dash]](https://www.rsc.org/images/entities/char_e001.gif) C bond in the aromatic rings. The peaks due to angular deformation in the plane of the C–H bonds of the aromatic rings (1300–1000 cm−1), axial bending of the C–O bond in phenols (1260–1000 cm−1), and axial bending of the C–O bond in –COOH (1320–1210 cm−1) were visible in the spectrum. IR analysis of the functional groups present in tomato peel matches with the reported literature values.25,26 Upon comparing FT-IR spectra before and after adsorption of the pollutants, significant differences were observed in the positions of the peaks in the spectrum. A noticeable shift in the asymmetric stretch of the –O–H vibration from 3425 cm−1 to 3445 cm−1, and in the asymmetric and symmetric stretches of the C–O bond from 1638 cm−1 to 1650 cm−1 and from 1464 cm−1 to 1458 cm−1, respectively, were observed. The SEM image of tomato peel is shown in Fig. 3, showing a fibrous structure with a fiber thickness in the range 9–25 μm. EDS analysis (Fig. 3b) shows that the major chemical constituents present on the fiber surface are carbon, oxygen and sulphur atoms, which is useful for extracting pollutants from water.14–23
C bond in the aromatic rings. The peaks due to angular deformation in the plane of the C–H bonds of the aromatic rings (1300–1000 cm−1), axial bending of the C–O bond in phenols (1260–1000 cm−1), and axial bending of the C–O bond in –COOH (1320–1210 cm−1) were visible in the spectrum. IR analysis of the functional groups present in tomato peel matches with the reported literature values.25,26 Upon comparing FT-IR spectra before and after adsorption of the pollutants, significant differences were observed in the positions of the peaks in the spectrum. A noticeable shift in the asymmetric stretch of the –O–H vibration from 3425 cm−1 to 3445 cm−1, and in the asymmetric and symmetric stretches of the C–O bond from 1638 cm−1 to 1650 cm−1 and from 1464 cm−1 to 1458 cm−1, respectively, were observed. The SEM image of tomato peel is shown in Fig. 3, showing a fibrous structure with a fiber thickness in the range 9–25 μm. EDS analysis (Fig. 3b) shows that the major chemical constituents present on the fiber surface are carbon, oxygen and sulphur atoms, which is useful for extracting pollutants from water.14–23


