Carbon nanotube-coated macroporous sponge for microbial fuel cell electrodes
Xing
Xie
a,
Meng
Ye
a,
Liangbing
Hu
b,
Nian
Liu
c,
James R.
McDonough
b,
Wei
Chen
d,
H. N.
Alshareef
d,
Craig S.
Criddle
*a and
Yi
Cui
*b
aDepartment of Civil and Environmental Engineering, Stanford University, Stanford, California 94305, USA. E-mail: ccriddle@stanford.edu; Tel: +1-650-723-9032
bDepartment of Materials Science and Engineering, Stanford University, Stanford, California 94305, USA. E-mail: yicui@stanford.edu; Fax: +1-650-725-4034; Tel: +1-650-723-4613
cDepartment of Chemistry, Stanford University, Stanford, California 94305, USA
dMaterials Science and Engineering, King Abdullah University of Science and Technology (KAUST), Jeddah, Saudi Arabia 23955-6900
First published on 9th September 2011
Abstract
The materials that are used to make electrodes and their internal structures significantly affect microbial fuel cell (MFC) performance. In this study, we describe a carbon nanotube (CNT)–sponge composite prepared by coating a sponge with CNTs. Compared to the CNT-coated textile electrodes evaluated in prior studies, CNT–sponge electrodes had lower internal resistance, greater stability, more tunable and uniform macroporous structure (pores up to 1 mm in diameter), and improved mechanical properties. The CNT–sponge composite also provided a three-dimensional scaffold that was favorable for microbial colonization and catalytic decoration. Using a batch-fed H-shaped MFC outfitted with CNT–sponge electrodes, an areal power density of 1.24 W m−2 was achieved when treating domestic wastewater. The maximum volumetric power density of a continuously fed plate-shaped MFC was 182 W m−3. To our knowledge, these are the highest values obtained to date for MFCs fed domestic wastewater: 2.5 times the previously reported maximum areal power density and 12 times the previously reported maximum volumetric power density.
Broader contextMicrobial fuel cell (MFC) technologies can potentially address both energy and water quality challenges because they can enable clean energy production while also purifying water. MFC principles have been demonstrated for lab scale devices, but scale-up to real-world applications is limited by power yield and long-term performance. In this paper, we describe a new composite electrode fabricated by coating macroporous sponge (a familiar everyday material) with carbon nanotubes (a well-studied nanomaterial). When fed domestic wastewater, CNT–sponge electrodes achieved superior performance, with maximum volumetric power densities 12 times higher than previously reported values. CNT–sponges can be used as both bio-electrodes and as abiotic electrodes with or without catalyst decoration. |
Introduction
Domestic wastewater contains oxygen-depleting organics, ammonia, phosphorus, toxic substances, and pathogens. Theoretically, it contains ∼9 times more energy as organic matter and ammonia than is needed to meet the energy demands for treatment.1 Energy recovery is commonly achieved by anaerobic conversion of waste organics into biogas methane which can then be oxidized, but, as first noted in 1911,2 direct microbial oxidation of organic matter can also drive electron flow. Microbial fuel cells (MFCs) that exploit this understanding have enabled energy recovery from human excrement in space,3 self-fed robots,4 and production of electricity from marine sediments.5 At large-scale, a promising application is wastewater treatment, where MFCs may enable direct electricity generation,6hydrogen production,7 and desalination.8
Electrode materials and their spatial orientation significantly affect MFC performance.9 Materials commonly used include commercially available graphite-based electrodes, such as graphite rods,10graphite discs,5graphite felt,11carbon cloth,12 and carbon paper.13 Use of these materials essentially adopts long-standing design criteria developed for chemical fuel cells and batteries, but neglects the biological role of MFC electrodes as habitat for microbial communities. To satisfy this function, electrode materials should facilitate microbial colonization and attachment, substrate transport to attached microorganisms, removal of waste products, efficient transfer of electrons from the microorganisms to the electrode surface, and efficient collection of current from all regions of the electrode. Modified graphite electrodes14–16 and new composites17–20 confer some of these properties. An open three-dimensional (3D) macroporous structure is desirable because it enables internal colonization and efficient transport of substrates. Length scales and the surface area accessible for colonization are particularly important. Although some new electrode materials are porous, pore diameters are normally less than 10 μm and are easily clogged by microbial growth.17Pores that are too small also hinder substrate transport into the electrode interior, wasting surface area. To increase the specific surface area, one research group21 has fabricated a graphite fiber brush electrode with a high specific surface area (7170–18![[thin space (1/6-em)]](https://www.rsc.org/images/entities/char_2009.gif) 200 m2 m−3) by winding graphite fibers into a twisted core consisting of two titanium wires, but evidence is lacking that the full surface of these fibers is accessible for microbial colonization. Recently, Chen et al. used electrospinning and solution blowing techniques to make 3D carbon fiber nonwovens but pore sizes for these materials were in the range of microns, so clogging remains a concern for long-term application.22 For MFC electrodes that do not require microbial adhesion (cathodes typically), researchers have focused on reducing capital cost by employing catalytic materials other than precious metals, including activated carbon,23Ni,24Fe,25Co,26Mn,27 and N-doped carbon nanotubes (CNTs).28
200 m2 m−3) by winding graphite fibers into a twisted core consisting of two titanium wires, but evidence is lacking that the full surface of these fibers is accessible for microbial colonization. Recently, Chen et al. used electrospinning and solution blowing techniques to make 3D carbon fiber nonwovens but pore sizes for these materials were in the range of microns, so clogging remains a concern for long-term application.22 For MFC electrodes that do not require microbial adhesion (cathodes typically), researchers have focused on reducing capital cost by employing catalytic materials other than precious metals, including activated carbon,23Ni,24Fe,25Co,26Mn,27 and N-doped carbon nanotubes (CNTs).28
Previously, we reported on the fabrication and properties of a CNT–textile bio-electrode. A CNT-coated textile provides an open 3D space for internal colonization with efficient electrolyte transport and an affinitive CNT surface for extracellular electron transfer.29 We also used electrochemical deposition to decorate CNT–textile with platinum nanoparticles for oxygen reduction.30 These CNT–textile electrodes achieved superior performance compared to commercially available carbon cloth electrodes. In this study, we changed the electrode substrate from textile, a random structure comprised of intertwined fibers, to sponge, a periodic and tunable structure whose properties can be controlled by varying different synthetic process conditions. Because sponge offers a continuous 3D surface that is virtually free of interrupted junctions, it can enable useful functionalities that are difficult to obtain with paper or textile. The lack of junctions makes it easier to apply a continuous skin of conductive nanomaterials. As shown in Fig. 1a, the sponge open lattice network enables a continuous 3D CNT coating that reduces internal resistance, connects internal surface area and provides a mechanically stable scaffold for microbial colonization. In the present study, we investigated the performance of conventional MFCs outfitted with CNT–sponge electrodes when fed real domestic wastewater. High current densities and power densities were achieved.
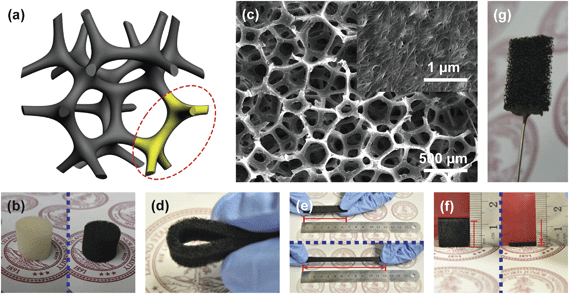 | ||
| Fig. 1 Carbon nanotube (CNT)–sponge electrode. (a) Schematic of CNT–sponge showing the macroporous structure and continuous three-dimensional (3D) CNT coating. (b) A sponge cylinder before application of a CNT coating (white) and after (black). (c) Scanning electron microscopy (SEM) image of the CNT–sponge. (d) A bent CNT–sponge strip. (e) A CNT–sponge strip before (∼6 cm long) and after (∼12 cm long) stretching. (f) A CNT–sponge cube before (∼1.2 cm thick) and after (∼0.2 cm thick) compression. (g) A CNT–sponge electrode applied in this study (1 cm × 1 cm × 0.2 cm). | ||
Results and discussion
A “sponge” is an aquatic animal that lives by maintaining a constant water flow through its porous body to obtain food and oxygen and to remove waste. Because of its soft texture and high water uptake, sponges have long been used for household cleaning. In imitation of the porous structure of natural sponges, synthetic sponges were developed using synthetic polymers, and are widely used for packaging, furniture padding, personal care, and many other applications.Plain sponges were coated with CNTs through a simple and scalable dipping and drying process.31,32 The sponge was dipped into a CNT ink, allowing the ink to fill the voids and coat the hydrophilic macroscale pores. It was then allowed to dry at ∼90 °C. The mechanical flexibility of individual CNTs and their strong affinity for the sponge surface enabled formation of a CNT “skin” that conformed to the sponge surface.33 This conformal CNT coating conferred conductivity upon the surface area of the entire matrix and changed the color of the sponge from white to black (Fig. 1b). Because the inside surface of the sponge is continuous in three dimensions, the conformal coating is also continuous in all three dimensions (Fig. 1a). As a solid conducting material, the CNT–sponge achieved a conductance of ∼1 S cm−1, even with a CNT coating of only ∼200 nm thick. The CNT–sponge is thus sufficiently conductive to function as an electrode in small scale applications; for large-scale applications, a current collector could be envisioned if necessary.29 The thin CNT coating did not change the macroporous configuration of the sponge. Fig. 1c shows an SEM image of a CNT–sponge with a pore size range of 300–500 μm and the CNT surface as the inset. Based on density measurements, the porosity is ∼98%. The estimated specific surface area is ∼104 m2 m−3 based on the dimensions of the sponge framework and pore size (Fig. 1c). The CNT-coated sponge preserves the mechanical properties of the uncoated sponge: it is flexible and can be bent arbitrarily to any degree (Fig. 1d). It is also stretchable and compressible. Fig. 1e shows a 6 cm long CNT–sponge strip stretched to ∼12 cm and Fig. 1f shows a 1.2 cm thick CNT–sponge cube compressed to ∼0.2 cm. When the applied forces were released, CNT-coated sponges returned to their original shapes without deformation.
As an electrode in MFCs, CNT–sponge has the same benefits as CNT–textile, including an open macroporous structure for efficient electrolyte transport and a microporous CNT layer for strong electrode–biofilm interaction.29 The CNT–sponge also has other advantages. Its continuous 3D CNT coating prevents interruption of contact between the CNT–textile fibers, resulting in lower internal resistance. Pore diameters are more uniformly distributed and can be tuned during sponge synthesis.34 Tunability over a wide range (up to the millimetre scale) allows the pore size to be optimized for different MFC systems. Larger pores are possible because of the internal framework of the sponge. Finally, unlike the CNT–textile, with its layered structure of the limited thickness, the CNT–sponge is isotropic. The CNT–sponge can be processed into any shapes to fit a range of device configurations, such as cubes, cylinders, or strips.
The CNT–sponges can be used as both bio-electrodes and as abiotic electrodes with or without catalyst decoration. In this study, a pristine CNT–sponge and a platinum (Pt) decorated CNT–sponge were investigated as anodes and cathodes, respectively. Organics were oxidized at the anode, and oxygen was reduced at the cathode. Fig. 1g shows a CNT–sponge electrode ready for assembly.
The CNT–sponge achieved a maximum current density of 2.13 mA cm−2 or 10.63 mA cm−3 in glucose media (1 g L−1) (Fig. 2a). This is 48% higher than that obtained from the CNT–textile under the same conditions (1.44 mA cm−2 or 7.18 mA cm−3).29 After 30 days of steady current output, a piece of the CNT–sponge anode was cut open, and the interior was examined. The open porous structure of the CNT–sponge allowed internal colonization (Fig. 2b and c), and the biofilm did not clog the pores. Fig. 2d shows a single microorganism lying on the CNT surface, and illustrates the connection between microbial nanowires and the CNTs. After changing from a glucose medium to filtered domestic wastewater, the CNT–sponge generated a maximum current of 0.52 mA cm−2 or 2.58 mA cm−3 (Fig. 2a). Lower current generation for domestic wastewater compared to glucose media was expected, and has been reported by others.12,35Fig. 3a shows an SEM image of a CNT–sponge–Pt cathode. The bright lines sketch out the framework of the CNT–sponge, and the dots indicate clusters of Pt nanoparticles (Fig. 3a, the inset). With a low Pt loading of 0.17 mg cm−2 or 0.85 mg cm−3, the CNT–sponge–Pt had high oxygen reduction activity with a current density maximum of 4.79 mA cm−2 or 23.95 mA cm−3 (Fig. 3b). Current generation was negligible when the electrolyte was purged with N2 (Fig. 3b), confirming that the negative current was due to oxygen reduction.
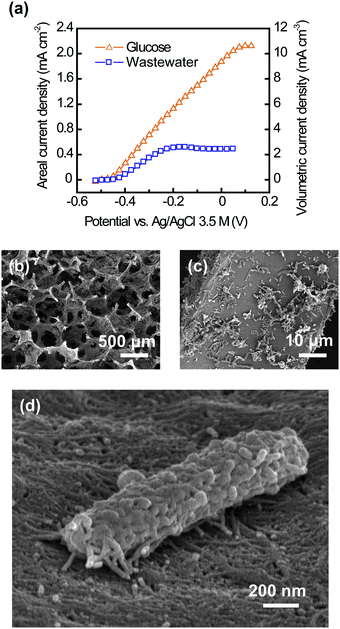 | ||
| Fig. 2 Use of a CNT–sponge as a conventional MFC anode. (a) Current generation by the CNT–sponge with a mature biofilm from glucose (1 g L−1) and domestic wastewater (265 ± 21 mg COD L−1). (b and c) Interior SEM images of the CNT–sponge after microbial colonization. (d) A single microorganism lying on the CNT surface, illustrating the strong interaction between the microbial nanowires and CNTs. | ||
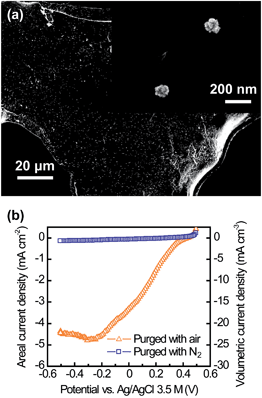 | ||
| Fig. 3 Use of a CNT–sponge as a conventional MFC cathode. (a) SEM image of a corner of the CNT–sponge after Pt decoration, with the inset showing clusters of Pt nanoparticles. (b) Current generation from oxygen reduction showing the strong catalytic activity of the CNT–sponge–Pt cathode. | ||
To investigate the full-cell performance of CNT–sponge electrodes, two MFC configurations were employed with different operating modes: a classic H-shaped MFC (HMFC) in batch mode and a compact plate-shaped MFC (PMFC) in continuous mode. The CNT–sponge electrodes were first evaluated in the HMFCs intermittently fed glucose or wastewater. Fig. 4a and b show typical current generation cycles in glucose and filtered wastewater, respectively. Changes in current tracked changes in COD: anolyte COD decreased from 1035 mg L−1 to 100 mg L−1 (90% removal) for glucose (Fig. 4a) and from 280 mg L−1 to 78 mg L−1 (72% removal) for filtered wastewater (Fig. 4b). A marked change in COD occurred when the COD values were lower than ∼100 mg L−1 in both cases. The residual COD may consist of refractory organics and/or soluble microbial metabolism products that cannot be used for power production. Coulombic efficiencies were 13% for glucose and 7% for wastewater. Maximum power density measurements were performed 10 hours after anolyte replacement. At this point, power generation returned to a steady state, while soluble COD levels remained elevated. As shown in Fig. 4c, the maximum power density generated was 1.99 W m−2 or 0.66 W m−3 for the HMFC fed glucose medium, and 1.24 W m−2 or 0.41 W m−3 for the HMFC fed filtered domestic wastewater.
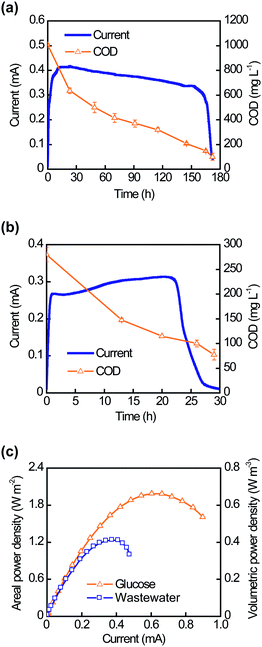 | ||
| Fig. 4 Performance of the H-shaped MFC (HMFC) in batch mode. Typical current generation cycles are shown with decreasing anolyte COD values when the HMFC was intermittently fed with glucose (a) or domestic wastewater (b). (c) Polarization curves of HMFCs show the maximum power densities achieved with glucose and domestic wastewater. | ||
After three replicated cycles of current generation in the HMFCs, the same CNT–sponge electrodes were moved to the PMFCs. Using a continuous flow of glucose media or domestic wastewater, the PMFCs operated at a steady current output for 300 hours and 120 hours, respectively (Fig. 5a and b). The hydraulic retention times were only 6 minutes for glucose media and 2.4 minutes for domestic wastewater. The effluent COD of the glucose-fed PMFC was 340 ± 80 mg L−1 (a removal efficiency of 67% and a volumetric removal rate of 170 g L−1d−1) while the effluent COD of the PMFC fed filtered domestic wastewater was 91 ± 13 mg L−1 (a removal efficiency of 64% and a volumetric removal rate of 113 g L−1d−1). The coulombic efficiencies were 7% for glucose and 9% for wastewater. Measurements of the maximum power density were made at the end of the experiment. As shown in Fig. 5c, the maximum volumetric power densities achieved were 1.30 W m−2 or 325 W m−3 for glucose and 0.73 W m−2 or 182 W m−3 for domestic wastewater.
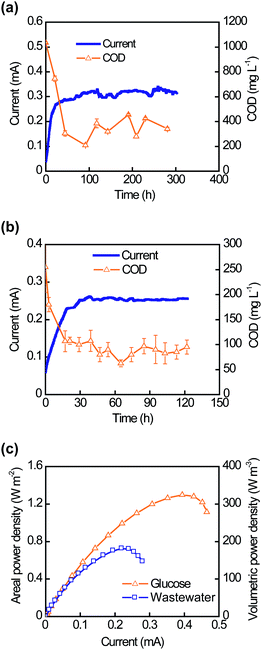 | ||
| Fig. 5 Performance of the plate-shaped MFC (PMFC) in continuous mode. Current generation and effluent COD values when the PMFC was continuously fed with glucose (a) or domestic wastewater (b). (c) Polarization curves of PMFCs showing the maximum power densities achieved with glucose and domestic wastewater. | ||
The CNT–sponge electrodes achieved higher areal power densities in the HMFCs than in the PMFCs for both glucose (1.99 W m−2vs. 1.30 W m−2) and wastewater (1.24 W m−2vs. 0.73 W m−2). Possible explanations would include: (1) accumulation of electron mediators in the anode chamber during batch operation, and (2) larger anode chambers within the HMFCs (150 cm3vs. 0.2 cm3) may have enabled growth of more unattached microorganisms capable of electron mediator production or partial degradation of complex substrates into simpler substrates that are in turn used for current generation. By contrast, PMFCs achieved ∼500 times higher volumetric power densities than the HMFCs (325 W m−3vs. 0.66 W m−3 for glucose and 182 W m−3vs. 0.41 W m−3 for wastewater), due to more efficient utilization of space (i.e., a more compact device configuration). The continuous flow in PMFCs improved the accessibility of the CNT–sponge to anolyte, and allowed higher power generation.12 Only a few MFC studies have used authentic domestic wastewater as feed.12,35–39 Compared to these previous studies, MFCs equipped with CNT–sponge electrodes achieved at least 2.5-fold higher areal power densities and 12-fold higher volumetric power densities.
To evaluate long-term MFC performance, we fed a glucose medium to an HMFC equipped with CNT–sponge electrodes for about 1 year. Fig. 6a illustrates the maximum operational power density of the consecutive electricity generation cycles. The power output was stable for the first 5 months then declined after 8 months, possibly due to a shift in microbial community structure. As shown in Fig. 6b, the macropores of the CNT–sponge did not clog after about one year of operation.
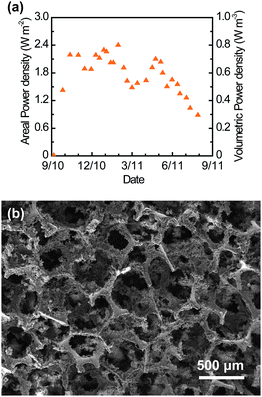 | ||
| Fig. 6 Long-term performance of the CNT–sponge. (a) Maximum operational power density achieved in consecutive electricity generation cycles of a glucose-fed HMFC in batch mode. Power density changes for each cycle reflected the pattern for current density illustrated in Fig. 4a. (b) SEM image of the interior CNT–sponge anode after about one year of operation. | ||
Conclusions
A new CNT–sponge electrode fabricated by coating CNTs conformally onto a sponge is described. Use of a sponge for CNT coating appears superior to previously studied textiles, providing a continuous 3D CNT surface, controllable and tunable pore sizes, and excellent mechanical properties. The CNT–sponge achieved a current density maximum of 2.13 mA cm−2 or 10.63 mA cm−3 in a glucose medium (1 g L−1), 48% higher than that obtained from the CNT–textile under the same conditions. The MFCs equipped with the CNT–sponge electrodes achieved a maximum areal power density of 1.24 W m−2 and a maximum volumetric power density of 182 W m−3. To our knowledge, these are the highest values reported to date.Experimental
Sponge electrode synthesis
Aqueous CNT ink was prepared by dispersing single-walled CNTs (Carbon Solution, Inc., CA) in water with sodium dodecylbenzene sulfonate (SDBS) as a surfactant. The concentration was 0.1% CNT and 1% SDBS (by weight). The dispersion process entailed bath sonication for 5 minutes followed by probe sonication for 30 minutes. Sponges from polyurethane (McMaster-Carr, CA) were cut into desired shapes, dipped into CNT ink, then removed and dried at ∼90 °C. The dipping–drying process was repeated twice to increase CNT loading. Pt deposition was achieved using an electrochemical method described previously.30 The reaction conditions were all the same but the total charge increased to 2 C. All the CNT–sponge and CNT–sponge–Pt electrodes had dimensions of 1 cm × 1 cm × 0.2 cm. Thus, the projected surface area was 1 cm2 and the total volume was 0.2 cm3.MFC setup and operation
The HMFCs were assembled by connecting two chambers of 150 cm3 with a 40 mm diameter tube. The PMFCs consisted of two chambers both having the same dimensions as the CNT–sponge electrodes (1 cm × 1 cm × 0.2 cm). The anode was the CNT–sponge and the cathode was the CNT–sponge–Pt. An anion exchange membrane (AMI-7001, Membranes International Inc., NJ) was used as the separator. Inoculum was anolyte from a MFC originally seeded with settled, domestic wastewater from the Palo Alto Regional Water Quality Control Plant. Two different feedings were applied to the anode: one solution contained glucose media containing glucose (1.0 g L−1), NaH2PO4·H2O (4.90 g L−1), Na2HPO4 (9.15 g L−1), KCl (0.26 g L−1), NH4Cl (0.62 g L−1), mineral solution (12.5 mL L−1) and vitamin solution (5 mL L−1);40,41 the other solution consisted of real domestic wastewater, with a COD value of 265 ± 21 mg L−1, collected from a sewer at Escondido Village at Stanford University. For the HMFCs, the anolyte was mixed by a magnetic stirrer (200 rpm) and intermittently replaced when the operating voltage dropped below 0.05 V. In the case of the PMFCs, influent was continuously supplied at a flow rate of 2 mL h−1 for glucose and at a flow rate of 5 mL h−1 for filtered wastewater. The HMFC cathode chamber was filled and the PMFC cathode chamber was continuously flushed with a PBS buffer (the same as the glucose solution, but without glucose, mineral solution, and vitamin solution, pH 7) saturated with air. All MFCs were operated at 30 °C with a 1 kΩ external loading.MFC characterization
Maximum current densities were tested determined by linear staircase voltammetry at step-sweep rates of 25 mV per 3 minutes for CNT–sponge anodes and 10 mV per 10 seconds for CNT–sponge–Pt cathodes. The counter electrode was Pt and the reference electrode was a double junction Ag|AgCl|KCl (3.5 M) electrode. The results were both normalized to the projected surface area (1 cm2) and the volume (0.2 cm3) of the electrodes. To determine the maximum power densities, polarization curves were measured at a step-sweep rate of 30 mV per 5 minutes starting from the OCV value. The anode was the working electrode, and the cathode served as both the counter electrode and reference electrode. The results were normalized to the projected surface area (1 cm2) of the electrodes or the total cell volume (300 cm3 for HMFCs and for 0.4 cm3 PMFCs). COD values were measured by a HACH COD analysis kit (HACH, Co., USA). Pt loading was measured using an inductively coupled plasma-mass spectrometer (ICP-MS, ThermoFisher Scientific XSeries 2). The topography of electrode surfaces was explored using a field emission scanning electron microscope (SEM, FEI XL30 Sirion).Acknowledgements
We thank Karin North and Tracy Ingebrigtsen for experimental assistance. This work was partially supported by the King Abdullah University of Science and Technology (KAUST) Investigator Award (No. KUS-l1-001-12). JM acknowledges support from the National Defense Science and Engineering and National Science Foundation graduate research fellowships. XX acknowledge the support from the Stanford Graduate Fellowship.References
- B. E. Logan, Nat. Rev. Microbiol., 2009, 7, 375–381 CrossRef CAS.
- M. C. Potter, Proc. R. Soc. London, Ser. B, 1911, 84, 260–276 CrossRef.
- J. J. Konikoff, L. W. Reynolds and E. S. Harris, Aerosp. Med., 1963, 34, 1129–1133 CAS.
- S. Wilkinson, Auton. Rob., 2000, 9, 99–111 CrossRef.
- L. M. Tender, C. E. Reimers, H. A. Stecher, D. E. Holmes, D. R. Bond, D. A. Lowy, K. Pilobello, S. J. Fertig and D. R. Lovley, Nat. Biotechnol., 2002, 20, 821–825 CAS.
- H. Liu, R. Ramnarayanan and B. E. Logan, Environ. Sci. Technol., 2004, 38, 2281–2285 CrossRef CAS.
- S. Cheng and B. E. Logan, Proc. Natl. Acad. Sci. U. S. A., 2007, 104, 18871–18873 CrossRef CAS.
- X. Cao, X. Huang, P. Liang, K. Xiao, Y. Zhou, X. Zhang and B. E. Logan, Environ. Sci. Technol., 2009, 43, 7148–7152 CrossRef CAS.
- Y. Qiao, S.-J. Bao and C. M. Li, Energy Environ. Sci., 2010, 3, 544–553 CAS.
- S. K. Chaudhuri and D. R. Lovley, Nat. Biotechnol., 2003, 21, 1229–1232 CrossRef CAS.
- B. H. Kim, H. S. Park, H. J. Kim, G. T. Kim, I. S. Chang, J. Lee and N. T. Phung, Appl. Microbiol. Biotechnol., 2004, 63, 672–681 CrossRef CAS.
- S. Cheng, H. Liu and B. E. Logan, Environ. Sci. Technol., 2006, 40, 2426–2432 CrossRef CAS.
- B. Min and B. E. Logan, Environ. Sci. Technol., 2004, 38, 5809–5814 CrossRef CAS.
- H. Y. Tsai, C. C. Wu, C. Y. Lee and E. P. Shih, J. Power Sources, 2009, 194, 199–205 CrossRef CAS.
- Y. Zhao, K. Watanabe, R. Nakamura, S. Mori, H. Liu, K. Ishii and K. Hashimoto, Chem.–Eur. J., 2010, 16, 4982–4985 CrossRef CAS.
- M. Sun, F. Zhang, Z. H. Tong, G. P. Sheng, Y. Z. Chen, Y. Zhao, Y. P. Chen, S. Y. Zhou, G. Liu, Y. C. Tian and H. Q. Yu, Biosens. Bioelectron., 2010, 26, 338–343 CrossRef CAS.
- Y. Qiao, S. J. Bao, C. M. Li, X. Q. Cui, Z. S. Lu and J. Guo, ACS Nano, 2008, 2, 113–119 CrossRef CAS.
- Y. Qiao, C. M. Li, S. J. Bao and Q. L. Bao, J. Power Sources, 2007, 170, 79–84 CrossRef CAS.
- Y. J. Zou, C. L. Xiang, L. N. Yang, L. X. Sun, F. Xu and Z. Cao, Int. J. Hydrogen Energy, 2008, 33, 4856–4862 CrossRef CAS.
- X.-W. Liu, X.-F. Sun, Y.-X. Huang, G.-P. Sheng, S.-G. Wang and H.-Q. Yu, Energy Environ. Sci., 2011, 4, 1422–1427 CAS.
- B. Logan, S. Cheng, V. Watson and G. Estadt, Environ. Sci. Technol., 2007, 41, 3341–3346 CrossRef CAS.
- S. L. Chen, H. Q. Hou, F. Harnisch, S. A. Patil, A. A. Carmona-Martinez, S. Agarwal, Y. Y. Zhang, S. Sinha-Ray, A. L. Yarin, A. Greiner and U. Schroder, Energy Environ. Sci., 2011, 4, 1417–1421 CAS.
- F. Zhang, S. A. Cheng, D. Pant, G. Van Bogaert and B. E. Logan, Electrochem. Commun., 2009, 11, 2177–2179 CrossRef CAS.
- A. W. Jeremiasse, H. V. M. Hamelers, M. Saakes and C. J. N. Buisman, Int. J. Hydrogen Energy, 2011, 35, 12716–12723 CrossRef.
- P. Aelterman, M. Versichele, E. Genettello, K. Verbeken and W. Verstraete, Electrochim. Acta, 2009, 54, 5754–5760 CrossRef CAS.
- J. R. Kim, J. Y. Kim, S. B. Han, K. W. Park, G. D. Saratale and S. E. Oh, Bioresour. Technol., 2011, 102, 342–347 CrossRef CAS.
- X. Li, B. X. Hu, S. Suib, Y. Lei and B. K. Li, J. Power Sources, 2010, 195, 2586–2591 CrossRef CAS.
- L. Feng, Y. Yan, Y. Chen and L. Wang, Energy Environ. Sci., 2011, 4, 1892–1899 CAS.
- X. Xie, L. B. Hu, M. Pasta, G. F. Wells, D. S. Kong, C. S. Criddle and Y. Cui, Nano Lett., 2011, 11, 291–296 CrossRef CAS.
- X. Xie, M. Pasta, L. Hu, Y. Yang, J. McDonough, J. Cha, C. S. Criddle and Y. Cui, Energy Environ. Sci., 2011, 4, 1293–1297 CAS.
- L. Hu, M. Pasta, F. L. Mantia, L. Cui, S. Jeong, H. D. Deshazer, J. W. Choi, S. M. Han and Y. Cui, Nano Lett., 2010, 10, 708–714 CrossRef CAS.
- L. Hu, J. W. Choi, Y. Yang, S. Jeong, F. La Mantia, L.-F. Cui and Y. Cui, Proc. Natl. Acad. Sci. U. S. A., 2009, 106, 21490–21494 CrossRef CAS.
- T. Hertel, R. E. Walkup and P. Avouris, Phys. Rev. B: Condens. Matter, 1998, 58, 13870–13873 CrossRef CAS.
- M. Szycher, Szycher's Handbook of Polyurethanes, CRC Press LLC, 1999 Search PubMed.
- H. Liu and B. E. Logan, Environ. Sci. Technol., 2004, 38, 4040–4046 CrossRef CAS.
- Y. Ahn and B. E. Logan, Bioresour. Technol., 2010, 101, 469–475 CrossRef CAS.
- S. J. You, Q. L. Zhao, J. Q. Jiang and J. N. Zhang, Chem. Biochem. Eng. Q., 2006, 20, 407–412 CAS.
- M. M. Ghangrekar and V. B. Shinde, Water Sci. Technol., 2008, 58, 37–43 CrossRef CAS.
- D. Q. Jiang, M. Curtis, E. Troop, K. Scheible, J. McGrath, B. X. Hu, S. Suib, D. Raymond and B. K. Li, Int. J. Hydrogen Energy, 2011, 36, 876–884 CrossRef CAS.
- S. Oh, B. Min and B. E. Logan, Environ. Sci. Technol., 2004, 38, 4900–4904 CrossRef CAS.
- W. E. Balch, G. E. Fox, L. J. Magrum, C. R. Woese and R. S. Wolfe, Microbiol. Rev., 1979, 43, 260–296 CAS.
| This journal is © The Royal Society of Chemistry 2012 |
