 Open Access Article
Creative Commons Attribution 3.0 Unported Licence
Microparticulate/nanoparticulate powders of a novel Nrf2 activator and an aerosol performance enhancer for pulmonary delivery targeting the lung Nrf2/Keap-1 pathway
Priya
Muralidharan
a,
Don
Hayes
Jr.
bc,
Stephen M.
Black
d and
Heidi M.
Mansour
*aefg
aCollege of Pharmacy, Skaggs Pharmaceutical Sciences Center, The University of Arizona, 1703 E. Mabel St, Tucson, AZ 85721-0202, USA. E-mail: mansour@pharmacy.arizona.edu; Tel: +1 520 626 2768
bDepartments of Pediatrics and Internal Medicine, Lung and Heart–Lung Transplant Programs, The Ohio State University College of Medicine, Columbus, OH 43205, USA
cThe Davis Heart and Lung Research Institute, The Ohio State University College of Medicine, Columbus, OH 43205, USA
dDepartment of Medicine, Division of Translational and Regenerative Medicine, The University of Arizona, Tucson, AZ 85724, USA
eInstitute of the Environment, The University of Arizona, Tucson, AZ 85721, USA
fNational Cancer Institute Comprehensive Cancer Center, The University of Arizona, Tucson, AZ 85721, USA
gThe BIO5 Research Institute, The University of Arizona, Tucson, AZ 85721, USA
First published on 27th January 2016
Abstract
This systematic and comprehensive study reports for the first time on the successful rational design of advanced inhalable therapeutic dry powders containing dimethyl fumarate, a first-in-class Nrf2 activator drug to treat pulmonary inflammation, using particle engineering design technology for targeted delivery to the lungs as advanced spray dried (SD) one-component DPIs. In addition, two-component co-spray dried (co-SD) DMF![[thin space (1/6-em)]](https://www.rsc.org/images/entities/char_2009.gif) :
:![[thin space (1/6-em)]](https://www.rsc.org/images/entities/char_2009.gif) D-Man DPIs with high drug loading were successfully designed for targeted lung delivery as advanced DPIs using organic solution advanced spray drying in closed mode. Regional targeted deposition using design of experiments (DoE) for in vitro predictive lung modeling based on aerodynamic properties was tailored based on composition and spray drying parameters. These findings indicate the significant potential of using D-Man in spray drying to improve particle formation and aerosol performance of small molecule with a relatively low melting point. These respirable microparticles/nanoparticles in the solid-state exhibited excellent aerosol dispersion performance with an FDA-approved human DPI device. Using in vitro predictive lung deposition modeling, the aerosol deposition patterns of these particles show the capability to reach lower airways to treat inflammation in this region in pulmonary diseases such as acute lung injury (ALI), chronic obstructive pulmonary disease (COPD), pulmonary hypertension (PH), and pulmonary endothelial disease.
D-Man DPIs with high drug loading were successfully designed for targeted lung delivery as advanced DPIs using organic solution advanced spray drying in closed mode. Regional targeted deposition using design of experiments (DoE) for in vitro predictive lung modeling based on aerodynamic properties was tailored based on composition and spray drying parameters. These findings indicate the significant potential of using D-Man in spray drying to improve particle formation and aerosol performance of small molecule with a relatively low melting point. These respirable microparticles/nanoparticles in the solid-state exhibited excellent aerosol dispersion performance with an FDA-approved human DPI device. Using in vitro predictive lung deposition modeling, the aerosol deposition patterns of these particles show the capability to reach lower airways to treat inflammation in this region in pulmonary diseases such as acute lung injury (ALI), chronic obstructive pulmonary disease (COPD), pulmonary hypertension (PH), and pulmonary endothelial disease.
Introduction
Acute lung injury (ALI) and the acute respiratory distress syndrome (ARDS) are life-threatening conditions that occur in critically ill patients, including patients who experience shock, trauma, sepsis, burns, aspiration, or pneumonia. Although the terms ALI and ARDS are often used interchangeably, strict criteria reserve ARDS for the most severe form of the disease. Clinical manifestations include inflammatory responses of the lung to both direct and indirect insults and are characterized by severe hypoxemia, hypercapnia, diffuse infiltration on radiographs, and a substantial reduction in pulmonary compliance. Although mechanical ventilation (MV) is crucial for maintaining life during ALI/ARDS, the mechanical forces generated during ventilation can further damage the lungs due to alveolar distension, barotrauma, and cyclic airway closing and reopening. This phenomenon, ventilator associated lung injury (VALI), can trigger a pulmonary and systemic inflammatory reaction leading to multiple organ dysfunction and organ failure.Chronic obstructive pulmonary disease (COPD) is a chronic disease occurring primarily in elderly patients that is often associated with chronic inflammatory response leading to airflow limitation. The pathophysiology of COPD1 involves chronic inflammation of the airways due to chronic bronchitis and emphysema. Alveolar macrophages play a key role in this inflammatory response by releasing inflammatory mediators including tumor necrosis factor-α (TNF-α), interleukin (IL)-6, IL-8, monocyte chemotactic peptide (MCP)-1, leukotriene LTB4 and reactive oxygen species (ROS).2 In patients with COPD, cellular remodeling of airway smooth muscle occurs more often and this is not fully reversible. Current, treatment options for COPD includes anticholinergics, beta2-agonists, and inhaled corticosteroids.3–5 Current therapeutics control the symptoms but do not cure the underlying disease.6 Similarly, in disease such as pulmonary hypertension (PH) there is both pulmonary endothelial injury and remodeling of the pulmonary smooth muscle layer. Based upon a large number of studies in animal models, the three major stimuli that drive the vascular remodeling process are shear stress,7,8 inflammation,9,10 and hypoxia.11 Although, the precise mechanisms by which these stimuli impair pulmonary vascular function increased oxidative stress is thought to play a major role is unresolved. The oxidative stress in PH has been linked to increases in uncoupled endothelial nitric oxide synthase (eNOS),12 increases in the activity of xanthine oxidase13 and NADPH oxidase14 activity as well as mitochondrial dysfunction.15
Dimethyl fumarate (DMF), is shown to possess anti-inflammatory16 property that can be explored to target the cellular inflammatory response pathway6 and protect against oxidative stress in patients with COPD.17 DMF is a fumaric acid ester known for its therapeutic activity in treating multiple sclerosis (MS) and psoriasis. Its efficiency in treating psoriasis vulgaris was introduced through self-experiment by German chemist Walter Schweckendieck.18 Several years later, DMF was approved for topical skin administration as Fumaderm® for treating dermatologic conditions in Europe. Recently, the DMF was approved in the United States as an orally administered delayed-release capsule, Tecfidera® (Biogen, Research Triangle Park, NC) to treat the autoimmune neurological disease, multiple sclerosis. The approval of DMF to treat multiple sclerosis has opened doors to new avenues for research in using DMF in other inflammatory and autoimmune conditions, such as polyarthiritis, vascular calcification,19 renal fibrosis,20 and pancreatitis.21,22
It has been shown that DMF possess both anti-inflammatory and anti-oxidant properties. Its mode of action as an anti-oxidant is attributed to its ability to activate the nuclear factor (erythroid – derived 2) – like 2 (Nrf2) genetic pathway and so reduce oxidative stress.23,24 In normal cells, Nrf2 is sequestered by the Kelch like – ECH-associated protein 1 (Keap-1) to form a Nrf2–Keap 1 complex. However, during oxidative stress Nrf2 dissociates from Keap-1, translocates into the nucleus and binds to electrophile response elements (ARE), promoting the transcription of the target gene. DMF activates the dissociation of Nrf2 from Keap-1 by selectively blocking, or binding to, reactive cysteine residues in Keap-1.19
Nrf2 has been reported to alleviate lung inflammation following lung injury25 and its anti-inflammatory property is attributed to its ability to prevent nuclear factor kappa B (NF-κB) translocation into the nucleus.26 As a result, NF-κB dependent gene expression is attenuated. Siedel et al., have shown that in the airway, DMF exhibits both an anti-inflammatory effect, by inhibiting NF-κB6 and an ability to attenuate airway smooth muscle cell proliferation through induction of heme-oxygenase-1 (HO-1).27 There is increasing interest in exploring the anti-oxidant signaling pathway (Nrf2), for anti-inflammatory therapy and stimulating the Nrf2 pathway in alveolar macrophages has been shown to prevent the exacerbation of COPD caused by bacterial infection.28
Little is known regarding the role of Nrf2 in pulmonary endothelial diseases such as PH. However, it has been shown that Nrf2 is stimulated in endothelial cells, exposed to laminar shear stress.29 Increased shear stress is thought to be a major component of the endothelial dysfunction associated with certain congenital heart defects that result in increased pulmonary blood flow.7,8 Interestingly, oscillatory shear stress, such as that observed during the development of atherosclerosis and which results in reduced NO (nitric oxide) production and increased superoxide generation30 decreases Nrf2-mediated activation of ARE-linked genes and transitions the endothelium to a proathrogenic state.31 Recent evidence also suggests that the Nrf2–Keap1 complex may be tethered to the mitochondrion and this complex may directly sense ROS that are released from mitochondria.32 As mitochondrial ROS are stimulated during the development of endothelial dysfunction33–35 this may allow Nrf2 signaling to be stimulated. A potential concern in using Nrf2 activators in a non-targeted manner is the reported dual role of the Nrf2 pathway in cancer progression, as reported by Zhang et al.36 To overcome this deleterious action we propose a targeted delivery to the lungs, using inhalation delivery, which would target the Nrf2 activators to the intended site of action in the organ and significantly reduce, or even eliminate, off-target side effects.
Hence, in this systematic and comprehensive study, we have engineered DMF into advanced inhalable dry powders that can be targeted to the respiratory tract as dry powder inhalers (DPIs) using an FDA-approved human DPI device. Organic solution closed mode advanced spray drying was employed to exploit the unique advantages of organic solvents over aqueous in forming dry particles that are both inhalable and high performing as DPIs, as we have reported.37–41 There is of plethora of literature on the various types of nanomaterials that can be used in drug delivery.42–45 In addition to advanced spray drying under rationally chosen spray drying conditions to engineer spray dried (SD) DMF nanostructured inhalable powders, DMF was co-spray dried (co-SD) with D-mannitol (D-Man) at various molar ratios with high drug loading. D-Man is a non-reducing sugar, a mucolytic agent, and an aerosol performance enhancer in DPIs. We chose D-Man based on our previously study in which D-Man significantly improved in vitro aerosol dispersion performance.46 To the authors' knowledge, we are the first to report on inhalable microparticles/nanoparticles of DMF and co-SD DMF![[thin space (1/6-em)]](https://www.rsc.org/images/entities/char_2009.gif) :
:![[thin space (1/6-em)]](https://www.rsc.org/images/entities/char_2009.gif) D-Man for targeted pulmonary delivery as advanced DPIs.
D-Man for targeted pulmonary delivery as advanced DPIs.
Experimental: materials and methods
Materials
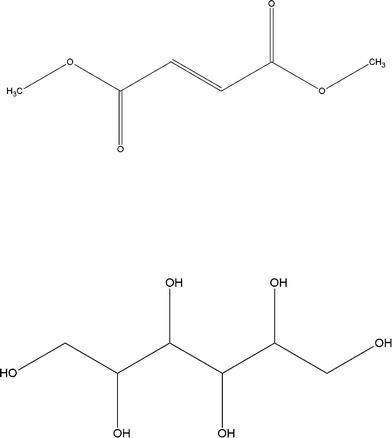
DMF [97% purity] [C6H8O4; molecular weight (MW): 144.12 g mol−1], shown in Fig. 1 (ChemDraw Ultra Ver. 10.0.; CambridgeSoft, Cambridge, Massachusetts), was obtained from Sigma-Aldrich (St. Louis, Missouri). Raw Man (C6H14O6; MW: 182.17 g mol−1) (Fig. 1) was obtained from Acros Organics (New Jersey,USA). Methanol (HPLC grade, ACS-certified grade, purity 99.9%) was obtained from Fisher Scientific (Fair Lawn, New Jersey). HYDRANAL®-Coulomat AD was obtained from Sigma-Aldrich. The nitrogen gas used was ultra-high purity (UHP) nitrogen gas (Cryogenics and gas facility, The University of Arizona, Tucson, Arizona). Raw DMF was stored in sealed glass desiccators over Indicating Drierite/Drierite™ desiccant at room temperature. Raw D-Man was used as received and stored under room conditions. Other chemicals were stored under room conditions.Methods
![[thin space (1/6-em)]](https://www.rsc.org/images/entities/char_2009.gif) :
:![[thin space (1/6-em)]](https://www.rsc.org/images/entities/char_2009.gif) Man mixtures.
Man mixtures.
| Powder composition (molar ratio) | Molar ratio composition (DMF![[thin space (1/6-em)]](https://www.rsc.org/images/entities/char_2009.gif) : :![[thin space (1/6-em)]](https://www.rsc.org/images/entities/char_2009.gif) D-Man) D-Man) |
Feed concentration in MeOH (% w/v) | Pump rate (%) | Inlet T (°C) | Outlet T (°C) |
|---|---|---|---|---|---|
| a No particles obtained. | |||||
| SD DMF | 100![[thin space (1/6-em)]](https://www.rsc.org/images/entities/char_2009.gif) : :![[thin space (1/6-em)]](https://www.rsc.org/images/entities/char_2009.gif) 0 0 |
1 | High (100%) | 89 | 30–44 |
| SD DMF | 100![[thin space (1/6-em)]](https://www.rsc.org/images/entities/char_2009.gif) : :![[thin space (1/6-em)]](https://www.rsc.org/images/entities/char_2009.gif) 0 0 |
1 | Med (50%) | 90 | 38–41a |
| SD DMF | 100![[thin space (1/6-em)]](https://www.rsc.org/images/entities/char_2009.gif) : :![[thin space (1/6-em)]](https://www.rsc.org/images/entities/char_2009.gif) 0 0 |
1 | Low (25%) | 89–90 | 46–49a |
co-SD DMF![[thin space (1/6-em)]](https://www.rsc.org/images/entities/char_2009.gif) : :![[thin space (1/6-em)]](https://www.rsc.org/images/entities/char_2009.gif) D-MAN D-MAN |
90![[thin space (1/6-em)]](https://www.rsc.org/images/entities/char_2009.gif) : :![[thin space (1/6-em)]](https://www.rsc.org/images/entities/char_2009.gif) 10 10 |
0.81 | Low (25%) | 90 | 48–49 |
co-SD DMF![[thin space (1/6-em)]](https://www.rsc.org/images/entities/char_2009.gif) : :![[thin space (1/6-em)]](https://www.rsc.org/images/entities/char_2009.gif) D-MAN D-MAN |
90![[thin space (1/6-em)]](https://www.rsc.org/images/entities/char_2009.gif) : :![[thin space (1/6-em)]](https://www.rsc.org/images/entities/char_2009.gif) 10 10 |
0.81 | Med (50%) | 90 | 37–39 |
co-SD DMF![[thin space (1/6-em)]](https://www.rsc.org/images/entities/char_2009.gif) : :![[thin space (1/6-em)]](https://www.rsc.org/images/entities/char_2009.gif) D-MAN D-MAN |
90![[thin space (1/6-em)]](https://www.rsc.org/images/entities/char_2009.gif) : :![[thin space (1/6-em)]](https://www.rsc.org/images/entities/char_2009.gif) 10 10 |
0.81 | High (100%) | 90 | 19–30 |
co-SD DMF![[thin space (1/6-em)]](https://www.rsc.org/images/entities/char_2009.gif) : :![[thin space (1/6-em)]](https://www.rsc.org/images/entities/char_2009.gif) D-MAN D-MAN |
80![[thin space (1/6-em)]](https://www.rsc.org/images/entities/char_2009.gif) : :![[thin space (1/6-em)]](https://www.rsc.org/images/entities/char_2009.gif) 20 20 |
0.46 | Low (25%) | 90 | 48–49 |
co-SD DMF![[thin space (1/6-em)]](https://www.rsc.org/images/entities/char_2009.gif) : :![[thin space (1/6-em)]](https://www.rsc.org/images/entities/char_2009.gif) D-MAN D-MAN |
80![[thin space (1/6-em)]](https://www.rsc.org/images/entities/char_2009.gif) : :![[thin space (1/6-em)]](https://www.rsc.org/images/entities/char_2009.gif) 20 20 |
0.46 | Med (50%) | 90 | 36–40 |
co-SD DMF![[thin space (1/6-em)]](https://www.rsc.org/images/entities/char_2009.gif) : :![[thin space (1/6-em)]](https://www.rsc.org/images/entities/char_2009.gif) D-MAN D-MAN |
80![[thin space (1/6-em)]](https://www.rsc.org/images/entities/char_2009.gif) : :![[thin space (1/6-em)]](https://www.rsc.org/images/entities/char_2009.gif) 20 20 |
0.46 | High (100%) | 90–91 | 14–24 |
co-SD DMF![[thin space (1/6-em)]](https://www.rsc.org/images/entities/char_2009.gif) : :![[thin space (1/6-em)]](https://www.rsc.org/images/entities/char_2009.gif) D-MAN D-MAN |
50![[thin space (1/6-em)]](https://www.rsc.org/images/entities/char_2009.gif) : :![[thin space (1/6-em)]](https://www.rsc.org/images/entities/char_2009.gif) 50 50 |
0.18 | Low (25%) | 89–90 | 45–50 |
co-SD DMF![[thin space (1/6-em)]](https://www.rsc.org/images/entities/char_2009.gif) : :![[thin space (1/6-em)]](https://www.rsc.org/images/entities/char_2009.gif) D-MAN D-MAN |
50![[thin space (1/6-em)]](https://www.rsc.org/images/entities/char_2009.gif) : :![[thin space (1/6-em)]](https://www.rsc.org/images/entities/char_2009.gif) 50 50 |
0.18 | Med (50%) | 90 | 30–35 |
co-SD DMF![[thin space (1/6-em)]](https://www.rsc.org/images/entities/char_2009.gif) : :![[thin space (1/6-em)]](https://www.rsc.org/images/entities/char_2009.gif) D-MAN D-MAN |
50![[thin space (1/6-em)]](https://www.rsc.org/images/entities/char_2009.gif) : :![[thin space (1/6-em)]](https://www.rsc.org/images/entities/char_2009.gif) 50 50 |
0.18 | High (100%) | 90 | 35–39 |
| SD D-MAN | 0![[thin space (1/6-em)]](https://www.rsc.org/images/entities/char_2009.gif) : :![[thin space (1/6-em)]](https://www.rsc.org/images/entities/char_2009.gif) 100 100 |
0.1 | Low (25%) | 90–91 | 47–48 |
| SD D-MAN | 0![[thin space (1/6-em)]](https://www.rsc.org/images/entities/char_2009.gif) : :![[thin space (1/6-em)]](https://www.rsc.org/images/entities/char_2009.gif) 100 100 |
0.1 | Med (50%) | 90 | 31–33 |
| SD D-MAN | 0![[thin space (1/6-em)]](https://www.rsc.org/images/entities/char_2009.gif) : :![[thin space (1/6-em)]](https://www.rsc.org/images/entities/char_2009.gif) 100 100 |
0.1 | High (100%) | 89–90 | 28–10 |
![[thin space (1/6-em)]](https://www.rsc.org/images/entities/char_2009.gif) 000× magnification was analyzed by measuring the diameter of at least 100 particles per sample.
000× magnification was analyzed by measuring the diameter of at least 100 particles per sample.
For the NGI, Q = 60 L min−1, the Da50 aerodynamic cutoff diameter for each NGI stage was calibrated by the manufacturer and stated as: stage 1 (8.06 μm); stage 2 (4.46 μm); stage 3 (2.82 μm); stage 4 (1.66 μm); stage 5 (0.94 μm); stage 6 (0.55 μm); and stage 7 (0.34 μm). The emitted dose (ED) was determined as the difference between the initial mass of powder loaded in the capsules and the remaining mass of powder in the capsules following aerosolization. The ED (%) eqn (1) was used to express the percentage of ED based on the total dose (TD) used. The fine particle dose (FPD) was defined as the dose deposited on stages 2 to 7. The fine particle fraction (FPF%) eqn (2) was expressed as the percentage of FPD to ED. The respirable fraction (RF%) eqn (3) was used as the percentage of FPD to total deposited dose (DD) on all impactor stages.
 | (1) |
 | (2) |
 | (3) |
Statistical analysis
Design of experiments (DoEs) for in vitro aerosol performance was conducted using Design Expert® 8.0.7.1 software (Stat-Ease Corporation, Minneapolis, Minnesota). A full factorial design of 31 for single component spray dried D-Man and a factorial design of 32 for co-SD systems were designed. Interaction of excipient and process parameter on the performance of the formulation was evaluated using the 3-D surface plot generated from Design Expert®. All experiments were performed in triplicate (n = 3). Results are expressed as mean ± standard deviation.Results
Scanning electron microscopy (SEM)
Spray dried DMF was successfully produced at 100% pump rate. Co-SD DMF![[thin space (1/6-em)]](https://www.rsc.org/images/entities/char_2009.gif) :
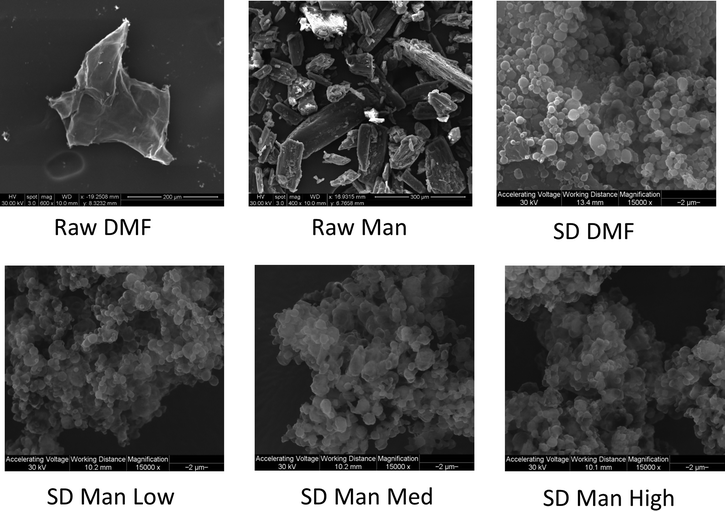
:![[thin space (1/6-em)]](https://www.rsc.org/images/entities/char_2009.gif) D-Man powders at various molar compositions with high drug loading were successfully produced at low (25%), medium (50%) and high (100%) pump rates. The particle shape and surface morphology were visualized by SEM for the all raw and spray dried (SD) one-component powders of DMF and D-Man (Fig. 2). All spray dried samples showed smooth and spherical nanoparticles/nanospheres compared to raw DMF and Man. SD DMF at high pump rate showed smooth and spherical particles and SD D-Man showed spherical particles at low pump rate with slight sintering of particles at medium and high pump rate.
D-Man powders at various molar compositions with high drug loading were successfully produced at low (25%), medium (50%) and high (100%) pump rates. The particle shape and surface morphology were visualized by SEM for the all raw and spray dried (SD) one-component powders of DMF and D-Man (Fig. 2). All spray dried samples showed smooth and spherical nanoparticles/nanospheres compared to raw DMF and Man. SD DMF at high pump rate showed smooth and spherical particles and SD D-Man showed spherical particles at low pump rate with slight sintering of particles at medium and high pump rate.
As shown in Fig. 3, co-SD particles at DMF![[thin space (1/6-em)]](https://www.rsc.org/images/entities/char_2009.gif) :
:![[thin space (1/6-em)]](https://www.rsc.org/images/entities/char_2009.gif) D-Man 90
D-Man 90![[thin space (1/6-em)]](https://www.rsc.org/images/entities/char_2009.gif) :
:![[thin space (1/6-em)]](https://www.rsc.org/images/entities/char_2009.gif) 10 and 80
10 and 80![[thin space (1/6-em)]](https://www.rsc.org/images/entities/char_2009.gif) :
:![[thin space (1/6-em)]](https://www.rsc.org/images/entities/char_2009.gif) 20 molar ratios exhibited spherical particles at all pump rates with smooth surface morphology. Co-SD DMF
20 molar ratios exhibited spherical particles at all pump rates with smooth surface morphology. Co-SD DMF![[thin space (1/6-em)]](https://www.rsc.org/images/entities/char_2009.gif) :
:![[thin space (1/6-em)]](https://www.rsc.org/images/entities/char_2009.gif) D-Man 50
D-Man 50![[thin space (1/6-em)]](https://www.rsc.org/images/entities/char_2009.gif) :
:![[thin space (1/6-em)]](https://www.rsc.org/images/entities/char_2009.gif) 50 particles exhibited spherical particles with smooth surface morphology at low pump rates and somewhat crinkled particles at medium & high pump rates.
50 particles exhibited spherical particles with smooth surface morphology at low pump rates and somewhat crinkled particles at medium & high pump rates.
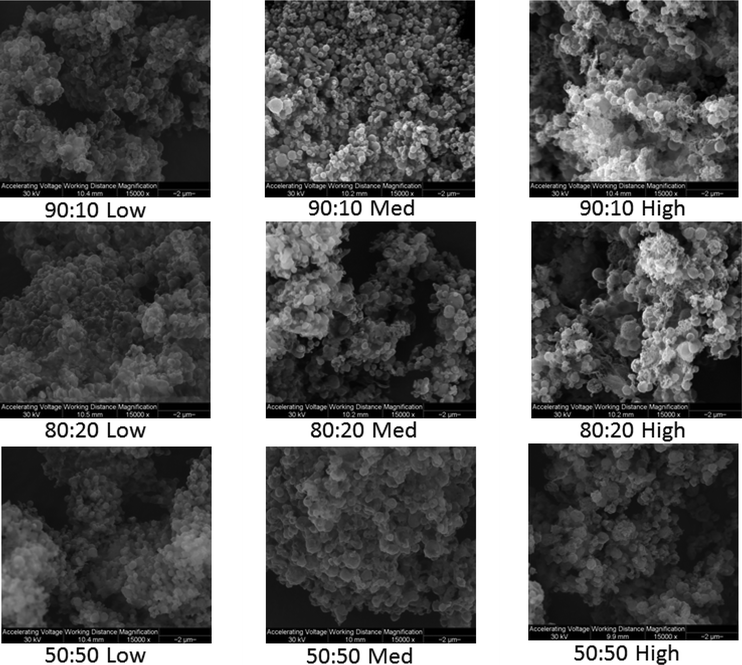 | ||
Fig. 3 SEM micrographs of co-SD DMF![[thin space (1/6-em)]](https://www.rsc.org/images/entities/char_2009.gif) : :![[thin space (1/6-em)]](https://www.rsc.org/images/entities/char_2009.gif) D-Man solid-state particles as a function of composition and advanced spray drying pump rate (low, med, and high). D-Man solid-state particles as a function of composition and advanced spray drying pump rate (low, med, and high). | ||
Particle sizing and size distribution by image analysis of SEM micrographs
As shown in Table 2, all co-SD samples had projected mean geometric diameter in the size range of 0.51–1.04 μm, while individually spray dried DMF had 0.76 μm and mannitol had 0.56–1.08 μm. Majority of the particles had a mean geometric diameter in nanoscale range which is in agreement with the SEM micrographs. All the SD and co-SD particles had particle size range ≤5 μm, which is the preferred particle size for inhalation powders.| Powder composition (molar ratio) | Spray drying pump rate (%) | Mean size (μm) | Size range (μm) |
|---|---|---|---|
| SD DMF | High (100%) | 0.76 ± 0.33 | 0.18–2.25 |
Co-SD DMF![[thin space (1/6-em)]](https://www.rsc.org/images/entities/char_2009.gif) : :![[thin space (1/6-em)]](https://www.rsc.org/images/entities/char_2009.gif) D-MAN 90 D-MAN 90![[thin space (1/6-em)]](https://www.rsc.org/images/entities/char_2009.gif) : :![[thin space (1/6-em)]](https://www.rsc.org/images/entities/char_2009.gif) 10 10 |
Low (25%) | 0.51 ± 0.16 | 0.24–1.00 |
Co-SD DMF![[thin space (1/6-em)]](https://www.rsc.org/images/entities/char_2009.gif) : :![[thin space (1/6-em)]](https://www.rsc.org/images/entities/char_2009.gif) D-MAN 90 D-MAN 90![[thin space (1/6-em)]](https://www.rsc.org/images/entities/char_2009.gif) : :![[thin space (1/6-em)]](https://www.rsc.org/images/entities/char_2009.gif) 10 10 |
Med (50%) | 0.56 ± 0.18 | 0.28–1.30 |
Co-SD DMF![[thin space (1/6-em)]](https://www.rsc.org/images/entities/char_2009.gif) : :![[thin space (1/6-em)]](https://www.rsc.org/images/entities/char_2009.gif) D-MAN 90 D-MAN 90![[thin space (1/6-em)]](https://www.rsc.org/images/entities/char_2009.gif) : :![[thin space (1/6-em)]](https://www.rsc.org/images/entities/char_2009.gif) 10 10 |
High (100%) | 0.78 ± 0.29 | 0.31–1.74 |
Co-SD DMF![[thin space (1/6-em)]](https://www.rsc.org/images/entities/char_2009.gif) : :![[thin space (1/6-em)]](https://www.rsc.org/images/entities/char_2009.gif) D-MAN 80 D-MAN 80![[thin space (1/6-em)]](https://www.rsc.org/images/entities/char_2009.gif) : :![[thin space (1/6-em)]](https://www.rsc.org/images/entities/char_2009.gif) 20 20 |
Low (25%) | 0.58 ± 0.39 | 0.24–3.61 |
Co-SD DMF![[thin space (1/6-em)]](https://www.rsc.org/images/entities/char_2009.gif) : :![[thin space (1/6-em)]](https://www.rsc.org/images/entities/char_2009.gif) D-MAN 80 D-MAN 80![[thin space (1/6-em)]](https://www.rsc.org/images/entities/char_2009.gif) : :![[thin space (1/6-em)]](https://www.rsc.org/images/entities/char_2009.gif) 20 20 |
Med (50%) | 0.64 ± 0.32 | 0.22–2.09 |
Co-SD DMF![[thin space (1/6-em)]](https://www.rsc.org/images/entities/char_2009.gif) : :![[thin space (1/6-em)]](https://www.rsc.org/images/entities/char_2009.gif) D-MAN 80 D-MAN 80![[thin space (1/6-em)]](https://www.rsc.org/images/entities/char_2009.gif) : :![[thin space (1/6-em)]](https://www.rsc.org/images/entities/char_2009.gif) 20 20 |
High (100%) | 0.84 ± 0.37 | 0.27–2.29 |
Co-SD DMF![[thin space (1/6-em)]](https://www.rsc.org/images/entities/char_2009.gif) : :![[thin space (1/6-em)]](https://www.rsc.org/images/entities/char_2009.gif) D-MAN 50 D-MAN 50![[thin space (1/6-em)]](https://www.rsc.org/images/entities/char_2009.gif) : :![[thin space (1/6-em)]](https://www.rsc.org/images/entities/char_2009.gif) 50 50 |
Low (25%) | 0.54 ± 0.18 | 0.23–0.98 |
Co-SD DMF![[thin space (1/6-em)]](https://www.rsc.org/images/entities/char_2009.gif) : :![[thin space (1/6-em)]](https://www.rsc.org/images/entities/char_2009.gif) D-MAN 50 D-MAN 50![[thin space (1/6-em)]](https://www.rsc.org/images/entities/char_2009.gif) : :![[thin space (1/6-em)]](https://www.rsc.org/images/entities/char_2009.gif) 50 50 |
Med (50%) | 1.04 ± 0.47 | 0.34–2.93 |
Co-SD DMF![[thin space (1/6-em)]](https://www.rsc.org/images/entities/char_2009.gif) : :![[thin space (1/6-em)]](https://www.rsc.org/images/entities/char_2009.gif) D-MAN 50 D-MAN 50![[thin space (1/6-em)]](https://www.rsc.org/images/entities/char_2009.gif) : :![[thin space (1/6-em)]](https://www.rsc.org/images/entities/char_2009.gif) 50 50 |
High (100%) | 1.01 ± 0.45 | 0.31–2.66 |
| SD D-MAN | Low (25%) | 0.56 ± 0.25 | 0.21–1.33 |
| SD D-MAN | Med (50%) | 1.08 ± 0.62 | 0.39–3.12 |
| SD D-MAN | High (100%) | 0.80 ± 0.45 | 0.27–2.71 |
X-Ray powder diffraction (XRPD)
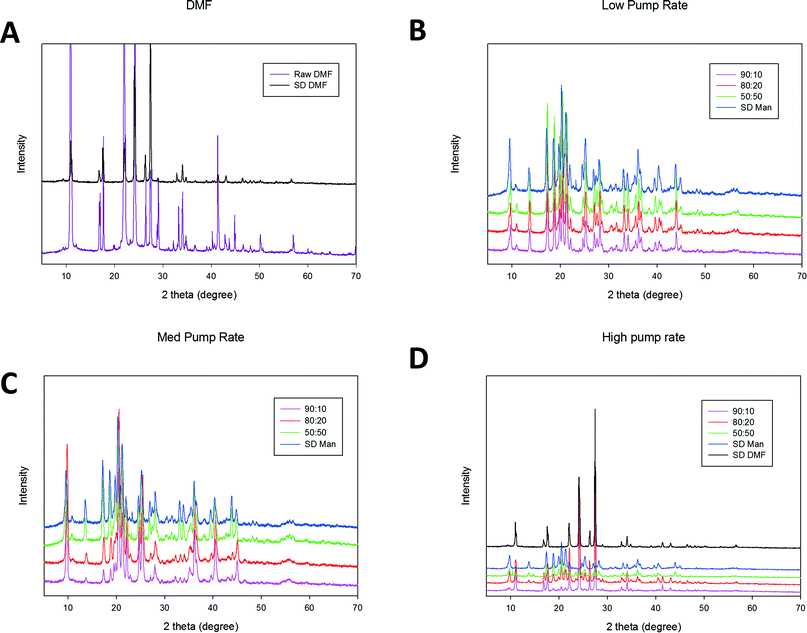
The XRPD pattern of raw DMF showed sharp and intensive peaks characteristic of long-range molecular order (i.e. crystallinity) at 2-theta degree values of 10.94, 21.99 and 24.28, as shown in Fig. 4. To the authors knowledge this is the first time powder diffraction pattern of DMF has been reported. The observed peaks are in excellent agreement with predicted powder diffraction pattern obtained using CCDC Cambridge database software. SD DMF had the same pattern as raw DMF suggesting that raw and SD DMF had the same crystal structure. XRPD pattern of D-Man has been previously reported.46 Comparing with the previous report, the raw D-Man used in this study was found to be beta form with prominent peaks at 18.77, 23.39, 14.65 and 20.47 2-theta degree values. However, SD D-Man exhibited peaks at different 2-theta degree values. The diffraction pattern of SD D-Man closely resembles that of alpha and delta polymorphic forms at all three pump rates. Li et al. observed alpha (medium pump rate) and alpha and delta (high pump rate) polymorphic forms at the same pump rate.46 However, it is worth mentioning that the inlet and outlet temperatures were different in both the studies. The rich diffraction pattern seen in both the samples (DMF and D-Man) suggest that the single components possessed long range molecular order and this was retained after spray drying.For the co-SD DMF![[thin space (1/6-em)]](https://www.rsc.org/images/entities/char_2009.gif) :
:![[thin space (1/6-em)]](https://www.rsc.org/images/entities/char_2009.gif) D-Man powders, all XRPD diffractograms exhibited sharp peaks which are characteristic of long-range molecular order i.e. crystallinity, as shown in Fig. 4. The diffraction pattern of co-SD samples (all three molar ratios) were similar to SD D-Man at low and medium pump rates. At high pump rate, 90
D-Man powders, all XRPD diffractograms exhibited sharp peaks which are characteristic of long-range molecular order i.e. crystallinity, as shown in Fig. 4. The diffraction pattern of co-SD samples (all three molar ratios) were similar to SD D-Man at low and medium pump rates. At high pump rate, 90![[thin space (1/6-em)]](https://www.rsc.org/images/entities/char_2009.gif) :
:![[thin space (1/6-em)]](https://www.rsc.org/images/entities/char_2009.gif) 10 had diffraction pattern similar to SD DMF while other two molar ratios had mixed pattern resembling both DMF and D-Man.
10 had diffraction pattern similar to SD DMF while other two molar ratios had mixed pattern resembling both DMF and D-Man.
All spray dried and co-spray dried samples exhibited several sharp peaks characteristic of long range molecular order, which is consistent with highly crystalline powders. Unlike majority of spray dried systems which forms amorphous dispersion, the presence of sharp peaks in spray dried and co-SD samples is indicative of retention of crystallinity following organic solution closed mode spray drying. Retention of crystallinity by mannitol following spray drying was recently reported by Li et al.46
Differential scanning calorimetry (DSC)
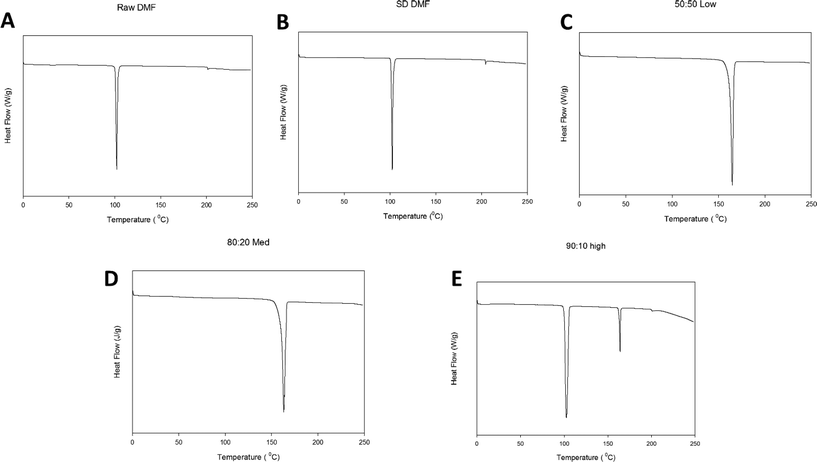
Representative DSC thermograms of raw components, SD single component and co-spray dried particles are shown in Fig. 5. Raw and SD DMF exhibit single endothermic transition at about 102 °C suggesting transition from ordered to disordered phase. The presence of ordered phase at room temperature is in good agreement with XRPD data. Raw and SD D-Man exhibited single transition similar to previously reported results.46 As can be seen from Table 3, an increase in enthalpy was observed for SD D-Man samples with an increase in pump rate. There was a spray drying pump rate effect observed on the DSC thermograms of co-SD particles. At low and medium pump rates, there was only one endothermic transition at about 164 °C, while at high pump rate two endothermic transitions were observed at 102 °C and 164 °C. At room temperature, all co-SD particles exhibited no transition suggesting existence of ordered phase that is consistent with XRPD observation. At higher heating scan rates of 20 °C min−1 and 40 °C min−1, there was no reproducible transition (glass) or no transition observed for all the samples (data not shown). The two endothermic peaks observed at high pump rate suggest decreased molecular miscibility between the two components at that pump rate (100%) while single peak at lower pump rates suggest molecular encapsulation of the drug in the excipient (D-Man). In any case, from all DSC data it is clear that the components exist in crystalline ordered phase before and after spray drying suggesting absence of polymorphic interconversion.| Powder composition (molar ratio) | Spray drying pump rate (%) | T peak (°C) | ΔH (J g−1) |
|---|---|---|---|
| Raw DMF | N/A | 102.19 ± 0.02 | 245.3 ± 37.26 |
| Raw D-MAN | N/A | 166.39 ± 0.06 | 316.97 ± 3.02 |
| SD DMF | High (100%) | 102.12 ± 0.21 | 242.133 ± 7.73 |
Co-SD DMF![[thin space (1/6-em)]](https://www.rsc.org/images/entities/char_2009.gif) : :![[thin space (1/6-em)]](https://www.rsc.org/images/entities/char_2009.gif) D-MAN 90 D-MAN 90![[thin space (1/6-em)]](https://www.rsc.org/images/entities/char_2009.gif) : :![[thin space (1/6-em)]](https://www.rsc.org/images/entities/char_2009.gif) 10 10 |
Low (25%) | 164.08 ± 0.10 | 308.67 ± 124.91 |
Co-SD DMF![[thin space (1/6-em)]](https://www.rsc.org/images/entities/char_2009.gif) : :![[thin space (1/6-em)]](https://www.rsc.org/images/entities/char_2009.gif) D-MAN 90 D-MAN 90![[thin space (1/6-em)]](https://www.rsc.org/images/entities/char_2009.gif) : :![[thin space (1/6-em)]](https://www.rsc.org/images/entities/char_2009.gif) 10 10 |
Med (50%) | 163.78 ± 0.03 | 303.57 ± 19.49 |
Co-SD DMF![[thin space (1/6-em)]](https://www.rsc.org/images/entities/char_2009.gif) : :![[thin space (1/6-em)]](https://www.rsc.org/images/entities/char_2009.gif) D-MAN 90 D-MAN 90![[thin space (1/6-em)]](https://www.rsc.org/images/entities/char_2009.gif) : :![[thin space (1/6-em)]](https://www.rsc.org/images/entities/char_2009.gif) 10 10 |
High (100%) | 102.90 ± 0.26 | 231.57 ± 11.48 |
| 164.34 ± 0.19 | 33.88 ± 1.79 | ||
Co-SD DMF![[thin space (1/6-em)]](https://www.rsc.org/images/entities/char_2009.gif) : :![[thin space (1/6-em)]](https://www.rsc.org/images/entities/char_2009.gif) D-MAN 80 D-MAN 80![[thin space (1/6-em)]](https://www.rsc.org/images/entities/char_2009.gif) : :![[thin space (1/6-em)]](https://www.rsc.org/images/entities/char_2009.gif) 20 20 |
Low (25%) | 163.87 ± 0.04 | 290.03 ± 2.67 |
Co-SD DMF![[thin space (1/6-em)]](https://www.rsc.org/images/entities/char_2009.gif) : :![[thin space (1/6-em)]](https://www.rsc.org/images/entities/char_2009.gif) D-MAN 80 D-MAN 80![[thin space (1/6-em)]](https://www.rsc.org/images/entities/char_2009.gif) : :![[thin space (1/6-em)]](https://www.rsc.org/images/entities/char_2009.gif) 20 20 |
Med (50%) | 163.36 ± 0.22 | 286.00 ± 3.01 |
Co-SD DMF![[thin space (1/6-em)]](https://www.rsc.org/images/entities/char_2009.gif) : :![[thin space (1/6-em)]](https://www.rsc.org/images/entities/char_2009.gif) D-MAN 80 D-MAN 80![[thin space (1/6-em)]](https://www.rsc.org/images/entities/char_2009.gif) : :![[thin space (1/6-em)]](https://www.rsc.org/images/entities/char_2009.gif) 20 20 |
High (100%) | 102.08 ± 0.19 | 154.93 ± 0.27 |
| 164.08 ± 0.04 | 96.09 ± 17.35 | ||
Co-SD DMF![[thin space (1/6-em)]](https://www.rsc.org/images/entities/char_2009.gif) : :![[thin space (1/6-em)]](https://www.rsc.org/images/entities/char_2009.gif) D-MAN 50 D-MAN 50![[thin space (1/6-em)]](https://www.rsc.org/images/entities/char_2009.gif) : :![[thin space (1/6-em)]](https://www.rsc.org/images/entities/char_2009.gif) 50 50 |
Low (25%) | 164.69 ± 0.19 | 233.83 ± 18.14 |
Co-SD DMF![[thin space (1/6-em)]](https://www.rsc.org/images/entities/char_2009.gif) : :![[thin space (1/6-em)]](https://www.rsc.org/images/entities/char_2009.gif) D-MAN 50 D-MAN 50![[thin space (1/6-em)]](https://www.rsc.org/images/entities/char_2009.gif) : :![[thin space (1/6-em)]](https://www.rsc.org/images/entities/char_2009.gif) 50 50 |
Med (50%) | 164.99 ± 0.19 | 267.37 ± 20.46 |
Co-SD DMF![[thin space (1/6-em)]](https://www.rsc.org/images/entities/char_2009.gif) : :![[thin space (1/6-em)]](https://www.rsc.org/images/entities/char_2009.gif) D-MAN 50 D-MAN 50![[thin space (1/6-em)]](https://www.rsc.org/images/entities/char_2009.gif) : :![[thin space (1/6-em)]](https://www.rsc.org/images/entities/char_2009.gif) 50 50 |
High (100%) | 100.26 ± 0.44 | 11.22 ± 1.22 |
| 164.61 ± 0.51 | 286.50 ± 35.27 | ||
| SD D-MAN | Low (25%) | 164.92 ± 0.12 | 251.33 ± 6.98 |
| SD D-MAN | Med (50%) | 163.32 ± 0.17 | 285.17 ± 27.24 |
| SD D-MAN | High (100%) | 164.06 ± 0.10 | 366.13 ± 57.10 |
HSM under cross-polarizer lens
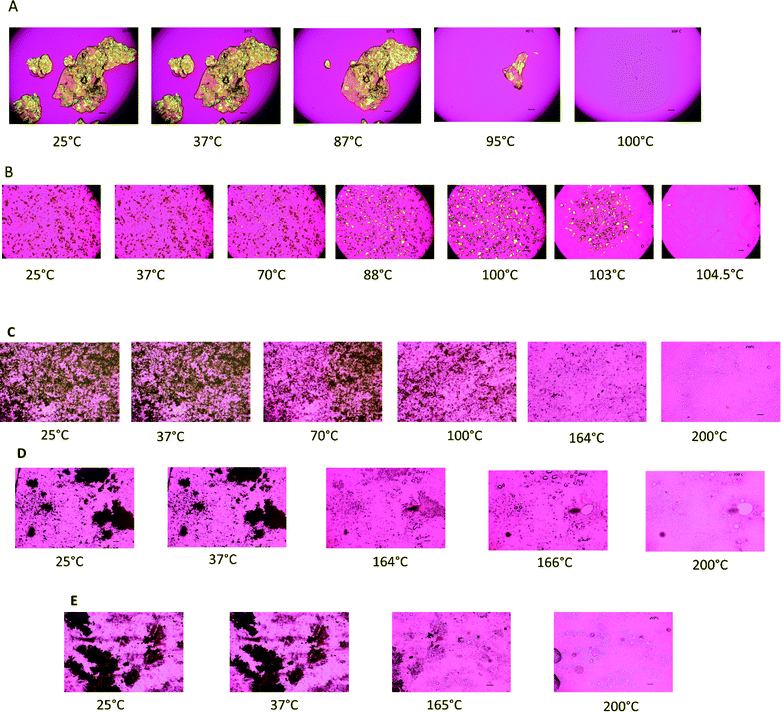
Fig. 6 shows representative images from HSM experiment. All raw samples exhibited birefringence suggestive of crystallinity of the particles. Raw DMF at increasing temperature started melting at about 80 °C and completely melted at 100 °C. However, there was particle growth observed for SD DMF sample from 70–102 °C followed by melting starting at 103.7 °C and completely melted at 104.5 °C. This is an unusual phenomenon observed on heating SD DMF particles, which can be attributed to transition to a different phase. However, this needs further investigation. Raw D-Man and SD D-Man (all pump rates) exhibited one observable transition from solid state to liquid state at temperatures higher than 160 °C. However, different co-SD particles showed thermal events on heating. All low and medium pump rate particles showed one transition from solid state to liquid state at higher temperatures of 160–166 °C. At high pump rate all co-SD samples had two observable thermal events upon heating. One was loss of birefringence which can be described as melting of one component at about 60–70 °C and other melting at 160–164 °C. Additionally, 80![[thin space (1/6-em)]](https://www.rsc.org/images/entities/char_2009.gif) :
:![[thin space (1/6-em)]](https://www.rsc.org/images/entities/char_2009.gif) 20 molar ratio particles at 100% pump rate showed a particle growth similar to SD DMF starting at 70 °C. The thermal activity observed with HSM is comparable with the DSC data, where two peaks were seen at high pump rate and one peak seen at low and medium pump rates.
20 molar ratio particles at 100% pump rate showed a particle growth similar to SD DMF starting at 70 °C. The thermal activity observed with HSM is comparable with the DSC data, where two peaks were seen at high pump rate and one peak seen at low and medium pump rates.
Karl Fisher titration (KFT)
Table 4, shows the residual water content in the raw and spray dried powders. The SD D-Man samples had low water content but higher than raw D-Man. This is similar to previously reported residual water content results of D-mannitol before and after spray drying. It can be noted from the Table 4 that all SD powder samples had residual water content ≤1.50% w/w. These values of residual water content are considered acceptable for inhalation dry powder formulation.| Powder composition (molar ratio) | Spray drying pump rate (%) | Residual water content (% w/w) |
|---|---|---|
| Raw DMF | N/A | 0.26 ± 0.05 |
| Raw D-MAN | N/A | 0.21 ± 0.01 |
| SD DMF | High (100%) | 0.16 ± 0.01 |
Co-SD DMF![[thin space (1/6-em)]](https://www.rsc.org/images/entities/char_2009.gif) : :![[thin space (1/6-em)]](https://www.rsc.org/images/entities/char_2009.gif) D-MAN 90 D-MAN 90![[thin space (1/6-em)]](https://www.rsc.org/images/entities/char_2009.gif) : :![[thin space (1/6-em)]](https://www.rsc.org/images/entities/char_2009.gif) 10 10 |
Low (25%) | 1.36 ± 0.04 |
Co-SD DMF![[thin space (1/6-em)]](https://www.rsc.org/images/entities/char_2009.gif) : :![[thin space (1/6-em)]](https://www.rsc.org/images/entities/char_2009.gif) D-MAN 90 D-MAN 90![[thin space (1/6-em)]](https://www.rsc.org/images/entities/char_2009.gif) : :![[thin space (1/6-em)]](https://www.rsc.org/images/entities/char_2009.gif) 10 10 |
Med (50%) | 1.05 ± 0.05 |
Co-SD DMF![[thin space (1/6-em)]](https://www.rsc.org/images/entities/char_2009.gif) : :![[thin space (1/6-em)]](https://www.rsc.org/images/entities/char_2009.gif) D-MAN 90 D-MAN 90![[thin space (1/6-em)]](https://www.rsc.org/images/entities/char_2009.gif) : :![[thin space (1/6-em)]](https://www.rsc.org/images/entities/char_2009.gif) 10 10 |
High (100%) | 0.37 ± 0.04 |
Co-SD DMF![[thin space (1/6-em)]](https://www.rsc.org/images/entities/char_2009.gif) : :![[thin space (1/6-em)]](https://www.rsc.org/images/entities/char_2009.gif) D-MAN 80 D-MAN 80![[thin space (1/6-em)]](https://www.rsc.org/images/entities/char_2009.gif) : :![[thin space (1/6-em)]](https://www.rsc.org/images/entities/char_2009.gif) 20 20 |
Low (25%) | 1.26 ± 0.07 |
Co-SD DMF![[thin space (1/6-em)]](https://www.rsc.org/images/entities/char_2009.gif) : :![[thin space (1/6-em)]](https://www.rsc.org/images/entities/char_2009.gif) D-MAN 80 D-MAN 80![[thin space (1/6-em)]](https://www.rsc.org/images/entities/char_2009.gif) : :![[thin space (1/6-em)]](https://www.rsc.org/images/entities/char_2009.gif) 20 20 |
Med (50%) | 0.82 ± 0.09 |
Co-SD DMF![[thin space (1/6-em)]](https://www.rsc.org/images/entities/char_2009.gif) : :![[thin space (1/6-em)]](https://www.rsc.org/images/entities/char_2009.gif) D-MAN 80 D-MAN 80![[thin space (1/6-em)]](https://www.rsc.org/images/entities/char_2009.gif) : :![[thin space (1/6-em)]](https://www.rsc.org/images/entities/char_2009.gif) 20 20 |
High (100%) | 0.48 ± 0.08 |
Co-SD DMF![[thin space (1/6-em)]](https://www.rsc.org/images/entities/char_2009.gif) : :![[thin space (1/6-em)]](https://www.rsc.org/images/entities/char_2009.gif) D-MAN 50 D-MAN 50![[thin space (1/6-em)]](https://www.rsc.org/images/entities/char_2009.gif) : :![[thin space (1/6-em)]](https://www.rsc.org/images/entities/char_2009.gif) 50 50 |
Low (25%) | 1.20 ± 0.06 |
Co-SD DMF![[thin space (1/6-em)]](https://www.rsc.org/images/entities/char_2009.gif) : :![[thin space (1/6-em)]](https://www.rsc.org/images/entities/char_2009.gif) D-MAN 50 D-MAN 50![[thin space (1/6-em)]](https://www.rsc.org/images/entities/char_2009.gif) : :![[thin space (1/6-em)]](https://www.rsc.org/images/entities/char_2009.gif) 50 50 |
Med (50%) | 1.49 ± 0.16 |
Co-SD DMF![[thin space (1/6-em)]](https://www.rsc.org/images/entities/char_2009.gif) : :![[thin space (1/6-em)]](https://www.rsc.org/images/entities/char_2009.gif) D-MAN 50 D-MAN 50![[thin space (1/6-em)]](https://www.rsc.org/images/entities/char_2009.gif) : :![[thin space (1/6-em)]](https://www.rsc.org/images/entities/char_2009.gif) 50 50 |
High (100%) | 1.61 ± 0.08 |
| SD D-MAN | Low (25%) | 1.46 ± 0.06 |
| SD D-MAN | Med (50%) | 0.79 ± 0.21 |
| SD D-MAN | High (100%) | 0.98 ± 0.01 |
ATR-FTIR spectroscopy
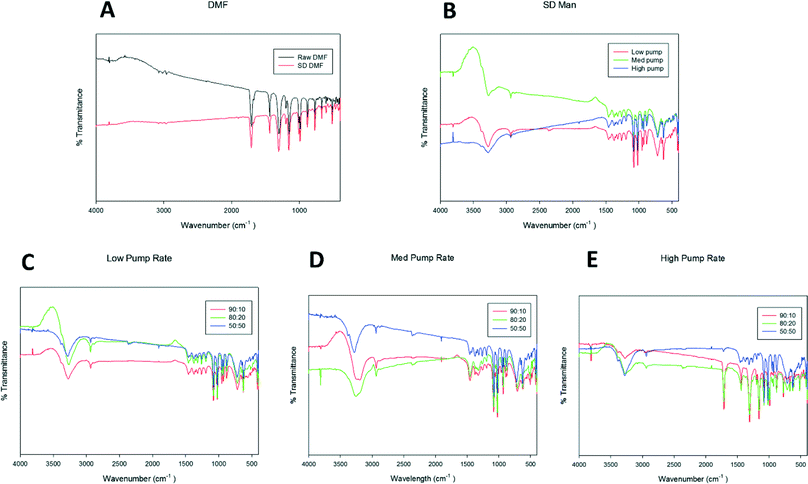
ATR-FTIR spectra in Fig. 7, confirms the presence of the components in the co-SD particles. The spectra of DMF obtained is similar to the spectra reported in Scifinder® and by Lopes et al.49 Co-SD samples at the low and medium spray drying pump rates showed O–H stretching at 3260–3280 cm−1 suggesting H-bonding with D-mannitol. At high pump rate, the spectra are similar to SD DMF. Additionally, 80![[thin space (1/6-em)]](https://www.rsc.org/images/entities/char_2009.gif) :
:![[thin space (1/6-em)]](https://www.rsc.org/images/entities/char_2009.gif) 20 at low and medium samples shows C–H stretch at 2940 cm−1.
20 at low and medium samples shows C–H stretch at 2940 cm−1.
Confocal Raman microspectroscopy (CRM), chemical imaging, & mapping
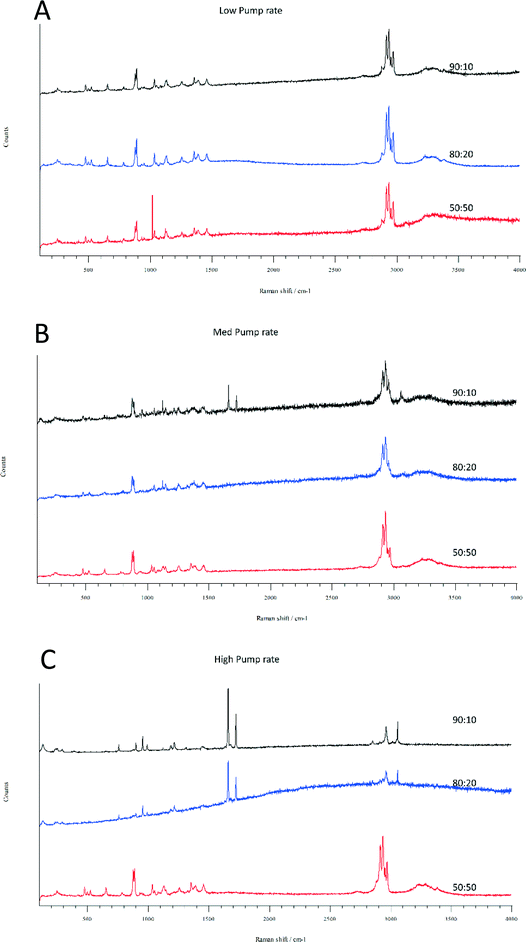
Confocal Raman microscopy analysis was performed to further investigate the physical form and homogeneity of DMF and Man in co-SD particles. A spectral scan from 100–4000 cm−1 was performed on all samples. All the samples exhibited high crystallinity before and after spray drying with or without D-Man. Based on the spectral scan of both the components, Raman shift in the range of 2826–3289 cm−1 was observed during confocal Raman mapping (CRM). In general, the spectral scan and CRM of all samples were in good agreement. As seen in Fig. 8 and 9, the spectral scan of all co-SD samples at low pump rate exhibited Raman shift that was consistent with D-Man. At medium pump rate, 90![[thin space (1/6-em)]](https://www.rsc.org/images/entities/char_2009.gif) :
:![[thin space (1/6-em)]](https://www.rsc.org/images/entities/char_2009.gif) 10 molar ratio sample showed Raman shift of both DMF and D-Man while other samples exhibited only that of D-Man. At high pump rate, co-SD DMF
10 molar ratio sample showed Raman shift of both DMF and D-Man while other samples exhibited only that of D-Man. At high pump rate, co-SD DMF![[thin space (1/6-em)]](https://www.rsc.org/images/entities/char_2009.gif) :
:![[thin space (1/6-em)]](https://www.rsc.org/images/entities/char_2009.gif) D-Man 90
D-Man 90![[thin space (1/6-em)]](https://www.rsc.org/images/entities/char_2009.gif) :
:![[thin space (1/6-em)]](https://www.rsc.org/images/entities/char_2009.gif) 10 and 80
10 and 80![[thin space (1/6-em)]](https://www.rsc.org/images/entities/char_2009.gif) :
:![[thin space (1/6-em)]](https://www.rsc.org/images/entities/char_2009.gif) 20 powders had Raman shift consistent with that of DMF while 50
20 powders had Raman shift consistent with that of DMF while 50![[thin space (1/6-em)]](https://www.rsc.org/images/entities/char_2009.gif) :
:![[thin space (1/6-em)]](https://www.rsc.org/images/entities/char_2009.gif) 50 exhibited that of Man. Interestingly, co-SD DMF
50 exhibited that of Man. Interestingly, co-SD DMF![[thin space (1/6-em)]](https://www.rsc.org/images/entities/char_2009.gif) :
:![[thin space (1/6-em)]](https://www.rsc.org/images/entities/char_2009.gif) D-Man 50
D-Man 50![[thin space (1/6-em)]](https://www.rsc.org/images/entities/char_2009.gif) :
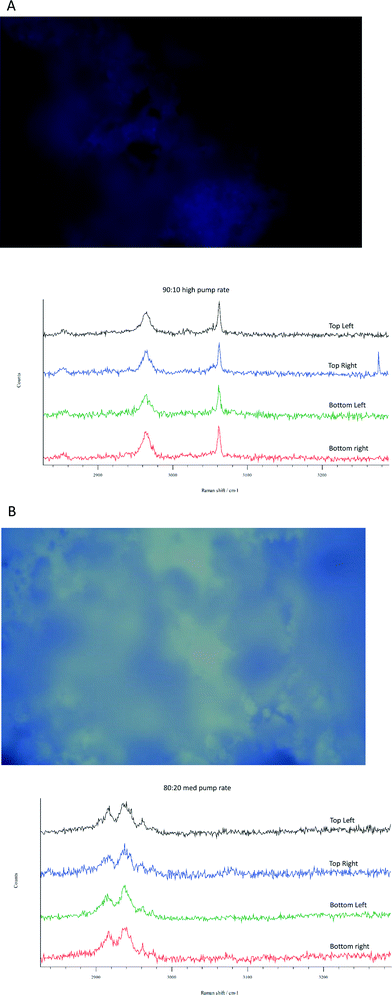
:![[thin space (1/6-em)]](https://www.rsc.org/images/entities/char_2009.gif) 50 powder exhibited Raman spectra similar to that of D-Man. By CRM, all co-spray dried samples (all molar ratios and all pump rates) exhibited homogeneity in their distribution. Fig. 10 shows representative brightfield micrographs obtained at 20× magnification of co-SD samples and the corresponding Raman signal obtained from different regions of the imaged sample. The image represents an area of the powder sample to assess the chemical composition (i.e. molecular fingerprint) and distribution of the components. As can be seen from Fig. 10A and B, the peaks are consistently seen in a given sample suggesting uniform distribution of the components. Fig. 10A exhibits the characteristic peaks corresponding to DMF, while Fig. 10B exhibits the characteristic peaks of D-Man. Raman spectra of co-SD samples at some pump rates showed peaks corresponding to mannitol at different molar ratios suggesting encapsulation of the drug by mannitol.
50 powder exhibited Raman spectra similar to that of D-Man. By CRM, all co-spray dried samples (all molar ratios and all pump rates) exhibited homogeneity in their distribution. Fig. 10 shows representative brightfield micrographs obtained at 20× magnification of co-SD samples and the corresponding Raman signal obtained from different regions of the imaged sample. The image represents an area of the powder sample to assess the chemical composition (i.e. molecular fingerprint) and distribution of the components. As can be seen from Fig. 10A and B, the peaks are consistently seen in a given sample suggesting uniform distribution of the components. Fig. 10A exhibits the characteristic peaks corresponding to DMF, while Fig. 10B exhibits the characteristic peaks of D-Man. Raman spectra of co-SD samples at some pump rates showed peaks corresponding to mannitol at different molar ratios suggesting encapsulation of the drug by mannitol.
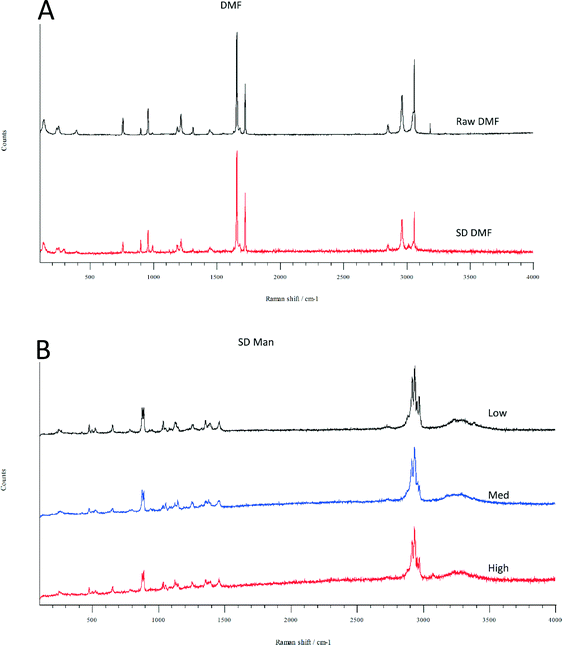 | ||
| Fig. 8 Raman spectra for one-component powders for: (A). raw DMF and SD DMF; and (B). SD D-Man designed at three spray drying pump rates (low, medium, and high). | ||
In vitro aerosol dispersion performance
In vitro aerosol dispersion performance using NGI® revealed that all SD and co-SD systems had high ED values. For most of the co-SD DMF![[thin space (1/6-em)]](https://www.rsc.org/images/entities/char_2009.gif) :
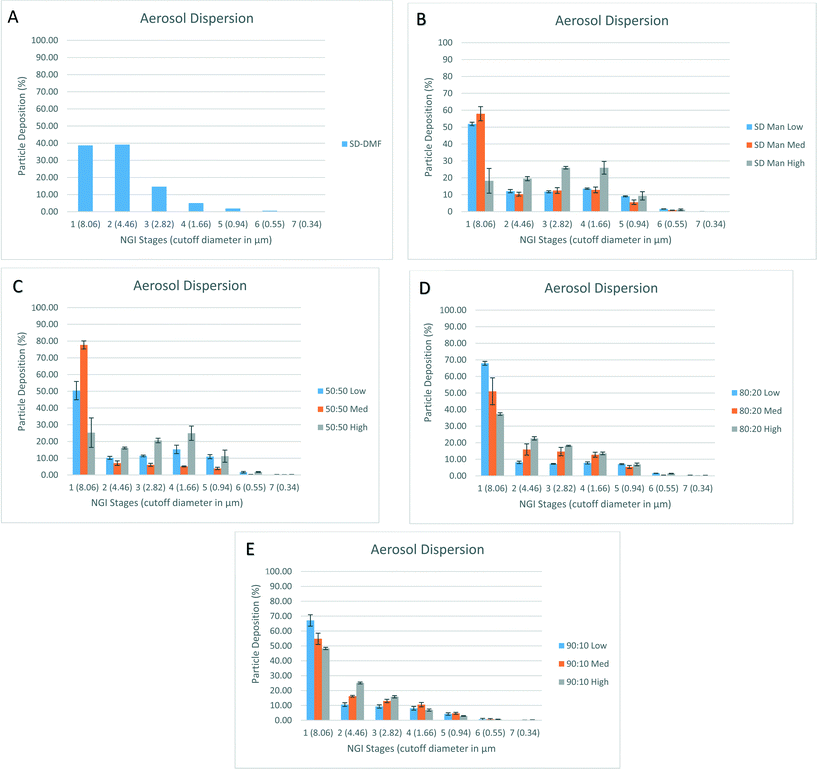
:![[thin space (1/6-em)]](https://www.rsc.org/images/entities/char_2009.gif) D-Man systems, the FPF was improved with the addition of the aerosol performance enhancer, D-Man, compared to the one-component SD DMF powders. Aerosol dispersion of SD DMF alone exhibited higher fraction of particle deposition at the earlier stages (1–3), but inclusion of D-Man had profound effect on the stage deposition. As can be seen from the Fig. 11, co-spray drying DMF with D-Man decreased the deposition on stage 2, but increased the aerosol deposition on stages 1 and 3–6, which include nanoparticles in the solid state. There was no measurable deposition seen on stage 7 for all aerosolized powders.
D-Man systems, the FPF was improved with the addition of the aerosol performance enhancer, D-Man, compared to the one-component SD DMF powders. Aerosol dispersion of SD DMF alone exhibited higher fraction of particle deposition at the earlier stages (1–3), but inclusion of D-Man had profound effect on the stage deposition. As can be seen from the Fig. 11, co-spray drying DMF with D-Man decreased the deposition on stage 2, but increased the aerosol deposition on stages 1 and 3–6, which include nanoparticles in the solid state. There was no measurable deposition seen on stage 7 for all aerosolized powders.
Discussion
To the authors' knowledge, this is the first reported study to successfully design and optimize DPIs of DMF and DMF![[thin space (1/6-em)]](https://www.rsc.org/images/entities/char_2009.gif) :
:![[thin space (1/6-em)]](https://www.rsc.org/images/entities/char_2009.gif) D-Man molecular mixtures by organic solution advanced closed mode spray drying. This study is also the first to have comprehensively characterized DMF for its physicochemical properties in the solid state. The systematic approach in this study included single component SD drug, single component SD excipient (D-Man) and co-SD rationally chosen molar ratios of drug
D-Man molecular mixtures by organic solution advanced closed mode spray drying. This study is also the first to have comprehensively characterized DMF for its physicochemical properties in the solid state. The systematic approach in this study included single component SD drug, single component SD excipient (D-Man) and co-SD rationally chosen molar ratios of drug![[thin space (1/6-em)]](https://www.rsc.org/images/entities/char_2009.gif) :
:![[thin space (1/6-em)]](https://www.rsc.org/images/entities/char_2009.gif) excipient. Particle engineering techniques are often used in inhalation formulation to achieve narrow particle size distribution, small, smooth particles, hollow or encapsulated particles which can be aerosolized without a carrier. Spray drying is the most versatile particle engineering design technology particularly when using dilute organic solutions in closed mode advanced spray drying50 leading to small, spherical and dry particles that can successfully target the lower airways, as reported by us.37,46,47,51–55
excipient. Particle engineering techniques are often used in inhalation formulation to achieve narrow particle size distribution, small, smooth particles, hollow or encapsulated particles which can be aerosolized without a carrier. Spray drying is the most versatile particle engineering design technology particularly when using dilute organic solutions in closed mode advanced spray drying50 leading to small, spherical and dry particles that can successfully target the lower airways, as reported by us.37,46,47,51–55
This study shows that the presence of D-Man in the solution has enabled DMF molecules to be encapsulated into small, spherical particles at lower pump rates while DMF didn't form particles at these pump rates individually. This is likely due to the hydrogen bonding between DMF and D-Man, since D-Man is an H-bond donor and DMF is an H-bond acceptor. In solution polar organic molecules tends to form hydrogen bonded aggregates, these aggregates serve to be the precursor for the crystal of the molecules. SEM micrographs of SD particles has shown diameter <2 μm which is the preferred particle size for targeted delivery to deeper regions of lung. The size and shape of particles determines the forces that the particle will experience during its fluid motion (i.e. aerosolization).56 By targeting in this manner, the dose of the drug that needs to be inhaled can be reduced. This is also the rationale in choosing the DMF![[thin space (1/6-em)]](https://www.rsc.org/images/entities/char_2009.gif) :
:![[thin space (1/6-em)]](https://www.rsc.org/images/entities/char_2009.gif) D-Man molar ratios in this study, where the ratio of Man was not to exceed that of the drug, as high drug loading is desired for DPI delivery. But, in this study the DMF individually and co-SD with D-Man retained its crystallinity and this is evident from DSC, XRPD and Raman analysis. However, the DSC thermograms of co-SD particles showed different miscibility among the components at different pump rates. The single transition observed at low and medium pump rates suggest that the components were homogenous and completely miscible on a molecular level, while two transitions seen at high pump rate suggest molecular heterogeneity such as nanodomains. At low and medium pump rates, the drying process is slower, while at a higher pump rate the drying process is faster. Hence, longer spray drying time during low and medium pump rates can promote miscibility of the components in the solid state. This is verified by the HSM images where melting of two components sequentially was noticed at only high pump rate.
D-Man molar ratios in this study, where the ratio of Man was not to exceed that of the drug, as high drug loading is desired for DPI delivery. But, in this study the DMF individually and co-SD with D-Man retained its crystallinity and this is evident from DSC, XRPD and Raman analysis. However, the DSC thermograms of co-SD particles showed different miscibility among the components at different pump rates. The single transition observed at low and medium pump rates suggest that the components were homogenous and completely miscible on a molecular level, while two transitions seen at high pump rate suggest molecular heterogeneity such as nanodomains. At low and medium pump rates, the drying process is slower, while at a higher pump rate the drying process is faster. Hence, longer spray drying time during low and medium pump rates can promote miscibility of the components in the solid state. This is verified by the HSM images where melting of two components sequentially was noticed at only high pump rate.
This can be due to the favorable H-bonding of the two components at lower pump rates as seen from ATR-FTIR analysis. DMF is a symmetrical molecule that can exist in several different isomeric forms. The most stable conformer is reported to have both ester groups in cis orientation with respect to the C![[double bond, length as m-dash]](https://www.rsc.org/images/entities/char_e001.gif) C bond.49 The energy difference seen in DSC can be due to the conformational changes of the molecule at that pump rate. All thermal analysis confirmed the stability of the particles at room temperature and biological temperature. However, the particle growth observed in HSM of SD DMF at higher temperature needs further investigation. Dry powder aerosol particles are not expected to be exposed to higher temperatures (70 °C or higher), hence the investigation is reserved for future study. The crystalline nature of the SD particles was further verified by the low residual water content of all the particles. The crystallinity of the particle with low water content can lead to increased physical and chemical stability of the powder for a prolonged period of time. Crystalline compounds possess less molecular mobility which leads to decreased reactivity, hence increased physical and chemical stability. Additionally, decreased residual water can lead to better aerosol dispersion performance.
C bond.49 The energy difference seen in DSC can be due to the conformational changes of the molecule at that pump rate. All thermal analysis confirmed the stability of the particles at room temperature and biological temperature. However, the particle growth observed in HSM of SD DMF at higher temperature needs further investigation. Dry powder aerosol particles are not expected to be exposed to higher temperatures (70 °C or higher), hence the investigation is reserved for future study. The crystalline nature of the SD particles was further verified by the low residual water content of all the particles. The crystallinity of the particle with low water content can lead to increased physical and chemical stability of the powder for a prolonged period of time. Crystalline compounds possess less molecular mobility which leads to decreased reactivity, hence increased physical and chemical stability. Additionally, decreased residual water can lead to better aerosol dispersion performance.
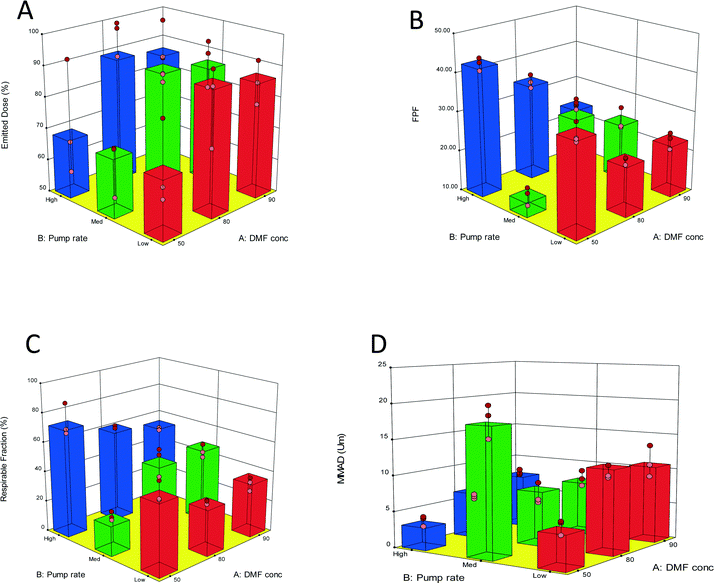
The in vitro aerosol performance of the spray dried and co-SD systems are tabulated in Table 5 and the influence of pump rate and D-Man concentration is presented in 3-D surface response plots (DesignExpert®) in Fig. 12. Co-SD 50![[thin space (1/6-em)]](https://www.rsc.org/images/entities/char_2009.gif) :
:![[thin space (1/6-em)]](https://www.rsc.org/images/entities/char_2009.gif) 50 system, high pump rate had the highest EDF, FPF and RF and minimum MMAD, followed by low pump rate and medium pump. Co-SD 80
50 system, high pump rate had the highest EDF, FPF and RF and minimum MMAD, followed by low pump rate and medium pump. Co-SD 80![[thin space (1/6-em)]](https://www.rsc.org/images/entities/char_2009.gif) :
:![[thin space (1/6-em)]](https://www.rsc.org/images/entities/char_2009.gif) 20 system, exhibited a trend as can been seen in Fig. 12, where EDF,FPF and RF increased as the pump rate increased and MMAD decreased as the pump rate decreased. Co-SD 90
20 system, exhibited a trend as can been seen in Fig. 12, where EDF,FPF and RF increased as the pump rate increased and MMAD decreased as the pump rate decreased. Co-SD 90![[thin space (1/6-em)]](https://www.rsc.org/images/entities/char_2009.gif) :
:![[thin space (1/6-em)]](https://www.rsc.org/images/entities/char_2009.gif) 10, low pump rate showed lower EDF, FPF, and RF and higher MMAD compared to other two pump rates. However, the performance values of medium and high pump rates are comparable. Similar to 50
10, low pump rate showed lower EDF, FPF, and RF and higher MMAD compared to other two pump rates. However, the performance values of medium and high pump rates are comparable. Similar to 50![[thin space (1/6-em)]](https://www.rsc.org/images/entities/char_2009.gif) :
:![[thin space (1/6-em)]](https://www.rsc.org/images/entities/char_2009.gif) 50 co-SD system, SD D-Man high pump rate had the highest EDF, FPF and RF and minimum MMAD, followed by low pump rate and medium pump.
50 co-SD system, SD D-Man high pump rate had the highest EDF, FPF and RF and minimum MMAD, followed by low pump rate and medium pump.
| Powder formulation composition (molar ratio) | Spray drying pump rate (%) | Emitted dose (%) | Fine particle fraction (%) | Respirable fraction (%) | MMAD (μm) | GSD |
|---|---|---|---|---|---|---|
| SD DMF | High (100%) | 85.18 ± 5.51 | 17.07 ± 4.72 | 61.28 ± 21.61 | 7.59 ± 1.55 | 1.89 ± 0.16 |
| SD D-MAN | Low (25%) | 89.57 ± 4.05 | 29.56 ± 3.83 | 43.26 ± 6.02 | 7.24 ± 1.68 | 2.81 ± 0.20 |
| SD D-MAN | Med (50%) | 81.55 ± 8.59 | 26.34 ± 3.46 | 37.60 ± 4.28 | 8.56 ± 1.34 | 2.84 ± 0.18 |
| SD D-MAN | High (100%) | 85.89 ± 10.38 | 49.46 ± 6.93 | 76.15 ± 6.01 | 3.89 ± 0.34 | 1.98 ± 0.32 |
DMF![[thin space (1/6-em)]](https://www.rsc.org/images/entities/char_2009.gif) : :![[thin space (1/6-em)]](https://www.rsc.org/images/entities/char_2009.gif) D-MAN 50 D-MAN 50![[thin space (1/6-em)]](https://www.rsc.org/images/entities/char_2009.gif) : :![[thin space (1/6-em)]](https://www.rsc.org/images/entities/char_2009.gif) 50 50 |
Low (25%) | 69.60 ± 10.52 | 33.63 ± 2.06 | 49.59 ± 5.47 | 5.32 ± 0.81 | 2.59 ± 0.15 |
DMF![[thin space (1/6-em)]](https://www.rsc.org/images/entities/char_2009.gif) : :![[thin space (1/6-em)]](https://www.rsc.org/images/entities/char_2009.gif) D-MAN 50 D-MAN 50![[thin space (1/6-em)]](https://www.rsc.org/images/entities/char_2009.gif) : :![[thin space (1/6-em)]](https://www.rsc.org/images/entities/char_2009.gif) 50 50 |
Med (50%) | 64.59 ± 7.35 | 13.64 ± 1.94 | 22.33 ± 2.41 | 18.36 ± 1.87 | 3.73 ± 0.18 |
DMF![[thin space (1/6-em)]](https://www.rsc.org/images/entities/char_2009.gif) : :![[thin space (1/6-em)]](https://www.rsc.org/images/entities/char_2009.gif) D-MAN 50 D-MAN 50![[thin space (1/6-em)]](https://www.rsc.org/images/entities/char_2009.gif) : :![[thin space (1/6-em)]](https://www.rsc.org/images/entities/char_2009.gif) 50 50 |
High (100%) | 71.64 ± 15.20 | 42.56 ± 1.32 | 74.73 ± 8.82 | 3.67 ± 0.59 | 2.01 ± 0.13 |
DMF![[thin space (1/6-em)]](https://www.rsc.org/images/entities/char_2009.gif) : :![[thin space (1/6-em)]](https://www.rsc.org/images/entities/char_2009.gif) D-MAN 80 D-MAN 80![[thin space (1/6-em)]](https://www.rsc.org/images/entities/char_2009.gif) : :![[thin space (1/6-em)]](https://www.rsc.org/images/entities/char_2009.gif) 20 20 |
Low (25%) | 84.08 ± 10.30 | 22.63 ± 0.82 | 32.10 ± 1.19 | 10.92 ± 0.74 | 3.69 ± 0.18 |
DMF![[thin space (1/6-em)]](https://www.rsc.org/images/entities/char_2009.gif) : :![[thin space (1/6-em)]](https://www.rsc.org/images/entities/char_2009.gif) D-MAN 80 D-MAN 80![[thin space (1/6-em)]](https://www.rsc.org/images/entities/char_2009.gif) : :![[thin space (1/6-em)]](https://www.rsc.org/images/entities/char_2009.gif) 20 20 |
Med (50%) | 88.70 ± 3.10 | 29.82 ± 4.53 | 48.96 ± 8.11 | 6.86 ± 1.25 | 2.46 ± 0.17 |
DMF![[thin space (1/6-em)]](https://www.rsc.org/images/entities/char_2009.gif) : :![[thin space (1/6-em)]](https://www.rsc.org/images/entities/char_2009.gif) D-MAN 80 D-MAN 80![[thin space (1/6-em)]](https://www.rsc.org/images/entities/char_2009.gif) : :![[thin space (1/6-em)]](https://www.rsc.org/images/entities/char_2009.gif) 20 20 |
High (100%) | 95.66 ± 4.69 | 34.48 ± 1.42 | 62.70 ± 0.81 | 5.56 ± 0.26 | 2.38 ± 0.05 |
DMF![[thin space (1/6-em)]](https://www.rsc.org/images/entities/char_2009.gif) : :![[thin space (1/6-em)]](https://www.rsc.org/images/entities/char_2009.gif) D-MAN 90 D-MAN 90![[thin space (1/6-em)]](https://www.rsc.org/images/entities/char_2009.gif) : :![[thin space (1/6-em)]](https://www.rsc.org/images/entities/char_2009.gif) 10 10 |
Low (25%) | 85.17 ± 5.61 | 23.15 ± 1.76 | 32.89 ± 3.83 | 11.15 ± 1.84 | 3.09 ± 0.15 |
DMF![[thin space (1/6-em)]](https://www.rsc.org/images/entities/char_2009.gif) : :![[thin space (1/6-em)]](https://www.rsc.org/images/entities/char_2009.gif) D-MAN 90 D-MAN 90![[thin space (1/6-em)]](https://www.rsc.org/images/entities/char_2009.gif) : :![[thin space (1/6-em)]](https://www.rsc.org/images/entities/char_2009.gif) 10 10 |
Med (50%) | 87.74 ± 6.30 | 24.12 ± 2.43 | 45.23 ± 3.79 | 7.85 ± 0.92 | 2.65 ± 0.14 |
DMF![[thin space (1/6-em)]](https://www.rsc.org/images/entities/char_2009.gif) : :![[thin space (1/6-em)]](https://www.rsc.org/images/entities/char_2009.gif) D-MAN 90 D-MAN 90![[thin space (1/6-em)]](https://www.rsc.org/images/entities/char_2009.gif) : :![[thin space (1/6-em)]](https://www.rsc.org/images/entities/char_2009.gif) 10 10 |
High (100%) | 87.01 ± 7.58 | 24.15 ± 0.83 | 51.70 ± 0.77 | 7.86 ± 0.33 | 2.34 ± 0.07 |
Compared to single component SD DMF, the emitted dose fraction was increased only in some of the systems with increased DMF concentration and higher pump rate (80![[thin space (1/6-em)]](https://www.rsc.org/images/entities/char_2009.gif) :
:![[thin space (1/6-em)]](https://www.rsc.org/images/entities/char_2009.gif) 20 50%, 80
20 50%, 80![[thin space (1/6-em)]](https://www.rsc.org/images/entities/char_2009.gif) :
:![[thin space (1/6-em)]](https://www.rsc.org/images/entities/char_2009.gif) 20 100% and all pump rates of 90
20 100% and all pump rates of 90![[thin space (1/6-em)]](https://www.rsc.org/images/entities/char_2009.gif) :
:![[thin space (1/6-em)]](https://www.rsc.org/images/entities/char_2009.gif) 10 ratio). Except, 50
10 ratio). Except, 50![[thin space (1/6-em)]](https://www.rsc.org/images/entities/char_2009.gif) :
:![[thin space (1/6-em)]](https://www.rsc.org/images/entities/char_2009.gif) 50 ratio at 50% pump rate all other co-SD systems had increased FPF. However, RF of particles wasn't increased in systems other than 50
50 ratio at 50% pump rate all other co-SD systems had increased FPF. However, RF of particles wasn't increased in systems other than 50![[thin space (1/6-em)]](https://www.rsc.org/images/entities/char_2009.gif) :
:![[thin space (1/6-em)]](https://www.rsc.org/images/entities/char_2009.gif) 50 100% and 80
50 100% and 80![[thin space (1/6-em)]](https://www.rsc.org/images/entities/char_2009.gif) :
:![[thin space (1/6-em)]](https://www.rsc.org/images/entities/char_2009.gif) 20 100%. Some co-SD systems decreased the MMAD while others had increased value. All ratios at 100% pump rate had lower or comparable MMAD to single component SD-DMF. At 25% pump rate only 50
20 100%. Some co-SD systems decreased the MMAD while others had increased value. All ratios at 100% pump rate had lower or comparable MMAD to single component SD-DMF. At 25% pump rate only 50![[thin space (1/6-em)]](https://www.rsc.org/images/entities/char_2009.gif) :
:![[thin space (1/6-em)]](https://www.rsc.org/images/entities/char_2009.gif) 50 molar ratio co-SD system had MMAD less than SD-DMF. At 50% molar ratios with lower mannitol (80
50 molar ratio co-SD system had MMAD less than SD-DMF. At 50% molar ratios with lower mannitol (80![[thin space (1/6-em)]](https://www.rsc.org/images/entities/char_2009.gif) :
:![[thin space (1/6-em)]](https://www.rsc.org/images/entities/char_2009.gif) 20 and 90
20 and 90![[thin space (1/6-em)]](https://www.rsc.org/images/entities/char_2009.gif) :
:![[thin space (1/6-em)]](https://www.rsc.org/images/entities/char_2009.gif) 10) had MMAD less than or comparable to SD-DMF. The effect of pump rate and different concentration of mannitol was studied using the 3-D surface response graphs (Fig. 12) generated from Design Expert® software. Overall, 50
10) had MMAD less than or comparable to SD-DMF. The effect of pump rate and different concentration of mannitol was studied using the 3-D surface response graphs (Fig. 12) generated from Design Expert® software. Overall, 50![[thin space (1/6-em)]](https://www.rsc.org/images/entities/char_2009.gif) :
:![[thin space (1/6-em)]](https://www.rsc.org/images/entities/char_2009.gif) 50 molar ratio at 100% pump rate had the highest FPF, RF and lowest MMAD which may be due to the presence of D-Man, because at 100% pump rate SD D-Man at 100% pump rate had similar characteristics. However, ED was highest at 80
50 molar ratio at 100% pump rate had the highest FPF, RF and lowest MMAD which may be due to the presence of D-Man, because at 100% pump rate SD D-Man at 100% pump rate had similar characteristics. However, ED was highest at 80![[thin space (1/6-em)]](https://www.rsc.org/images/entities/char_2009.gif) :
:![[thin space (1/6-em)]](https://www.rsc.org/images/entities/char_2009.gif) 20 high pump rate and GSD lowest of single component SD DMF.
20 high pump rate and GSD lowest of single component SD DMF.
The aerosol stage deposition in Fig. 11, demonstrated using NGI and Handihaler device indicate that the formulation possess the capability to reach lower airways of the lung. The deposition of the aerosol particles at this region is characterized by sedimentation and Brownian diffusion in addition to the low air velocity.57 Inflammatory diseases such as asthma and COPD are characterized by airway remodeling and the pathological process involves both larger and smaller airways. However the difference between these two diseases lie in the cells that are involved in the process. In COPD, CD8+, T-lymphocytes and macrophages are the predominant cells involved.58 Hence, targeted delivery of DMF to this respiratory region will be advantageous in targeting the underlying mechanisms giving rise to pulmonary inflammation because it possesses both anti-inflammatory and anti-oxidant properties. Additionally, the hydrophobicity of DMF would be expected to increase drug residence time in the lungs due to favorable hydrophobic interactions with lung cellular membranes. This, in turn, would be expected to decrease dosing frequency administration of the drug. DMF hydrophobicity would also be expected to minimize drug translocation out of the lung, thereby decreasing systemic side effects.
Conclusions
This systematic and comprehensive study reports for the first time on the successful design of advanced inhalable dry powders containing DMF, a first-in-class Nrf2 activator drug to treat pulmonary inflammation, using advanced particle engineering design technology for targeted delivery to the lungs as advanced spray dried one-component DPIs. In addition, two-component co-spray dried (co-SD) DMF![[thin space (1/6-em)]](https://www.rsc.org/images/entities/char_2009.gif) :
:![[thin space (1/6-em)]](https://www.rsc.org/images/entities/char_2009.gif) D-Man DPIs with high drug loading were successfully designed for targeted lung delivery as advanced DPIs using organic solution advanced spray drying in closed mode. Regional targeted deposition using in vitro predictive lung modeling based on aerodynamic properties was tailored based on composition and spray drying parameters. These findings indicate the significant potential of using D-Man in spray drying to improve particle formation and aerosol performance of small molecule with a relatively low melting point. These respirable microparticles/nanoparticles in the solid-state exhibited excellent aerosol dispersion performance with a human DPI device. Using in vitro predictive lung deposition modeling, the aerosol deposition patterns of these particles show the capability to reach lower airways to treat inflammation in this region in pulmonary diseases such as ALI/ARDS, COPD, PH, and pulmonary endothelial disease.
D-Man DPIs with high drug loading were successfully designed for targeted lung delivery as advanced DPIs using organic solution advanced spray drying in closed mode. Regional targeted deposition using in vitro predictive lung modeling based on aerodynamic properties was tailored based on composition and spray drying parameters. These findings indicate the significant potential of using D-Man in spray drying to improve particle formation and aerosol performance of small molecule with a relatively low melting point. These respirable microparticles/nanoparticles in the solid-state exhibited excellent aerosol dispersion performance with a human DPI device. Using in vitro predictive lung deposition modeling, the aerosol deposition patterns of these particles show the capability to reach lower airways to treat inflammation in this region in pulmonary diseases such as ALI/ARDS, COPD, PH, and pulmonary endothelial disease.
Acknowledgements
The authors sincerely thank Professor Shyam Biswal at The Johns Hopkins University Bloomberg School of Public Health for very helpful discussions and insights into DMF and Nrf2 mechanisms in the lungs. The authors gratefully acknowledge financial support from the College of Pharmacy graduate student fellowship awarded to PM. This work was partially supported by the NIH NIAID (subaward to HMM, PI at The UA). The authors thank Dr. Brooke Beam Masani (SEM), Dr. Sue Roberts (XRPD) at the KECK imaging facility, Dr. Paul Wallace (Raman) at USIF and Dr. Chad Park (ATR-FTIR) at The University of Arizona for access to core facilities. PM thanks Mr. Sriram Srinivasan for his assistance.References
- P. Muralidharan, D. Hayes, Jr. and H. M. Mansour, Expert Opin. Drug Delivery, 2015, 12, 947–962 CrossRef CAS PubMed.
- N. Angelis, K. Porpodis, P. Zarogoulidis, D. Spyratos, I. Kioumis, A. Papaiwannou, G. Pitsiou, K. Tsakiridis, A. Mpakas, S. Arikas, T. Tsiouda, N. Katsikogiannis, I. Kougioumtzi, N. Machairiotis, M. Argyriou, G. Kessisis and K. Zarogoulidis, J. Thorac. Dis., 2014, 6(Suppl 1), S167–172 Search PubMed.
- M. Anna, Asthma in Focus, Pharmaceutical Press/ RPS publishing, London, UK, 2007 Search PubMed.
- A. S. Buist, Eur. Respir. J., 2003,(Supplement 39), 30s–35s CrossRef CAS.
- R. M. Pascual and S. P. Peters, in Asthma and COPD: basic mechanisms and clinical management, ed. P. J. Barnes, J. M. Drazen, S. I. Rennard and N. C. Thomson, Academic Press/Elsevier, San Diego, CA, USA, 2009, pp. 763–774 Search PubMed.
- P. Seidel, I. Merfort, J. M. Hughes, B. G. Oliver, M. Tamm and M. Roth, Am. J. Physiol., 2009, 297, L326–339 CAS.
- V. M. Reddy, B. Meyrick, J. Wong, A. Khoor, J. R. Liddicoat, F. L. Hanley and J. R. Fineman, Circulation, 1995, 92, 606–613 CrossRef CAS PubMed.
- S. Fratz, J. R. Fineman, A. Gorlach, S. Sharma, P. Oishi, C. Schreiber, T. Kietzmann, I. Adatia, J. Hess and S. M. Black, Circulation, 2011, 123, 916–923 CrossRef PubMed.
- R. M. Tuder, B. Groves, D. B. Badesch and N. F. Voelkel, Am. J. Pathol., 1994, 144, 275–285 CAS.
- S. Hall, P. Brogan, S. G. Haworth and N. Klein, Thorax, 2009, 64, 778–783 CrossRef CAS PubMed.
- L. A. Shimoda and S. S. Laurie, J. Appl. Physiol., 2014, 116, 867–874 CrossRef CAS PubMed.
- S. Sharma, S. Kumar, N. Sud, D. A. Wiseman, J. Tian, I. Rehmani, S. Datar, P. Oishi, S. Fratz, R. C. Venema, J. R. Fineman and S. M. Black, Vasc. Pharmacol., 2009, 51, 359–364 CrossRef CAS PubMed.
- L. A. Gabrielli, P. F. Castro, I. Godoy, R. Mellado, R. C. Bourge, H. Alcaino, M. Chiong, D. Greig, H. E. Verdejo, M. Navarro, R. Lopez, B. Toro, C. Quiroga, G. Diaz-Araya, S. Lavandero and L. Garcia, J. Card. Failure, 2011, 17, 1012–1017 CrossRef CAS PubMed.
- F. Fresquet, F. Pourageaud, V. Leblais, R. P. Brandes and J. P. Savineau, R. Marthan and B. Muller, Br. J. Pharmacol., 2006, 148, 714–723 CrossRef CAS PubMed.
- A. L. Firth, K. H. Yuill and S. V. Smirnov, Am. J. Physiol., 2008, 295, L61–70 CAS.
- P. Seidel and M. Roth, Mediators Inflammation, 2013, 2013, 875403 Search PubMed.
- S. Biswal, R. K. Thimmulappa and C. J. Harvey, Proc. Am. Thorac. Soc., 2012, 9, 47–51 CrossRef CAS PubMed.
- M. Meissner, E. M. Valesky, S. Kippenberger and R. Kaufmann, J. Dtsch. Dermatol. Ges., 2012, 10, 793–801 Search PubMed.
- C. M. Ha, S. Park, Y. K. Choi, J. Y. Jeong, C. J. Oh, K. H. Bae, S. J. Lee, J. H. Kim, K. G. Park, Y. Jun do and I. K. Lee, Vasc. Pharmacol., 2014, 63, 29–36 CrossRef CAS PubMed.
- C. J. Oh, J. Y. Kim, Y. K. Choi, H. J. Kim, J. Y. Jeong, K. H. Bae, K. G. Park and I. K. Lee, PLoS One, 2012, 7, e45870 CAS.
- L. Robles, N. D. Vaziri, S. Li, C. Takasu, Y. Masuda, K. Vo, S. H. Farzaneh, M. J. Stamos and H. Ichii, Pancreas, 2015, 44, 441–447 CAS.
- L. Robles, N. D. Vaziri, S. Li, Y. Masuda, C. Takasu, M. Takasu, K. Vo, S. H. Farzaneh, M. J. Stamos and H. Ichii, PLoS One, 2014, 9, e107111 Search PubMed.
- R. Bomprezzi, Ther. Adv. Neurol. Disord., 2015, 8, 20–30 CrossRef PubMed.
- N. Lounsbury, G. Mateo, B. Jones, S. Papaiahgari, R. K. Thimmulappa, C. Teijaro, J. Gordon, K. Korzekwa, M. Ye, G. Allaway, M. Abou-Gharbia, S. Biswal and W. Childers, Jr., Bioorg. Med. Chem., 2015, 23, 5352–5359 CrossRef CAS PubMed.
- N. M. Reddy, H. R. Potteti, T. J. Mariani, S. Biswal and S. P. Reddy, Am. J. Respir. Cell Mol. Biol., 2011, 45, 1161–1168 CrossRef CAS PubMed.
- H. Wilms, J. Sievers, U. Rickert, M. Rostami-Yazdi, U. Mrowietz and R. Lucius, J. Neuroinflammation, 2010, 7, 30 CrossRef PubMed.
- P. Seidel, S. Goulet, K. Hostettler, M. Tamm and M. Roth, Respir. Res., 2010, 11, 145 CrossRef PubMed.
- C. J. Harvey, R. K. Thimmulappa, S. Sethi, X. Kong, L. Yarmus, R. H. Brown, D. Feller-Kopman, R. Wise and S. Biswal, Sci. Transl. Med., 2011, 3, 78ra32 Search PubMed.
- X. L. Chen, S. E. Varner, A. S. Rao, J. Y. Grey, S. Thomas, C. K. Cook, M. A. Wasserman, R. M. Medford, A. K. Jaiswal and C. Kunsch, J. Biol. Chem., 2003, 278, 703–711 CrossRef CAS PubMed.
- T. Hosoya, A. Maruyama, M. I. Kang, Y. Kawatani, T. Shibata, K. Uchida, E. Warabi and N. Noguchi, K. Itoh and M. Yamamoto, J. Biol. Chem., 2005, 280, 27244–27250 CrossRef CAS PubMed.
- X. Cheng, R. C. Siow and G. E. Mann, Antioxid. Redox Signaling, 2011, 14, 469–487 CrossRef CAS PubMed.
- S. C. Lo and M. Hannink, Exp. Cell Res., 2008, 314, 1789–1803 CrossRef CAS PubMed.
- S. Sharma, X. Sun, R. Rafikov, S. Kumar, Y. Hou, P. E. Oishi, S. A. Datar, G. Raff, J. R. Fineman and S. M. Black, PLoS One, 2012, 7, e41555 CAS.
- X. Sun, S. Kumar, S. Sharma, S. Aggarwal, Q. Lu, C. Gross, O. Rafikova, S. G. Lee, S. Dasarathy, Y. Hou, M. L. Meadows, W. Han, Y. Su, J. R. Fineman and S. M. Black, Am. J. Respir. Cell Mol. Biol., 2014, 50, 1084–1095 CrossRef PubMed.
- X. Sun, S. Sharma, S. Fratz, S. Kumar, R. Rafikov, S. Aggarwal, O. Rafikova, Q. Lu, T. Burns, S. Dasarathy, J. Wright, C. Schreiber, M. Radman, J. R. Fineman and S. M. Black, Antioxid. Redox Signaling, 2013, 18, 1739–1752 CrossRef CAS PubMed.
- M. C. Jaramillo and D. D. Zhang, Genes Dev., 2013, 27, 2179–2191 CrossRef CAS PubMed.
- J. Duan, F. G. Vogt, X. Li, D. Hayes, Jr. and H. M. Mansour, Int. J. Nanomed., 2013, 8, 3489–3505 Search PubMed.
- S. A. Meenach, K. W. Anderson, J. Zach Hilt, R. C. McGarry and H. M. Mansour, Eur. J. Pharm. Sci., 2013, 49, 699–711 CrossRef CAS PubMed.
- S. A. Meenach, F. G. Vogt, K. W. Anderson, J. Z. Hilt, R. C. McGarry and H. M. Mansour, Int. J. Nanomed., 2013, 8, 275–293 Search PubMed.
- L. Willis, D. Hayes, Jr. and H. M. Mansour, Lung, 2012, 190, 251–262 CrossRef CAS PubMed.
- X. Wu, O. O. Adedoyin and H. M. Mansour, Anti-Inflammatory Anti-Allergy Agents Med. Chem., 2011, 10, 215–229 CrossRef CAS.
- J. Ahmad, S. Akhter, M. Rizwanullah, S. Amin, M. Rahman, M. Z. Ahmad, M. A. Rizvi, M. A. Kamal and F. J. Ahmad, Nanotechnol., Sci. Appl., 2015, 8, 55–66 Search PubMed.
- U. Ikoba, H. Peng, H. Li, C. Miller, C. Yu and Q. Wang, Nanoscale, 2015, 7, 4291–4305 RSC.
- F. Jia, X. Liu, L. Li, S. Mallapragada, B. Narasimhan and Q. Wang, J. Controlled Release, 2013, 172, 1020–1034 CrossRef CAS PubMed.
- H. M. Mansour, Y. S. Rhee and X. Wu, Int. J. Nanomed., 2009, 4, 299–319 CrossRef CAS.
- X. Li, F. G. Vogt, D. Hayes, Jr. and H. M. Mansour, J. Aerosol Med. Pulm. Drug Delivery, 2014, 27, 81–93 CrossRef CAS PubMed.
- X. Li, F. G. Vogt, D. Hayes, Jr. and H. M. Mansour, J. Pharm. Sci., 2014, 103, 2937–2949 CrossRef CAS PubMed.
- S. A. Meenach, K. W. Anderson, J. Z. Hilt, R. C. McGarry and H. M. Mansour, AAPS PharmSciTech, 2014, 15, 1574–1587 CrossRef CAS PubMed.
- S. Lopes, L. Lapinski and R. Fausto, Phys. Chem. Chem. Phys., 2002, 4, 3965–3974 RSC.
- P. Muralidharan, M. Malapit, E. Mallory, D. Hayes, Jr. and H. M. Mansour, Nanomedicine, 2015, 11, 1189–1199 CAS.
- X. Li and H. M. Mansour, AAPS PharmSciTech, 2011, 12, 1420–1430 CrossRef CAS PubMed.
- X. Li, F. G. Vogt, D. Hayes, Jr. and H. M. Mansour, Eur. J. Pharm. Sci., 2014, 52, 191–205 CrossRef CAS PubMed.
- C. W. Park, X. Li, F. G. Vogt, D. Hayes, Jr., J. B. Zwischenberger, E. S. Park and H. M. Mansour, Int. J. Pharm., 2013, 455, 374–392 CrossRef CAS PubMed.
- N. A. Stocke, S. A. Meenach, S. M. Arnold, H. M. Mansour and J. Z. Hilt, Int. J. Pharm., 2015, 479, 320–328 CrossRef CAS PubMed.
- X. Wu, D. Hayes, Jr., J. B. Zwischenberger, R. J. Kuhn and H. M. Mansour, Drug Des., Dev. Ther., 2013, 7, 59–72 CAS.
- R. Vehring, Pharm. Res., 2008, 25, 999–1022 CrossRef CAS PubMed.
- S. Suarez and A. J. Hickey, Respir. Care, 2000, 45, 652–666 CAS.
- K. Aoshiba and A. Nagai, Clin. Rev. Allergy Immunol., 2004, 27, 35–43 CrossRef CAS PubMed.
| This journal is © The Royal Society of Chemistry 2016 |

