DOI:
10.1039/D2YA00309K
(Paper)
Energy Adv., 2023,
2, 137-147
Cation synergy in Sr and Al substituted LaMnO3 during solar thermochemical CO2 splitting†
Received
9th November 2022
, Accepted 1st December 2022
First published on 2nd December 2022
Abstract
Perovskites (ABO3) constitute an important category of oxygen carriers for applications in thermochemical redox processes. This study aims to derive the relationship of cation dependent parameters including the tolerance factor (τ), critical radius (Rc), free volume (VF), electronegativity (χ), and metal–oxygen bond energy (λ) with O2/CO evolution efficiencies during redox steps of LaxSr1−xMnyAl1−yO3 (x = 0.4, 0.5, and 0.6 and y = 0.4, 0.5, 0.6, and 0.75) perovskite series. Such parameters can reflect the lattice structural variations and bond polarity in these materials. The observed trends of O2/CO evolution are nearly reversed, with regard to the variations in cation constitution. Inconclusive correlations were observed for τ, Rc, and VF during reduction and re-oxidation, indicating that the role of these parameters in representing the observed redox behaviour is limited. In contrast, the cation electronegativities and metal–oxygen bond energies were found to induce a significant impact in depicting the redox chemistry of these materials. Rather than the individual effects, the entire cationic constituents are found to synergistically influence the reduction and re-oxidation reactions of the oxygen carriers used in this study. Direct relationships are observed for the calculated values of both χ and λ with the experimentally derived O2/CO evolution. The outcomes of this study can possibly influence the design of oxygen carriers with an improved performance in thermochemical processes for converting CO2 and utilizing solar energy.
1. Introduction
Environmentally friendly energy technologies are strongly desired either to diminish or to totally eliminate the dependence on fossil derived fuels. Redox processes involving chemical reactions taking place in separate reduction/oxidation steps at high temperatures offer tremendous potential in this regard.1–3 One such process receiving considerable attention is related to the thermochemical splitting of CO2/H2O over metal oxide oxygen carriers, utilizing concentrated solar energy (CSE).4–6 The measure of deviation from oxygen stoichiometry (non-stoichiometry, δ) of the oxygen carrier plays a crucial role in deciding the overall process efficiency. In terms of superior reaction kinetics and thermochemical stability, non-stoichiometric oxides are mostly preferred as oxygen carriers for thermochemical reactions.1–6 High operating temperatures were generally required for the benchmark ceria (CeO2) based oxygen carriers. The addition of doping cations in substitution to cerium promotes the oxygen mobility and creation of oxygen vacancies in the ceria fluorite lattice, which in turn enhances the reduction capability of ceria-based mixed oxides in comparison with pure ceria. As a result, it has been demonstrated that the incorporation of cerium oxide with other metals gives rise to mixed oxides that can be reduced at lower temperatures than pure ceria.7 In return, the oxidation rates of the mixed ceria compounds are drastically lowered in comparison with those of pure ceria.8 In other words, the oxidation step is hindered when the reduction step is facilitated, and vice versa. This persuaded the quest for alternative materials, among which perovskite structured complex oxides were found to be the most effective.1,2,9–11 In this case, the ABO3 structure can accommodate a large number of cationic substitutions in varying proportions in the crystal lattice, thereby allowing long-range tailoring of the redox chemistry of these materials. In solar thermochemical redox processes, the most encouraging performance so far was reported for materials with manganese in the B-site, along with lanthanum and strontium together occupying the A-site (e.g., LaxSr1−xMnO3).12–16 Several other combinations were explored where issues regarding limited redox efficiency, thermal stability, or kinetic reaction rates were frequently encountered.14,15 Therefore, studies are still ongoing to identify an optimum perovskite composition for the advancement of this interesting approach for solar energy harvesting. Introducing cationic mismatch in the A/B-site could be one appropriate way to modify the thermochemical redox behaviour of perovskite oxides. Apart from the nature, the amount of cationic substituents was found to be crucial in this regard. Structural variations, electron distributions, cation exsolution or unusual oxidation states thus arise, and can contribute towards higher redox reaction extents, enhanced oxygen mobility and oxygen vacancy concentration, as desired for efficient oxygen carriers. However, further fundamental understanding is necessary to identify appropriate combination of elements that can be used as cations in mixed metal oxides.
Information regarding the influence of cation dependent parameters on the thermochemical redox activity can supplement the compositional optimization of perovskite oxygen carriers. In this regard, one straightforward and facile strategy is to deduce the relationships between simple structural aspects with experimentally obtained data. Previously, Liu et al. used transition metal electronegativities to describe the trends in oxygen storage capacity among a series of perovskites.17 In another study, Wang et al. observed that the ignition behaviour of a series of substituted perovskites was related to variations in the calculated values of electronegativity and bond energy.18 More recently, Nair et al. derived the correlation between the amounts of oxygen and CO evolved during the two-step thermochemical redox process, with geometrical parameters such as critical radius and lattice free volume, respectively, in a series of A-site substituted manganite perovskites.19 Depending on the variations in the A/B-site cationic composition, several such metrics can be recognized that may independently or synergistically control the thermochemical redox behaviour of perovskite oxides. For instance, the value of Goldschmidt tolerance factor (τ) is primarily dependent on the entire cationic composition and is considered as a measure of deviation from the ideal cubic structure. The extent of this structural distortion can be important for facilitating the bulk to surface (or vice versa) oxygen mobility, one major requirement for thermochemical redox applications.20,21 Similarly, variations in cation electronegativity (χ) or metal–oxygen bond energy (λ) can contribute towards describing the thermochemical redox properties of oxygen carriers.
Partial substitution of cationic elements in varying amounts results in lattice structural defects, thus facilitating oxygen vacancy formation and influencing bond polarity. The resultant lowering of activation energies for electron and oxygen ion transport favours rapid release and uptake of oxygen, as required for thermochemical redox reactions. Proposing a relevant indicator by accommodating all the possible perovskite-based oxygen carriers can be promising. However, it is to be noted that several other phenomena such as sintering, phase decomposition, carbonate formation, etc., are to be considered and cannot be ruled out. A limited number of perovskite oxides exhibited the potential to overcome the aforementioned stability concerns. Among these, an even fewer number of materials were studied by systematically varying the A/B site compositions. The incorporation of Sr and Al respectively at the A- and B-sites was previously found to influence the redox properties of LaMnO3.22–28 LSMA materials (LaxSr1−xMnyAl1−yO3) were selected chiefly because they represent one of the most attractive perovskite-based compositions for solar-driven thermochemical CO2 splitting. Currently, they are among the most performing materials in terms of thermochemical stability, redox activity, CO2 splitting ability, and fuel production capacity. While the presence of Sr can strongly influence the thermal reducibility, the presence of Al can eliminate the surface carbonate formation that may arise due to Sr segregation.15,27 Therefore, LSMA is a suitable choice to obtain relevant information regarding the derivation of a general descriptor for thermochemical redox properties. The materials used in this study cover a large span of compositional space in the LSMA perovskite series. Long term performance and compositional stability of these materials during thermochemical redox cycles were previously confirmed.13,22,25,27 This approach is novel and never used before to provide key indicators about the selection, suitability and relevance of a given material formulation for CO2 splitting. Therefore, in the present study, a series of LaxSr1−xMnyAl1−yO3 perovskites were prepared and their thermochemical oxygen release and subsequent CO2 splitting efficiencies were experimentally determined. The values thus obtained, along with the corresponding reaction rates, were correlated with the calculated values of tolerance factor, critical radii, lattice free volumes, electronegativities, and metal–oxygen bond energies. These parameters are indicators that reflect the crystal lattice distortion of the perovskite caused by cationic substitution to induce oxygen vacancies. The most obvious connections were observed for the amounts of O2/CO released with overall cation electronegativities (χAB) and average metal–oxygen bond energies (λ) among the series of materials considered in this study.
2. Experimental
2.1 Synthesis of materials
The syntheses of multi-cation (Sr and Al) substituted LaMnO3 perovskites were carried out by following the Pechini method. Metal nitrates, citric acid and ethylene glycol were used as precursors. Appropriate amounts of metal nitrates depending on the stoichiometry of the final perovskite were dissolved in an aqueous solution of citric acid. A pre-determined amount of ethylene glycol was then added, and the resultant solution was stirred for 4 h, Afterwards, the solution was dried at 80 °C for 48 h and the dry foamy mass obtained was ground well and calcined under air for 2 h at 1400 °C. The amount of citric acid was chosen so as to attain a molar ratio of 1.5 with total metal ions, and the citric acid:ethylene glycol ratio was fixed at 3![[thin space (1/6-em)]](https://www.rsc.org/images/entities/char_2009.gif) :
:![[thin space (1/6-em)]](https://www.rsc.org/images/entities/char_2009.gif) 2. The calcination temperature was chosen by considering the desired pure phase formation, structure and phase stability under the reaction conditions and melting points of the metallic components used. The materials thus obtained are designated as La0.4Sr0.6Mn0.6Al0.4O3 (LSMA-6,4), La0.6Sr0.4Mn0.6Al0.4O3 (LSMA-4,4), La0.6Sr0.4Mn0.4Al0.6O3 (LSMA-4,6), La0.5Sr0.5Mn0.75Al0.25O3 (LSMA-5,2.5), and La0.5Sr0.5Mn0.5Al0.5O3 (LSMA-5,5).
2. The calcination temperature was chosen by considering the desired pure phase formation, structure and phase stability under the reaction conditions and melting points of the metallic components used. The materials thus obtained are designated as La0.4Sr0.6Mn0.6Al0.4O3 (LSMA-6,4), La0.6Sr0.4Mn0.6Al0.4O3 (LSMA-4,4), La0.6Sr0.4Mn0.4Al0.6O3 (LSMA-4,6), La0.5Sr0.5Mn0.75Al0.25O3 (LSMA-5,2.5), and La0.5Sr0.5Mn0.5Al0.5O3 (LSMA-5,5).
2.2 Characterization
The formation, purity and crystallinity of the desired perovskite oxygen carriers were assessed by performing X-ray diffraction (XRD) analysis. A Philips PW1820 diffractometer with the Cu Kα radiation (0.15418 nm, angular range 2θ = 20–80°, steps = 0.02 2θ, recording time = 2 s) was used. Standard diffraction patterns (powder diffraction file PDF-2, International Centre for Diffraction Data, ICDD) were used to compare and confirm the formation of the appropriate phase.
2.3 Thermochemical redox experiments
Thermochemical reduction and re-oxidation extents of the perovskite oxides were determined by performing thermogravimetric analyses (TGA) using a SETARAM SETSYS Evolution device (0.03 μg resolution) equipped with a platinum crucible. Mass variations during reduction and re-oxidation steps were continuously monitored as a function of temperature and time. Prior to the redox experiments, blank runs were carried out to eliminate the possible minor baseline drifts due to gas expansion or buoyancy effects. Each analysis was performed using approximately 100 mg of perovskite material in the powder form. A thermal reduction step was performed under an Ar flow of 0.020 NL min−1 (99.999% purity, with <2 ppm O2) at a fixed temperature of 1400 °C during 45 min of temperature plateau. Subsequent re-oxidation step was performed under CO2 (50% in Ar) at 1050 °C for 60 min. All heating and cooling steps followed a ramp rate of 20 °C min−1. The mass variations were used to determine the number of moles of oxygen (nO2) released during thermal reduction (nO2 = Δmred/MO2) and number of moles of CO (nCO) produced during re-oxidation (nCO = Δmoxi/MO).
3. Results and discussion
Formation of the appropriate pure phase materials with significant extent of crystallinity is one fundamental requirement for obtaining the desired performance in mixed metal oxides. Therefore, all the synthesized materials used in this study were analysed initially by X-ray diffraction and the obtained diffractograms are shown in Fig. 1. The peaks observed in the wide-angle region for LaxSr1−xMnyAl1−yO3 oxygen carriers calcined at 1400 °C were found to belong to the characteristic perovskite structure and slight disparities in peak positions were in accordance with the variations in the cationic constituents. The average crystallite sizes of these materials were determined by using the Scherrer equation. The resultant values varied between 40 and 80 nm and are shown in Table 1. The B-site composition seems to influence the crystallite size since a steady increase was observed with regard to the amount of aluminium incorporated in the material. Information regarding the redox performance of these phase pure perovskites was then gathered by carrying out thermogravimetric analysis. At first, the mass variations during thermochemical reduction (1400 °C) were continuously monitored (ESI,† Fig. S1) and the corresponding amount of oxygen released from these materials were calculated. The obtained O2 evolution profiles as a function of time are shown in Fig. 2(a). Numerical differentiation of these profiles provided the maximum value for O2 evolution (thermal reduction) rates, and the profiles are given in the ESI,† Fig. S2. The amounts of O2 evolved and the reduction rates (Table 1) seem to depend on the amount of Sr in the perovskite oxygen carrier. Apart from the lattice structural modifications, the introduction of Sr in the A-site can result in an increase in the formal oxidation state of Mn (between 3+ and 4+). This change in the oxidation state can be an immediate justification one could find for the experimental O2 evolution trends. On a detailed observation, LSMA-4,4 and LSMA-4,6 contain the same amount of Sr (40%) in the structure, and the amounts of O2 evolved are 208 μmol g−1 and 273 μmol g−1, respectively.
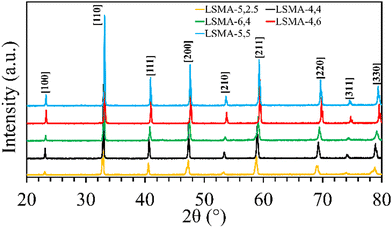 |
| | Fig. 1 Wide angle powder XRD patterns observed for a series of LaxSr1−xMnyAl1−yO3 oxygen carriers synthesized using the Pechini method, calcined at 1400 °C. | |
Table 1 Overview of LaxSr1−xMnyAl1−yO3 oxygen carriers used, along with their redox performance during thermochemical reduction and CO2 splitting
| Material |
Crystallite size (nm) |
O2 evolved (μmol g−1) |
Maximum rate of reduction (μmol g−1 s−1) |
CO evolved (μmol g−1) |
Maximum rate of re-oxidation (μmol g−1 s−1) |
| La0.5Sr0.5Mn0.75Al0.25O3 (LSMA-5,2.5) |
40.25 |
352 |
0.326 |
165 |
0.090 |
| La0.6Sr0.4Mn0.6Al0.4O3 (LSMA-4,4) |
53.77 |
210 |
0.230 |
205 |
0.132 |
| La0.4Sr0.6Mn0.6Al0.4O3 (LSMA-6,4) |
51.54 |
400 |
0.322 |
173 |
0.11 |
| La0.5Sr0.5Mn0.5Al0.5O3 (LSMA-5,5) |
63.68 |
315 |
0.269 |
192 |
0.16 |
| La0.6Sr0.4Mn0.4Al0.6O3 (LSMA-4,6) |
77.60 |
267 |
0.226 |
204 |
0.153 |
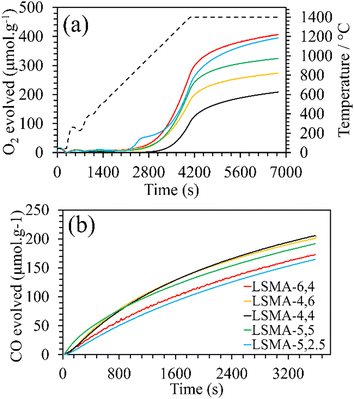 |
| | Fig. 2 (a) O2 evolution profiles derived from mass variation during thermochemical reduction for LaxSr1−xMnyAl1−yO3 oxygen carriers. Dashed line represents the temperature variation during reduction (20 °C min−1 up to 1400 °C). (b) CO evolution profiles derived from mass variation during CO2-induced re-oxidation at 1050 °C. | |
In this case, the variation in the amount of O2 evolved at constant Sr concentration may be attributed to the changes in the Al content in the B-site.
Furthermore, the variations in the amounts of O2 evolved were observed for LSMA-5,2.5 and LSMA-5,5 (395 μmol g−1 and 324 μmol g−1, respectively). Here, in contrast to the above observations, the composition of the B-site (Al and Mn) also cannot provide a satisfactory explanation for the observed trends. From these results, it can be concluded that rather than variation in the amount of one or more cationic constituents in the composition, the material as a whole synergistically contributes towards the release of oxygen from the perovskite lattice. After achieving a significant extent of reduction, each of these materials was subjected to re-oxidation (isothermal) in the presence of CO2 (ESI,† Fig. S1). Here again, the mass variations during re-oxidation (1050 °C) were used to obtain the amounts of CO produced, along with the values of CO evolution (re-oxidation) rates. The obtained CO evolution profiles as a function of time are shown in Fig. 2(b). Even though the amounts of CO produced remain smaller in comparison with the amounts of oxygen evolved during reduction (i.e., nCO < 2·nO2) (Table 1), the trends observed for re-oxidation reflected the observed pattern for oxygen evolution. Interestingly, the materials exhibiting superior efficiency for O2 evolution were found to be the least effective for CO2 splitting (reversed trend) under the conditions used in the present study. In other words, the extent of thermochemical reduction cannot be considered as the sole decisive parameter controlling the CO2 splitting activity of these oxygen carriers. Apart from the cation composition, no parametric alterations were involved either during the synthesis or during the thermochemical redox experiments for the LaxSr1−xMnyAl1−yO3 perovskites. Therefore, the observed discrepancies in gas evolution and the corresponding reaction rates can be attributed to the changes in composition of the oxygen carriers. Distorted structures induced by cation element substitution can promote oxygen vacancy formation in the crystal lattice and lower the activation energy of electron and oxygen ion transfer for the CO2 reduction reaction.
Surface analysis on a series of LaxSr1−xMnyAl1−yO3 by Ezbiri et al. previously indicated Mn as the redox active element, similar to aluminium free LaxSr1−xMnO3.27 Therefore, an approximate evolution of the Mn oxidation state in these materials can be derived from the mass variations obtained during thermochemical redox experiments. Assuming complete oxidation during calcination, the formal oxidation state of manganese can be calculated and was found to be close to +4 for all the materials. Thus, during thermochemical reduction, the highest oxidation state fraction of manganese transforms firstly into Mn3+, and subsequently to Mn2+. Since both A and B-site compositions were varied simultaneously, the Mn state in fully oxidized (fresh) materials was not significantly different. In other words, when varying the amount of a single cation, the corresponding changes in the oxidation state are more evident. However, when the amounts of two cations (here Sr and Al) are simultaneously varied, the overall effect is compensated partially. The changes in the manganese oxidation state during O2 and CO evolution as a function of time are given in Fig. 3. For Lax3+Sr1−x2+Mnyn+Al1−y3+O32−, the oxidation state of the redox active Mn element is calculated using the following equation (assuming that Mn is the only reducible cation in the B site that participates in the redox reactions).
| | | y × n = [3 × 2] − [(x × 3) + ((1 − x) × 2) + ((1 − y) × 3)] | (1) |
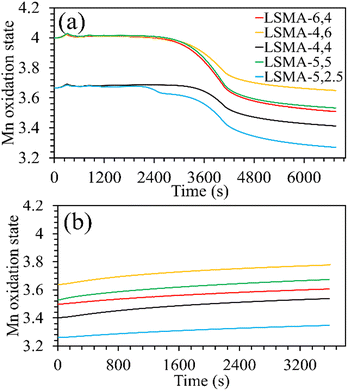 |
| | Fig. 3 Evolution of the manganese oxidation state during the (a) thermochemical reduction under Ar and (b) re-oxidation under CO2, for LaxSr1−xMnyAl1−yO3 oxygen carriers. | |
Both the amounts of Sr and Al were found to influence the Mn oxidation state of the fresh perovskite oxides. Up to 40% Al and 50% Sr in the structure, the oxidation state of manganese remained +3.67, whereas it was +4 for the remaining materials. The final Mn oxidation state after thermochemical reduction varied depending on the overall composition of the perovskites. For example, LSMA-4,6 and LSMA-4,4 had different initial oxidation states for manganese (+4 and +3.67, respectively) and different extents of variation in oxidation states (0.35 and 0.25, respectively). Interestingly, re-oxidation with CO2 did not bring back the Mn oxidation states to the initial values. Clear distinctions were observed in the final Mn oxidation states, depending on the value at the beginning of CO2 splitting. However, the extent of variation remained constant (0.14), except for LSMA-6,4 and LSMA-5,2.5 (0.11 and 0.09, respectively). This could be the reason for the observed smaller difference in amounts of CO produced in comparison with the amounts of oxygen evolved during reduction.
Several parameters can be affected by the changes in the size and amount of cations in perovskites. Even though it is widely accepted that an ideal perovskite structure is cubic, cation mismatch can induce deviations.19,29 In reality, a majority of perovskite oxides exist with structural distortions in the crystal lattice (orthorhombic, rhombohedral, etc.) to some extent. One simple parameter considered as a measure of such deviations called tolerance factor (τ) was earlier proposed by Goldschmit.20,30 It is estimated based on the size and amount of the cationic components along with oxygen, constituting the entire perovskite composition, as shown in eqn (2).
| | | τ = [RA·x + RA′.(1 − x) + RO]/√2·[RB·y + RB′·(1 − y) + RO] | (2) |
Here,
RN represents the ionic radii of atoms constituting the A
xA
1−x′B
yB
1−y′O
3 structure. A cubic perovskite structure is usually identified by a value of unity for the tolerance factor. However, stable orthorhombic or rhombohedral variants can exist with lower values of
τ (between 0.75 and 1) and, for values slightly higher than unity, hexagonal distortions are commonly observed. Structural anomalies thus arise and can have some impact on the crystal symmetry, oxygen mobility and may thereby influence the O
2 release/uptake in these materials. In the present study,
τ values were calculated using the ionic radii data tabulated by Shannon
31 and the values varied between 0.98 and 1.005. A graphical representation of O
2 evolution as a function of tolerance factor (Fig. S3, ESI
†) resulted in a random distribution without displaying any specific tendencies, indicating that this parameter seldom defined the thermochemical reduction of La
xSr
1−xMn
yAl
1−yO
3 series. Moreover, a similar distribution was obtained for reduction rates. On the other hand, the amounts of CO evolved, and the corresponding re-oxidation rates exhibited comparatively better correlation, displaying a slightly increasing trend when plotted as a function of the tolerance factor, as shown in
Fig. 4. Here, one might probably conclude that a lesser deviation from the ideal cubic structure is favouring thermochemical re-oxidation in the presence of CO
2 in these materials. It is to be noted that the observed tendencies of CO evolution were nearly opposite to the ones observed during thermochemical O
2 evolution (
Fig. 2), indicating that the mechanism involved can be similar. However, since such a resemblance is not observed for reduction and re-oxidation while using tolerance factor as a descriptor, the trends observed during re-oxidation cannot be considered conclusive.
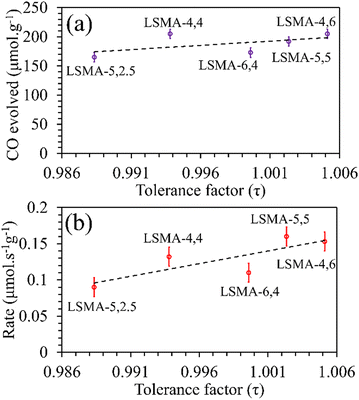 |
| | Fig. 4 Amounts of CO evolved (a) and re-oxidation rates (b) as a function of tolerance factor for LaxSr1−xMnyAl1−yO3 oxygen carriers. | |
One frequently used metric to define the anion (O2−) migration in perovskites is the critical radius (Rc), which is defined as the radius of a 3D spherical region, involving two A-site cations and one B-site cation.32–35Rc depends on the radii of cations constituting the structure and can be calculated using the following eqns.
| | | Rc = [3/4a02 − RA2 + RB2 − √2a0RB]/[2(RA − RB) + √2a0] | (3) |
| | | a0 = 2.15RB + 2.47 − 1.40 (τ−1 − 1) | (4) |
Here,
a0 is the pseudo cubic lattice parameter. In general, an increase in
Rc values indicates an increase in the volume of 3D space designated for the mobility of oxygen in the lattice, assuming that the effects of all other parameters influencing bulk-surface oxygen transport are negligible. The
Rc values obtained for the oxygen carriers used in this study varied between 1.44 and 1.47 Å. As shown in
Fig. 5, the plot of the amount of O
2 evolved as a function of the calculated values of critical radius was found to be in agreement with the generally expected trends. Better correlations were observed for the values of O
2 evolution rates, indicating the effectiveness of
Rc to describe the O
2 evolution in La
xSr
1−xMn
yAl
1−yO
3 oxygen carriers. Therefore, further attempts were made to comprehend the role of
Rc in CO
2 splitting by these materials and the obtained profiles are shown in Fig. S4 (ESI
†). In this case, despite the observed superior correlations, both the amounts of CO evolved and the corresponding re-oxidation rates were found to sharply decrease with an increase in
Rc, indicating that lower values of
Rc would favour superior oxygen transport, which is unreasonable. Afterwards, the critical radius per unit cell volume (
Rc·
u) was also used to correlate the O
2/CO evolution (
Fig. 6 and Fig. S5, ESI
†). In this case, the trends and correlations were found to be consistent for CO evolution, whereas the amount of O
2 evolved was found to decrease with an increase in
Rc·
u and hence, such a trend was irrational. In short, these results cannot satisfactorily explain the observed reversed O
2/CO evolution profiles (
Fig. 2). Therefore, the critical radius cannot be considered as a reliable parameter for portraying the thermochemical redox properties of the perovskite series used in this study. Another geometric parameter that could represent the oxygen transport properties in perovskite oxides is the lattice free volume (
VF).
32–34,36,37 This is defined as the difference between the total unit cell volume and the volume occupied by the elemental components in the structure. The activation energy for bulk to surface (or
vice versa) oxygen transport can be lowered by an increased availability of the free space in the lattice. The calculated values of free volumes and specific free volumes (free volume per unit cell volume,
VF·S) were used to correlate the observed trends in O
2/CO evolution and the corresponding reaction rates (Fig. S6–S9, ESI
†). Overall, an increase in geometric parameters (
Rc and
VF) indicates an increase in the available path for ion migration, thereby favouring oxygen release/uptake. However, the observed trends reported in Fig. S4, S5 and S7 (ESI
†) indicate otherwise. Similarly, regarding specific free volume (ESI,
† Fig. S8 and S9), the values of gas evolved (O
2 and CO respectively) varied for same values of
VF·S. Because of such unrealistic trends, geometric parameters can be considered inappropriate to describe the thermochemical redox behaviour of the perovskite oxygen carriers used in this study.
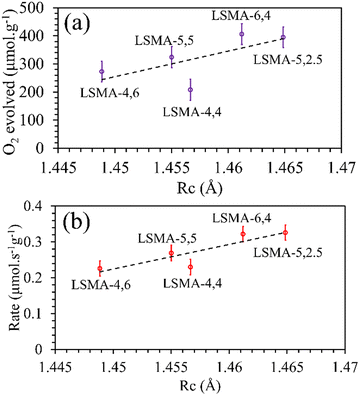 |
| | Fig. 5 Amounts of O2 evolved (a) and reduction rates (b) as a function of critical radius for a series of LaxSr1−xMnyAl1−yO3 oxygen carriers. | |
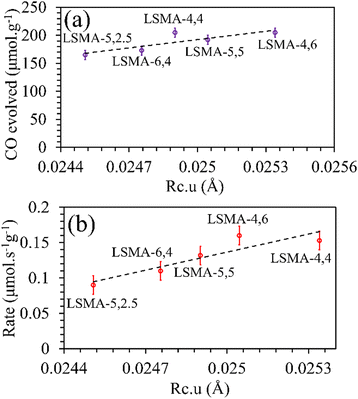 |
| | Fig. 6 Amounts of CO evolved (a) and re-oxidation rates (b) as a function of critical radius per unit cell volume for LaxSr1−xMnyAl1−yO3 oxygen carriers. | |
In reality, apart from the aforementioned geometric considerations, the perovskite structure and stability rely on other cation dependent parameters such as electronegativity and metal–oxygen bond strength.17,18 Electronegativity (χ) is the measure of the tendency of an atom to attract nearby electrons towards itself. The lower the value of electronegativity of the element, the higher will be the ability of the attached oxygen atom to draw the bonding electrons, thereby influencing the thermochemical redox properties of perovskite oxides. In this study, based on previous reports,17 we initially tried to correlate the values of B-site electronegativities (χB), with the amounts of O2 released and the corresponding reaction rates. The molar average of electronegativities of the B-site cationic constituents on the Pauling scale was used.38 For LaxSr1−xMnyAl1−yO3, the values of electronegativities were calculated using eqn (5)–(7).
| | | χA = x × χLa + (1 − x) × χSr | (5) |
| | | χB = y × χMn + (1 − y) × χAl | (6) |
As shown in Fig. S10 (ESI†), the correlations obtained were not appropriate to portray the O2 evolution behaviour. For instance, different values of O2 evolution were obtained for the same value of electronegativity in the case of LSMA-4,4 and LSMA-6,4. Similarly, A-site electronegativities (χA) were also found not suitable to depict the amounts of O2 evolved and reduction rates (Fig. S11, ESI†). Therefore, we calculated the overall cation electronegativity (χAB) of the entire cationic components incorporated in the LaxSr1−xMnyAl1−yO3 according to eqn (7). Interestingly, in this case, a clear decrease in values of O2 evolved and reduction rates was observed with an increase in overall cation electronegativity. Very good correlations were observed for the experimental trends with the calculated values of χAB, as shown in Fig. 7. As mentioned above, an increase in χAB indicates a decrease in metal–oxygen bond polarity, thereby hindering oxygen vacancy formation, among the series of LaxSr1−xMnyAl1−yO3 oxygen carriers studied. Furthermore, the impact of cation electronegativities for CO evolution was also assessed. In this case, the amount of CO evolved was directly proportional to χAB and superior correlations were observed, as shown in Fig. 8. This is exactly reverse to the trends observed during O2 evolution, which hence satisfactorily explains the behaviour of O2/CO evolution shown in Fig. 2. In short, the calculated values of overall electronegativities effectively predict the thermochemical reduction and CO2 induced re-oxidation for the series of oxygen carriers considered in this study, thus clearly indicating the existence of synergy between the cationic components in the oxygen carriers.
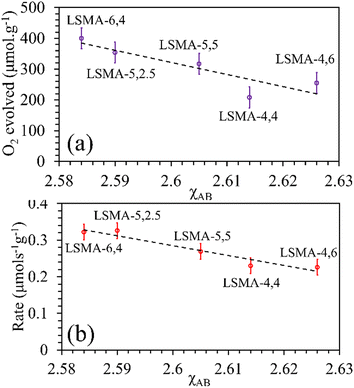 |
| | Fig. 7 Amounts of O2 evolved (a) and reduction rates (b) as a function of overall electronegativity of cationic components for LaxSr1−xMnyAl1−yO3 oxygen carriers. | |
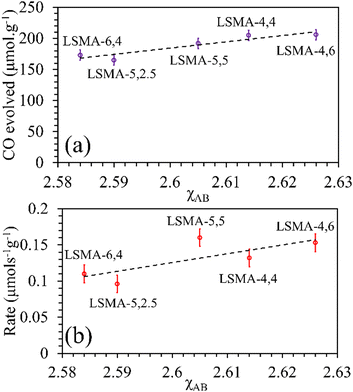 |
| | Fig. 8 Amounts of CO evolved (a) and re-oxidation rates (b) as a function of overall electronegativity of cationic components for LaxSr1−xMnyAl1−yO3 oxygen carriers. | |
Metal–oxygen bond energy (λ) represents the energy required to break metal–oxygen bonds and hence can be considered as an effective parameter reflecting the oxygen transport in perovskite oxides. In other words, the calculated values of λ reflect the binding energy of oxygen with A/B-site metal cations in the perovskite lattice. Several studies previously used the calculated values of average metal–oxygen bond energies as a tool to describe the behaviour of perovskites as catalysts, electrolytes, etc.32–34,39,40 In the present study, metal–oxygen bond energy (λ) was calculated using eqn (8), where CN is the coordination number of the metal, ΔHf is the heat of formation of MmOn (M = A or B), ΔHs is the heat of sublimation of the metal and Do is the dissociation energy of oxygen.41,42
| | | λM–O = (1/CN·m)·[ΔHf − m·ΔHs − (n/2)·Do] | (8) |
| | | λA–O = x × λLa–O + (1 − x) × λSr–O | (9) |
| | | λB–O = y × λMn–O + (1 − y) × λAl–O | (10) |
First, we tried to correlate the values
λA–O and
λB–O separately with the amounts of O
2 released and the thermal reduction rates. The values of ionic radii of the cationic constituents compiled by Shannon
31 were used for calculating the molar average of metal–oxygen bond energies using
eqn (8)–(10) and the obtained profiles are shown in Fig. S14–S17 (ESI
†). Indeed, the values of bond energies corresponding to individual cationic constituents were not sufficient to describe the behaviour of O
2 evolution in these perovskites. For example, LSMA-5,2.5 and LSMA-5,5 have same values of
λA–O. However, the amounts of oxygen evolved from them were different (ESI,
† Fig. S14). Therefore, we calculated the overall bond energies (
λ) comprising all the cations incorporated in A and B-sites of the La
xSr
1−xMn
yAl
1−yO
3 structure. In this case, an inverse relationship was observed between oxygen evolution and
λ. Obviously, oxygen release will be more facilitated by a weaker bond.
Satisfactory correlations were observed for the experimentally observed O2 evolution tendencies, as shown in Fig. 9. In a similar manner, no specific influence was evident for individual bond energies (λA–O and λB–O) in CO2 induced re-oxidation.
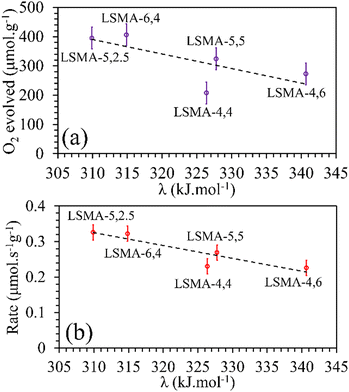 |
| | Fig. 9 Amounts of O2 evolved (a) and reduction rates (b) as a function of overall bond energies for LaxSr1−xMnyAl1−yO3 oxygen carriers. | |
In contrast, both the amounts of CO evolved and the re-oxidation rates were very well correlated with the calculated values of overall bond energies (λ), exhibiting superior correlations, as shown in Fig. 10. Similar to the observations in the case of electronegativity, a reversal in trends was visible for the distributions of O2 evolution and CO evolution against λ, in agreement with the results in Fig. 2. This result further confirms the suitability of overall bond energy as an effective descriptor for thermochemical reduction and CO2 induced re-oxidation for the oxygen carriers investigated in the present study. Additionally, these results confirm the synergistic contribution of the individual cationic constituents in depicting the thermochemical redox properties. Thus, overall electronegativity (χAB) and overall metal–oxygen bond energy (λ) are found to be the most suitable parameters for describing the thermochemical redox activity of LaxSr1−xMnyAl1−yO3 oxygen carriers. This was further confirmed by a plot of bond energies as a function of cation electronegativities. As shown in Fig. 11, the bond energy increased with an increase in the values of electronegativity.
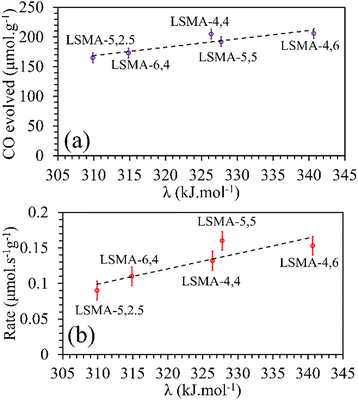 |
| | Fig. 10 Amounts of CO evolved (a) and re-oxidation rates (b) as a function of overall bond energies for a series of LaxSr1−xMnyAl1−yO3 oxygen carriers. | |
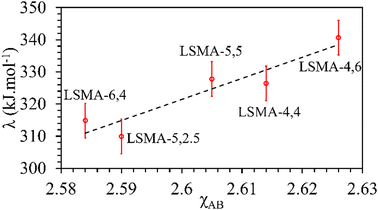 |
| | Fig. 11 Calculated values of overall metal–oxygen bond energies as a function of overall cation electronegativities for a series of LaxSr1−xMnyAl1−yO3 oxygen carriers. | |
Tailoring the redox functionalities of oxygen carriers plays a major role in advancing the thermochemical redox processes for concentrated solar energy applications. Fundamental understanding of the reaction mechanisms along with identification of the crucial parameters controlling the redox behaviour will be a major objective in this regard. In mixed oxide oxygen carriers, a seemingly facile approach will be the selection of appropriate cationic components in adequate concentrations. However, in perovskites, experimental determination of appropriate formulations is rather complex considering the plethora of elements that can occupy the cationic sites in varying amounts. This offers the room for identifying a suitable descriptor to carry out an initial screening while selecting the formulation. Preliminary information regarding the formation, stability and structural distortion in ABO3 materials can be obtained from the tolerance factor (τ). A straightforward calculation of τ can be achieved by using the ionic radii of the constituents, (see eqn (2)). As mentioned before, the values of τ imply deviations from the ideal cubic crystal structure (τ = 1). Larger deviations from unity result in the collapse of the ABO3 structure, resulting in the formation of binary oxides or related structural variants. It is to be noted that the thermochemical release of lattice oxygen results in changes in the transition metal oxidation state and hence the ionic radii during the reaction. Therefore, initial selection of the cationic components of the perovskite structure should be made with minimum deviation from the value of unity for tolerance factor, so as to accommodate structural variations during the reduction and re-oxidation reactions. Among the series of oxygen carriers used in this study, conclusive trends were not observed for O2/CO evolution as a function of tolerance factor. Therefore, apart from preliminary information regarding material formation and stability, it can be concluded that this parameter has a negligible influence to predict the redox behaviour of perovskite oxygen carriers. In general, the thermochemical reduction and the subsequent re-oxidation can follow different mechanisms. The critical radius per unit cell volume was previously found to identify the O2 evolution behaviour whereas, CO2 splitting tendencies were better defined by the values of lattice free volumes, among a series of A-site substituted perovskites (La1−xAxMnO3).19 In that case, only A-site composition was varied, implying geometrical modifications as the predominant consequence, and the redox active center (Mn) remained the same. Moreover, no inverted trends were evidenced from the O2/CO evolution profiles. In contrast, both A and B-site compositions in the perovskites were simultaneously changed in the present study and thus variations in both structural aspects and redox active sites were inevitable. This can be a reason why parameters denoting structural changes (τ, Rc, and VF) alone did not satisfactorily reflect the observed redox performance trends.
Apart from structural parameters, bond polarity aspects were also considered to correlate the thermochemical oxygen release/uptake behaviour of perovskites. Indicating the presence of synergistic interactions between the cationic components, the molar average of electronegativities was found to correlate well with O2/CO evolution trends. Similarly, the overall values of metal–oxygen bond energy were also found to satisfactorily correspond to the thermochemical redox reaction trends in perovskite oxides considered in this study. Previous studies indicated a composition dependence of oxygen vacancy formation energy in perovskites, making them a favourable choice as oxygen carriers for solar thermochemical fuel production.10,23,43–45 Pearson cross-correlation analysis involving all the variables used in this study was performed separately for solar thermal O2 evolution and CO2 splitting, and the resultant correlation matrices are provided in Fig. 12. The values of Pearson coefficients (r) generally vary between +1 and −1, where +1 indicate a direct linear correlation and −1 indicate an inverse linear correlation. Values above 0.80 (or below −0.80) indicate strong correlation while the values closer to 0 mean poor correlation.46–48 Strong inverse correlations were observed for the rates of oxygen evolution with overall electronegativity and metal–oxygen bond energies, with r values of −0.96 and −0.90, respectively. Similarly, strong direct linear correlations were observed for the rates of CO2 splitting with overall electronegativity and metal–oxygen bond energies, with r values of 0.78 and 0.91, respectively. It is to be noted here that strong correlations were observed for other parameters also. However, in this case, the condition for inverted trends in O2/CO evolution was not satisfied. Therefore, bond polarity can be considered as a simple and convenient parameter for the initial selection of oxygen carriers in solar thermochemical processes.
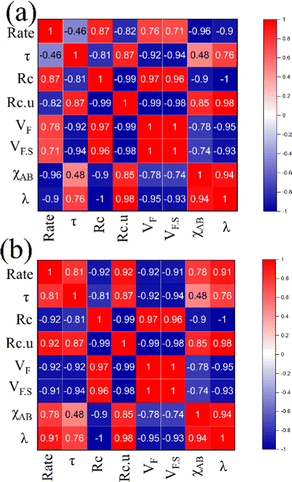 |
| | Fig. 12 Pearson correlation matrices indicating the relationship between different parameters used for (a) oxygen evolution and (b) CO2 splitting. | |
Varying the amount of Sr and Fe in A and B-sites, respectively, was found to modify the oxygen vacancy formation energy in perovskites. In LaxSr1−xMnyAl1−yO3, substitution of Sr2+ in the La3+ site results in holes and shifts the Fermi energy with respect to the O 2p band center. Also, the changes in the Mn concentration in the B-site tunes the mixed Mn 3d–O 2p band, accommodating a larger shift in Fermi energy. The findings of the present study clearly show that the variations in O2 and CO evolutions were suitably described by the overall cationic composition of the A and B-sites, at least for the series of materials and reaction conditions used. Moreover, this study proposes the use of bond polarity as indicated by cation electronegativity or metal–oxygen bond energy as appropriate metrics to screen multi-component perovskite oxides for applications in thermochemical redox reactions. In addition to the material design criteria based on thermodynamic parameters,49 the use of such simple parameters can aid in the preliminary selection of oxygen carrier compositions.
4. Conclusion
Perovskite structured oxygen carriers with varying amounts of strontium and aluminium in the A and B sites, respectively, were studied regarding their thermochemical O2 evolution and CO2 splitting efficiencies. Since cation composition was the sole variable throughout the redox experiments, the changes in gas evolution tendencies can be attributed to the same. Cation substitution can induce structural distortions in perovskite oxides and can thereby influence the vacancy formation and ion mobility in the crystal lattice. The factors selected in this study reflect the extent of such distortions and their influence on the oxygen uptake and release during thermochemical redox cycles. Geometric parameters such as tolerance factor (τ), critical radius (Rc) and lattice free volume (VF) were found not to be suitable to depict the observed thermochemical redox reaction trends. In contrast, direct relationships between the calculated values of cation electronegativities (χ) and metal–oxygen bond energies (λ) with experimental O2/CO evolution were observed. In this case, an overall contribution incorporating all the cationic constituents was found to be necessary. Lower values of overall cation electronegativities (or metal–oxygen bond energies) favoured oxygen release from LaxSr1−xMnyAl1−yO3 oxygen carriers, whereas higher values favoured oxygen uptake during CO2 induced re-oxidation. The proposed cation dependent parameters are expected to accelerate the design of perovskite oxygen carriers for thermochemical redox processes utilizing concentrated solar energy in the future.
Author contributions
Conceptualization: M. M. N. and S. A.; data curation: M. M. N. and S. A.; formal analysis: M. M. N. and S. A.; investigation: M. M. N. and S. A.; methodology: M. M. N. and S. A.; project administration: S. A.; supervision: S. A.; validation: M. M. N. and S. A.; visualization: M. M. N.; writing original draft: M. M. N.; writing review and editing: S. A.
Conflicts of interest
There are no conflicts to declare.
Acknowledgements
This study was supported by the French National Agency for Research (ANR, SUNFUEL project, contract no. ANR-16-CE06-0010-01).
Notes and references
- J. Vieten, B. Bulfin, P. Huck, M. Horton, D. Guban, L. Zhu, Y. Lu, K. A. Persson, M. Roeb and C. Sattler, Energy Environ. Sci., 2019, 12, 1369 RSC.
- M. Kubicek, A. H. Bork and J. L. M. Rupp, J. Mater. Chem. A, 2017, 5, 11983 RSC.
- L. Zeng, Z. Cheng, J. A. Fan, L. Fan and J. Gong, Nat. Rev. Chem., 2018, 2, 349 CrossRef CAS.
- C. L. Muhich, B. W. Evanko, K. C. Weston, P. Lichty, X. Liang, J. Martinek, C. B. Musgrave and A. W. Weimer, Science, 2013, 341, 540 CAS.
- W. C. Chueh, C. Falter, M. Abbott, D. Scipio, P. Furler, S. M. Haile and A. Steinfeld, Science, 2010, 330, 1797 CrossRef CAS PubMed.
- P. Furler, J. R. Scheffe and A. Steinfeld, Energy Environ. Sci., 2012, 5, 6098 RSC.
- M. Takacs, J. R. Scheffe and A. Steinfeld, Phys. Chem. Chem. Phys., 2015, 17, 7813 RSC.
- A. Le Gal, S. Abanades and G. Flamant, Energy Fuels, 2011, 25, 4836 CrossRef CAS.
- L. Wang, M. Al-Mamun, Y. L. Zhong, L. Jiang, P. Liu, Y. Wang, H. G. Yang and H. Zhao, Sustainable Energy Fuels, 2017, 1, 1013 RSC.
- G. Voitic and V. Hacker, RSC Adv., 2016, 6, 98267 CAS.
- Y. Chen, X. Zhu, K. Li, Y. Wei, Y. Zheng and H. Wang, ACS Sustainable Chem. Eng., 2019, 7, 15452 CrossRef CAS.
- J. R. Scheffe, D. Weibel and A. Steinfeld, Energy Fuels, 2013, 27, 4250 CrossRef CAS.
- M. M. Nair and S. Abanades, ChemistrySelect, 2016, 1, 4449 CrossRef CAS.
- M. M. Nair and S. Abanades, Sustainable Energy Fuels, 2018, 2, 843 RSC.
- A. Demont and S. Abanades, J. Mater. Chem. A, 2015, 3, 3536 RSC.
- A. Riaz, P. Kreider, F. Kremer, H. Tabassum, J. S. Yeoh, W. Lipinski and A. Lowe, ACS Appl. Energy Mater., 2019, 2, 2494 CAS.
- L. Liu, D. D. Taylor, E. E. Rodriguez and M. R. Zachariah, Chem. Commun., 2016, 52, 10369 RSC.
- X. Wang, T. Wu and M. R. Zachariah, J. Phys. Chem. C, 2017, 121, 147 CrossRef CAS.
- M. M. Nair and S. Abanades, Sustainable Energy Fuels, 2021, 5, 4570 RSC.
- J. P. Attfield, Chem. Mater., 1998, 10, 3239 CrossRef CAS.
- A. V. Shlyakhtina and K. S. Pigalskiy, Mater. Res. Bull., 2019, 116, 72 CrossRef CAS.
- A. H. McDaniel, E. C. Miller, D. Arifin, A. Ambrosini, E. N. Coker, R. O’Hayre, W. C. Chueh and J. Tong, Energy Environ. Sci., 2013, 6, 2424 RSC.
- A. M. Deml, V. Stevanovic, A. M. Holder, M. Sanders, R. O’Hayre and C. B. Musgrave, Chem. Mater., 2014, 26, 6595 CrossRef CAS.
- M. Ezbiri, M. Takacs, D. Theiler, R. Michalsky and A. Steinfeld, J. Mater. Chem. A, 2017, 5, 4172 CAS.
- T. Cooper, J. R. Scheffe, M. E. Galvez, R. Jacot, G. Patzke and A. Steinfeld, Energy Technol., 2015, 3, 1130 CrossRef CAS.
- M. E. Galvez, R. Jacot, J. R. Scheffe, T. Cooper, G. Patzke and A. Steinfeld, Phys. Chem. Chem. Phys., 2015, 17, 6629 CAS.
- M. Ezbiri, V. Becattini, M. Hoes, R. Michalsky and A. Steinfeld, ChemSusChem, 2017, 10, 1517 CrossRef CAS PubMed.
- M. Takacs, M. Hoes, M. Caduff, T. Cooper, J. R. Scheffe and A. Steinfeld, Acta Mater., 2016, 103, 700 CAS.
- J. P. Attfield, Int. J. Inorg. Mater., 2001, 3, 1147 CAS.
- M. R. Filip and F. Giustino, Proc. Natl. Acad. Sci. U. S. A., 2018, 115, 5397 CrossRef CAS.
- R. D. Shannon, Acta Crystallogr., 1976, A32, 751 CAS.
- S. Li, W. Jin, P. Huang, N. Xu and J. Shi, Ind. Eng. Chem. Res., 1999, 38, 2963 CrossRef CAS.
- R. L. Cook and A. F. Sammells, Solid State Ionics, 1991, 45, 311 CrossRef CAS.
- A. F. Sammells, R. L. Cook, J. H. White, J. J. Osborne and R. C. MacDuff, Solid State Ionics, 1992, 52, 111 CrossRef CAS.
- N. Xu, H. Zhao, X. Zhou, W. Wei, X. Lu, W. Ding and F. Li, Int. J. Hydrogen Energy, 2010, 35, 7295 CrossRef CAS.
- H. Hayashi, H. Inaba, M. Matsuyama, N. G. Lan, M. Dokiya and H. Tagawa, Solid State Ionics, 1999, 122, 1 CrossRef CAS.
- M. Mogensen, D. Lybye, N. Bonanos, P. V. Hendriksen and F. W. Poulsen, Solid State Ionics, 2004, 174, 279 CrossRef CAS.
- L. Pauling, J. Am. Chem. Soc., 1932, 54, 3570 CrossRef CAS.
- G. M. Dhar and V. Srinivasan, Int. J. Chem. Kinet., 1982, 14, 435 CrossRef.
- M. Futai, Y. Chen and L. Hui, React. Kinet. Catal. Lett., 1986, 31, 47 CrossRef.
- R. A. Robie, B. S. Hemingway and J. R. Fisher, U.S. Geol. Surv. Bull., 1979, 1452, 1 Search PubMed.
- D. D. Wagman, W. H. Evans, V. B. Parker, R. H. Schumm, I. Halow, S. M. Bailey, K. L. Churney and R. L. Nuttall, The NBS tables of chemical thermodynamic properties, J. Phys. Chem. Ref. Data, 1982, 11, 1 CrossRef.
- Y. A. Mastrikov, R. Merkle, E. A. Kotomin, M. M. Kuklja and J. Maier, Phys. Chem. Chem. Phys., 2013, 15, 911 RSC.
- E. A. Kotomin, Y. A. Mastrikov, M. M. Kuklja, R. Merkle, A. Roytburd and J. Maier, Solid State Ionics, 2011, 188, 1 CrossRef CAS.
- M. Pavone, A. B. Munoz-García, A. M. Ritzmann and E. A. Carter, J. Phys. Chem. C, 2014, 118, 13346 CrossRef CAS.
- I. Gomez-Recio, H. Pan, A. Azor-Lafarga, M. L. Ruiz-Gonzalez, M. Hernando, M. Parras, M. T. Fernandez-Diaz, J. J. Delgado, X. Chen, D. G. Jimenez, D. Portehault, C. Sanchez, M. Cabero, A. Martinez-Arias, J. M. Gonzalez-Calbet and J. J. Calvino, ACS Catal., 2021, 11, 15026 CrossRef CAS PubMed.
- T. W. Walker, A. K. Chew, H. Li, B. Demir, Z. C. Zhang, G. W. Huber, R. C. Van Lehn and J. A. Dumesic, Energy Environ. Sci., 2018, 11, 617 CAS.
- Y. Zhong, X. Liang, Z. He, W. Tan, J. Zhu, P. Yuan, R. Zhu and H. He, Appl. Catal., B, 2014, 150, 612 CrossRef.
- A. Bayon, A. de la Calle, E. B. Stechel and C. Muhich, Energy Technol., 2022, 10, 2100222 CrossRef CAS.
|
| This journal is © The Royal Society of Chemistry 2023 |
Click here to see how this site uses Cookies. View our privacy policy here.  Open Access Article
 and
Stéphane
Abanades
 *
*
![[thin space (1/6-em)]](https://www.rsc.org/images/entities/char_2009.gif) :
:![[thin space (1/6-em)]](https://www.rsc.org/images/entities/char_2009.gif) 2. The calcination temperature was chosen by considering the desired pure phase formation, structure and phase stability under the reaction conditions and melting points of the metallic components used. The materials thus obtained are designated as La0.4Sr0.6Mn0.6Al0.4O3 (LSMA-6,4), La0.6Sr0.4Mn0.6Al0.4O3 (LSMA-4,4), La0.6Sr0.4Mn0.4Al0.6O3 (LSMA-4,6), La0.5Sr0.5Mn0.75Al0.25O3 (LSMA-5,2.5), and La0.5Sr0.5Mn0.5Al0.5O3 (LSMA-5,5).
2. The calcination temperature was chosen by considering the desired pure phase formation, structure and phase stability under the reaction conditions and melting points of the metallic components used. The materials thus obtained are designated as La0.4Sr0.6Mn0.6Al0.4O3 (LSMA-6,4), La0.6Sr0.4Mn0.6Al0.4O3 (LSMA-4,4), La0.6Sr0.4Mn0.4Al0.6O3 (LSMA-4,6), La0.5Sr0.5Mn0.75Al0.25O3 (LSMA-5,2.5), and La0.5Sr0.5Mn0.5Al0.5O3 (LSMA-5,5).


