 Open Access Article
Formaldehyde gas sensor with extremely high response employing cobalt-doped SnO2 ultrafine nanoparticles†
Shiqiang
Zhou‡
ab,
Huapeng
Wang‡
a,
Jicu
Hu‡
a,
Tianping
Lv
a,
Qian
Rong
a,
Yumin
Zhang
a,
Baoye
Zi
a,
Mingpeng
Chen
c,
Dongming
Zhang
a,
Jun
Wei
b,
Jin
Zhang
*a and
Qingju
Liu
 *a
*a
aYunnan Key Laboratory for Micro/Nano Materials & Technology, National Center for International Research on Photoelectric and Energy Materials, School of Materials and Energy, Yunnan University, Kunming 650091, P. R. China. E-mail: qjliu@ynu.edu.cn; zhj@ynu.edu.cn
bShenzhen Key Laboratory of Flexible Printed Electronics Technology Center, Harbin Institute of Technology, Shenzhen University Town, Shenzhen, 518055, China
cInstitute of Applied Physics and Materials Engineering, University of Macau, Macau SAR, China
First published on 3rd January 2022
Abstract
Formaldehyde is a common carcinogen in daily life and harmful to health. The detection of formaldehyde by a metal oxide semiconductor gas sensor is an important research direction. In this work, cobalt-doped SnO2 nanoparticles (Co-SnO2 NPs) with typical zero-dimensional structure were synthesized by a simple hydrothermal method. At the optimal temperature, the selectivity and response of 0.5% Co-doped SnO2 to formaldehyde are excellent (for 30 ppm formaldehyde, Ra/Rg = 163![[thin space (1/6-em)]](https://www.rsc.org/images/entities/char_2009.gif) 437). Furthermore, the actual minimum detectable concentration of 0.5%Co-SnO2 NPs is as low as 40 ppb, which exceeds the requirements for formaldehyde detection in the World Health Organization (WHO) guidelines. The significant improvement of 0.5%Co-SnO2 NPs gas performance can be attributed to the following aspects: firstly, cobalt doping effectively improves the resistance of SnO2 NPs in the air; moreover, doping creates more defects and oxygen vacancies, which is conducive to the adsorption and desorption of gases. In addition, the crystal size of SnO2 NPs is vastly small and has unique physical and chemical properties of zero-dimensional materials. At the same time, compared with other gases tested, formaldehyde has a strong reducibility, so that it can be selectively detected at a lower temperature.
437). Furthermore, the actual minimum detectable concentration of 0.5%Co-SnO2 NPs is as low as 40 ppb, which exceeds the requirements for formaldehyde detection in the World Health Organization (WHO) guidelines. The significant improvement of 0.5%Co-SnO2 NPs gas performance can be attributed to the following aspects: firstly, cobalt doping effectively improves the resistance of SnO2 NPs in the air; moreover, doping creates more defects and oxygen vacancies, which is conducive to the adsorption and desorption of gases. In addition, the crystal size of SnO2 NPs is vastly small and has unique physical and chemical properties of zero-dimensional materials. At the same time, compared with other gases tested, formaldehyde has a strong reducibility, so that it can be selectively detected at a lower temperature.
1. Introduction
With the aggravation of environmental pollution, the detection of harmful gases has become a vital research field. The WHO guidelines determine that the concentration of formaldehyde in indoor living areas should not exceed 82 ppb.1 Therefore, it is important to detect formaldehyde efficiently and accurately. Metal oxide gas sensors are widely studied because of their portability and low cost.2–4 In the case of metal oxide gas sensors, zero-dimensional metal oxide materials (such as quantum dots,5 nanoparticle clusters6) are attracting attention for their unique high gas sensitivity and other superior physical or chemical properties.Oxygen molecules in the air are adsorbed on the surface of metal oxides to generate adsorbed oxygen, thereby forming a depletion layer on the surface of the materials. According to a momentous characteristic,7 when the grain size of the zero-dimensional metal oxide is less than or close to two times of the thickness of the depletion layer, the gas sensitivity of the material will be greatly enhanced. The SnO2 ultrafine nanoparticles are typical zero-dimensional materials and are commonly used in the study of gas sensors,8 supercapacitors9 and batteries.10 Zhu et al.11 synthesized SnO2 quantum dots with a size of 2–4 nm by using microwave assisted method, the sensor made by counterpart had a response value of 215 to 300 ppm ethanol, but did not show its selectivity. Du et al.12 used the conventional hydrothermal synthesis method to prepare SnO2 quantum dots, and controlled the grain size of the quantum dots by regulating the addition amount of hydrazine. Among them, TQD-1 (average particle size 2.5 nm) revealed a high response to 100 ppm of triethylamine at 240 °C. Nevertheless, its selectivity was poor, and ethanol was the most serious interfering gas.11–13
Although the pure SnO2 zero-dimensional materials in the gas sensor show higher response, there are still some shortcomings, which mainly highlight that the ultra-fine nanoparticles enhance the activity of the materials, leading to the instability of electrical resistance and poor selectivity to various gases, etc. Therefore, researchers are committed to improving sensor performance through various methods. Noble metal functionalization,14 constructing heterojunctions15 and element doping16 can usually improve the gas sensing performance of the sensor. Noteworthy, doping with metal impurities is one of the most effective ways to increase surface crystal lattice defect and oxygen vacancies, which could to improve the gas sensing properties.17 Wang et al.18 demonstrated that SnO2 composites by doped with Ce-dopant could improve gas sensing properties to ethanol, which could be attributed to the unique advantages of Ce elemental doping. Gu and co-workers19 have obtained the In and Au doped SnO2 inverse opal thin films, which enhanced the sensing properties with a response of 308 to 100 ppm of ethanol compared with the pure SnO2. Moreover, the optimum operating temperature was decreased from 350 °C to 250 °C, and the response/recovery time was shortened obviously by 0.25% Au doping. They indicated that the doping of In and Au contributed to the increase of the adsorbed oxygen amounts which benefited the enhancement of the sensing performance. As a transition metal, Co was used as effective substitute and also for improving gas sensing properties. Chen et al.20 investigated properties of formaldehyde and acetone sensors based on Co-doped SnO2 with significant enhancement in the gas sensing performance by the elevation of the Fermi level and the narrowing of the band gap effect. Wang et al.17 have synthesized Co-doped In2O3 nanorods, and the enhancement of the gas response was attributed to the incorporation of Co, which suggested the important role of the amount of oxygen vacancies and adsorbed oxygen in enhancing sensing performance of In2O3 sensors. Therefore, Co-doped SnO2 are expected to enhance the gas sensing properties.
In this study, cobalt doping was used to improve the gas properties of SnO2 nanoparticles (SnO2 NPs), which is simple and low-cost to prepare and can retain the unique physical and chemical properties of SnO2 zero-dimensional materials. Cobalt-doped SnO2 NPs (Co-SnO2 NPs) have been successfully synthesized and the research results demonstrate that the sensing performance can be effectively enhanced by adjusting the grain size and resistance of SnO2via controlling the cobalt doping ratio. Furthermore, the gas sensor based on 0.5% cobalt-doped SnO2 nanoparticles (0.5%Co-SnO2 NPs) is also determined to achieve optimum gas performance at 30 ppm formaldehyde and operating temperatures as low as 90 °C, which shows incredible response, whose value is as high as 163![[thin space (1/6-em)]](https://www.rsc.org/images/entities/char_2009.gif) 437. This value is nearly 220 times higher than that of pure SnO2 NPs, and 0.5%Co-SnO2 NPs also exhibits inconceivable selectivity thus it has a high application potential.
437. This value is nearly 220 times higher than that of pure SnO2 NPs, and 0.5%Co-SnO2 NPs also exhibits inconceivable selectivity thus it has a high application potential.
2. Experimental sections
2.1 Chemical agents
Stannic chloride (SnCl4·5H2O), cobaltous nitrate hexahydrate (Co(NO3)2·6H2O), hydrazine hydrate (N2H4·H2O, 80%), were purchased from Aladdin Bio-Chem Technology Co. Ltd. All chemicals are analytical grade and can be used directly without further purification. The solvent is deionized water.2.2 Synthesis process
2.3 Characterization of materials
The crystal structures of the samples were analyzed by X-ray diffraction with Cu Kα1 radiation (λ = 1.54059). The Raman spectrum was measured from 100 to 900 cm−1 (inVia reflex Raman spectrometer, laser radiation: λ = 532 nm). The chemical composition and elemental valence of the materials were examined by X-ray photoelectron spectroscopy (XPS) (K-Alpha spectrometer, Thermo Fisher Scientific Co. Ltd) with Al Kα excitation (1486.6 eV). The particle size and elemental mapping of the prepared samples were observed using a TEM (Tecnai G2 TF30 S-Twin transmission electron microscope with an acceleration voltage of 300 kV). The surface area was measured by the nitrogen adsorption isotherm using the Brunauer–Emmett–Teller (BET) method, and the pore size distribution was estimated by the Barrett–Joyner–Halenda (BJH) method. The steady-state photoluminescence (PL) emission spectra are obtained by direct detection of powder samples via a fluorescence spectrometer (FL4500, Japan) with excitation wavelength of 325 nm. The electron spin resonance (EPR) spectroscopy was performed on Bruker EMX to detect the unpaired electrons of samples powder at 100 K (the EPR signals are poor at room and higher temperatures for the cobalt ion due to very short spin-lattice relaxation times which broaden the lines considerably, making it difficult to study the temperature variation of cobalt spectrum).2.4 Fabrication and measurement of gas sensors
The sensor used in the experiment is thick film type. A platinum circuit is plated on the surface of the rectangular ceramic substrate, and two electrodes are formed on the bottom of the substrate. Through these two electrodes, the test device (SD-101 gas sensing performance testing device, Wuhan Huachuang Ruike Tech. Co. Ltd., Wuhan, China) can control the test temperature by regulating the heating power. In this experiment, the prepared sample was mixed with printing oil in a mass ratio of 1![[thin space (1/6-em)]](https://www.rsc.org/images/entities/char_2009.gif) :
:![[thin space (1/6-em)]](https://www.rsc.org/images/entities/char_2009.gif) 1 and ground uniformly. Then the paste was printed on the circular area on the top of the sensor by screen printing technique. Finally, the prepared sensors were annealed in the muffle furnace for 2 hours. The sensing properties were evaluated by HCRK-SD101 static gas distribution system (Fig. S1,† Wuhan HCRK Technology Co. Ltd.). The prepared sensors were installed in the test chamber (2.7 L) and then and inject a quantitative liquid (calculation of the concentration when the organic volatile liquid is converted into gaseous VOCs) into the evaporator of the closed chamber to produce a corresponding concentration of gas. Humidity control is to pass atomized water vapor into the cavity. The instrument has a humidity detection function, and the test is performed after the humidity in the cavity is relatively stable. In this work, the response is defined as S = Ra/Rg (n-type semiconductor), where Ra represents the resistance of the device in the air and Rg represents the resistance of the sensor in the target gas. And the response time and recovery time are defined as the time required for 90% of the total resistance change during gas adsorption and desorption, respectively. Unless otherwise noted, all tests in this article were tested in a dry environment.
1 and ground uniformly. Then the paste was printed on the circular area on the top of the sensor by screen printing technique. Finally, the prepared sensors were annealed in the muffle furnace for 2 hours. The sensing properties were evaluated by HCRK-SD101 static gas distribution system (Fig. S1,† Wuhan HCRK Technology Co. Ltd.). The prepared sensors were installed in the test chamber (2.7 L) and then and inject a quantitative liquid (calculation of the concentration when the organic volatile liquid is converted into gaseous VOCs) into the evaporator of the closed chamber to produce a corresponding concentration of gas. Humidity control is to pass atomized water vapor into the cavity. The instrument has a humidity detection function, and the test is performed after the humidity in the cavity is relatively stable. In this work, the response is defined as S = Ra/Rg (n-type semiconductor), where Ra represents the resistance of the device in the air and Rg represents the resistance of the sensor in the target gas. And the response time and recovery time are defined as the time required for 90% of the total resistance change during gas adsorption and desorption, respectively. Unless otherwise noted, all tests in this article were tested in a dry environment.
3. Results and discussion
3.1 Structural and morphological characteristics
As shown in Fig. 1(a), X-ray diffraction analysis was performed on the four prepared samples to determine the chemical composition and the crystal phase. The purple curve at the bottom of the spectrum represents pure SnO2 NPs, and it can be seen that all the peaks of the curve correspond to the standard PDF card (JCPDS 71-0652). The other three samples contained 0.5%, 1%, and 2% molar ratio of cobalt, are similar to pure SnO2 NPs, no significant Co3O4 or other Co-containing compounds, such as CoO, are found. Therefore, it can be inferred that cobalt is doped into the SnO2 NPs crystal. In addition, as shown in Fig. 1(b), a high angle shift was detected from the (110) peak via comparing the Co-doped SnO2 with pure SnO2. This could be ascribed to the difference between the radius of Sn4+ (0.81 Å) and Co2+ (0.72 Å) or Co3+ (0.62 Å), confirming that Co is incorporated into the SnO2 lattice.22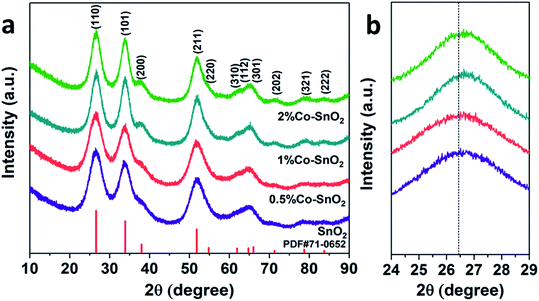 | ||
| Fig. 1 (a) Full angle range of XRD patterns and (b) high-resolution of (110) peak of the pure, 0.5%, 1% and 2% Co-doped SnO2 NPs. | ||
Moreover, the average crystallite size of the prepared samples is calculated by using Scherer's equation:
D = Kλ/β![[thin space (1/6-em)]](https://www.rsc.org/images/entities/char_2009.gif) cos cos![[thin space (1/6-em)]](https://www.rsc.org/images/entities/char_2009.gif) θ θ | (1) |
The Raman spectra of the samples are shown in Fig. S2.† It can be seen from XRD analysis that the as-prepared SnO2 NPs have a typical tetragonal rutile structure, and the corresponding space group is D4h14 (P42/mnm). The mechanical representation of the normal modality of the Brillouin zone is as follows:
| Γ = Γ+1(A1g) + Γ+2(A2g) + Γ+3(B1g) + Γ+4(B2g) + Γ−5(Eg) + 2Γ−1(A2u) + 2Γ−2(B1u) + 4Γ+5(Eu) | (2) |
Generally, modes A1g, B1g, B2g, and Eg have Raman active, and A2u and Eu have infrared active. The peaks observed at 453.6 and 772.7 cm−1 correspond to the Eg and B2g modes, respectively. The Raman mode at 623.2 cm−1 is assigned to A1g. However, as the cobalt content increases, A1g gradually shifts to the high frequency region, and the 2%Co-SnO2 NPs curve shifts to 626.6 cm−1. The vibrational motion represented by the B1g mode is generally only present in single crystal SnO2, which is not common in polycrystals because the intensity is too weak.23 Similar to the A1g mode, the B1g mode has the same trend, shifting from pure SnO2 NPs (111.0 cm−1) to 2%Co-SnO2 NPs (114.4 cm−1). The peak at 574.5 cm−1 (D peak) is the only peak found in ultrafine nanoparticles, which is attributed to the optically inactive A2g mode.23 In addition, new peaks are observed at 310.9 and 357.9 cm−1, which are assigned to the IR active Eu (TO) and Eu (LO) modes, respectively. This is due to the increase in the disorder rate and the size effect causing the structural change, so the IR modes become weakly active.24 Interestingly, as the content of cobalt increases, the Raman peak intensity decreases accordingly, which indicates that the doping of cobalt leads to changes in local disorder and defects.25 And no peaks of the phase of CoO, Co3O4, SnO, etc. are observed.
In order to further confirm the composition and valence state of the surface of the samples, XPS detection was carried out. The full spectrum of the samples is shown in Fig. 2(a), which visually shows the existence of the Sn and O peaks. Fig. 2(b) shows the XPS spectrum of Sn. The purple curve represents pure SnO2 NPs with two distinct peaks at 495.0 eV and 486.7 eV, corresponding to Sn4+ 3d3/2 and Sn4+ 3d5/2, respectively.26,27 Besides, as the proportion of Co doping increases, it can be clearly found that the Sn 3d peak shifts significantly. This further confirms the successful doping of Co. Fig. 2(c) and (d) show high-resolution XPS spectra of Co and O 1s (SnO2 NPs and 0.5%Co-SnO2 NPs), respectively. There are obviously three peaks in the Co 2p3/2 diagram, and the peak at 785.8 eV is assigned to the shakeup satellite peak.28 In addition, the remaining two peaks are attributed to Co2+ and Co3+, respectively. The Co2+/Co3+ ratio of 0.5%, 1%, 2%Co-SnO2 NPs corresponds to 2.02, 1.64, 1.22, which indicates that the Co2+ ratio decreases as the amount of Co incorporation increases.29–31 The peak of O 1s in Fig. 2(d) reveals the presence and content of various types of oxygen on the surface of SnO2 NPs and 0.5%Co-SnO2 NPs. O 1s can be fitted as three peaks of 530 eV, 531 eV and 532 eV, which are attributed to the lattice oxygen (O 1L) of SnO2, the oxygen vacancy (O 1V) and the adsorbed oxygen (O 1C) on the surface, respectively. Compared with SnO2 NPs, the O 1V and O 1C ratio of 0.5%Co-SnO2 NPs is increased, and the proportion of O 1L gradually decreases, which mainly due to the successful doping of Co. The increase of O 1V leads to more active sites in the material, thereby improving gas sensing performance. When the doping amount of Co is further increased, the amount of O 1V is significantly reduced, which may be due to the combination of Co atoms and oxygen vacancies.32
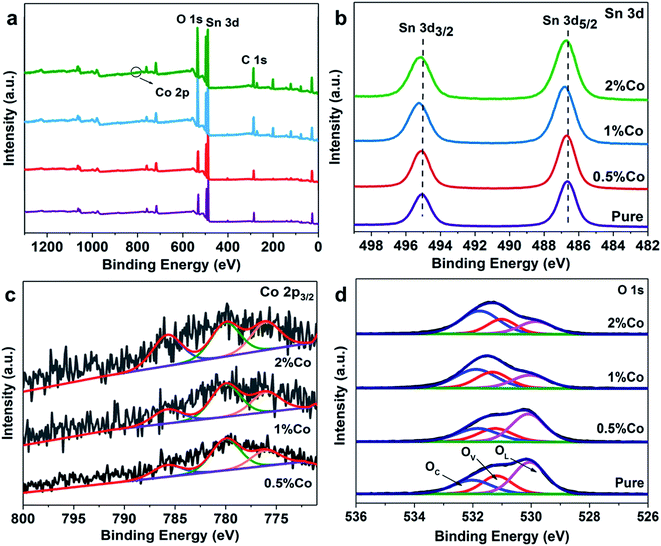 | ||
| Fig. 2 (a) XPS survey spectra, (b) Sn 3d spectra, (c) Co 2p3/2 spectra and (d) O 1s spectra of the pure and Co-doped SnO2 NPs. | ||
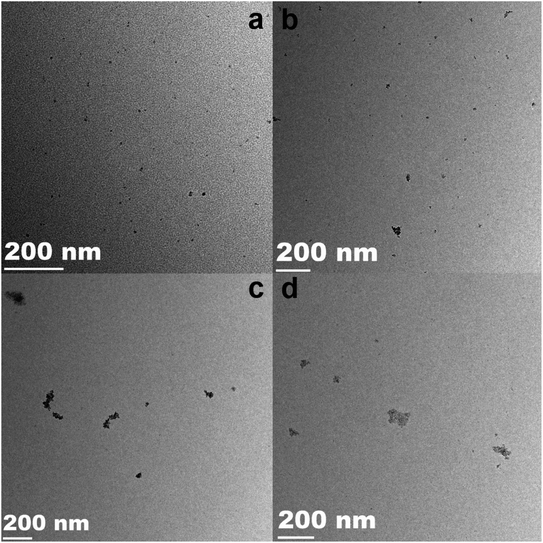
TEM observations were performed to analyze the structure and distribution of the samples. The TEM images of pure SnO2 NPs, 0.5%Co-SnO2 NPs, 1%Co-SnO2 NPs and 2%Co-SnO2 NPs are depicted in Fig. 3(a)–(d), which can be clearly found that as the proportion of cobalt increases, the particles become more agglomerated from the comparison of the four images.
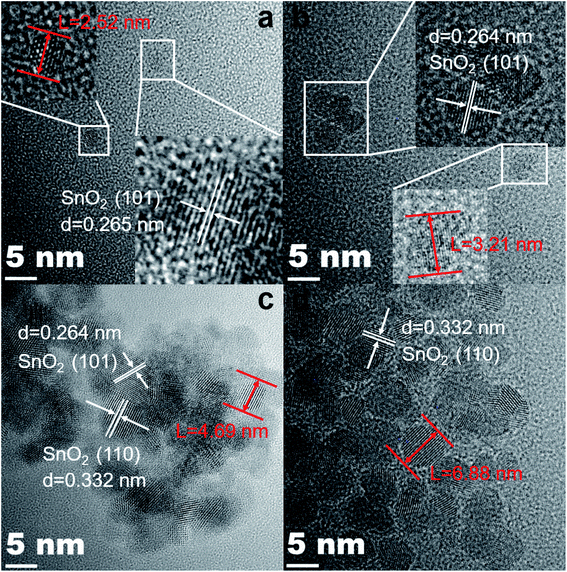
And Fig. 4(a)–(d) are the HRTEM images of the corresponding samples. As shown in Fig. 4(a), the interplanar spacing in the lower right inset is 0.265 nm, which corresponds to the (101) lattice plane in the SnO2 PDF card. In addition, its particle size is only 2.52 nm. The lattice distances are 0.264 nm and 0.332 nm, which correspond to the (101) and (110) crystal faces of SnO2 in Fig. 4(b)–(d), respectively. In addition, it is extremely obvious that the size of the particles is growing and becoming more agglomerated. The 0.5%Co-SnO2 NP size is 3.21 nm, whereas 1%Co-SnO2 NPs and 2%Co-SnO2 NPs have grown to 4.69 nm and 6.88 nm, respectively. This result is consistent with the Raman analysis.
The prepared all samples were carried out nitrogen adsorption–desorption detection in Fig. 5(a)–(d). With the increase of the amount of cobalt, the sample shows a tendency to close to the H1 hysteresis loops. The surface areas of SnO2 NPs, 0.5%Co-SnO2 NPs, 1%Co-SnO2 NPs and 2%Co-SnO2 NPs measured by BET are 49.8, 51.6, 60.5 and 72.3 m2 g−1, respectively. The increase of specific surface area can provide more adsorption sites, which helps to improve the gas sensing performance. The pore size distribution of each sample is present in the corresponding inset. As can be seen from the inset, cobalt doping has little effect on the pore size distribution of the SnO2 samples. The large specific surface area contribute to gas diffusion and adsorption of oxygen, thereby improving gas sensing performances.
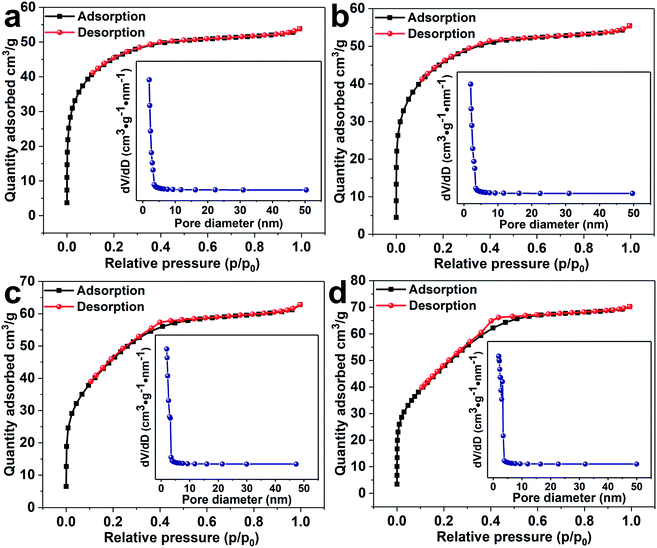 | ||
| Fig. 5 Nitrogen adsorption–desorption isotherms and corresponding pore size distribution (inset) of (a) SnO2 NPs, (b) 0.5%Co-SnO2 NPs, (c) 1%Co-SnO2 NPs and (d) 2%Co-SnO2 NPs. | ||
3.2 Gas-sensing characteristics
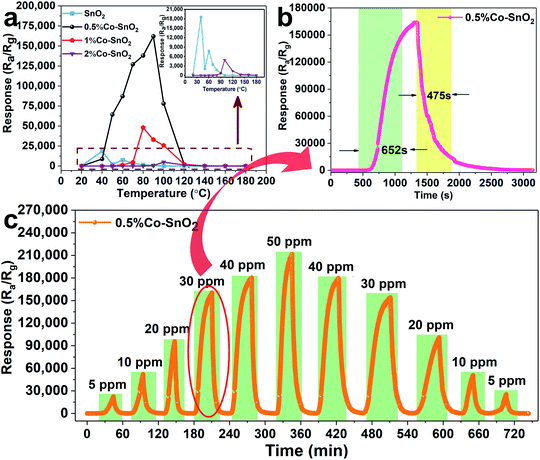
Fig. 6(a) exhibits the relationship between temperature and response of gas sensors based on SnO2 NPs, 0.5%Co-SnO2 NPs, 1%Co-SnO2 NPs and 2%Co-SnO2 NPs at low operating temperature (20–180 °C). And the inset is an enlarged view of the pure SnO2 NPs and 0.5%Co-SnO2 NPs curves. Obviously, the response of cobalt-added samples increase significantly compared to pure SnO2 NPs, and the response of 0.5%Co-SnO2 NPs is vastly higher than that of other samples. As the temperature increases, the response of 0.5%Co-SnO2 NPs gradually increases, but starts to decrease after 90 °C. And at the optimum working temperature (90 °C), the response of 0.5%Co-SnO2 NPs (163![[thin space (1/6-em)]](https://www.rsc.org/images/entities/char_2009.gif) 437) is nearly 220 times higher than that of pure SnO2 NPs (739). Even the 1%Co-SnO2 NPs has a response value of 33
437) is nearly 220 times higher than that of pure SnO2 NPs (739). Even the 1%Co-SnO2 NPs has a response value of 33![[thin space (1/6-em)]](https://www.rsc.org/images/entities/char_2009.gif) 000 at 90 °C. Thus, the 0.5%Co-SnO2 NPs highlight the extremely high response to formaldehyde and low operating temperatures, which demonstrates its excellent gas sensing performance.
000 at 90 °C. Thus, the 0.5%Co-SnO2 NPs highlight the extremely high response to formaldehyde and low operating temperatures, which demonstrates its excellent gas sensing performance.
Fig. 6(b) shows the response and recovery curve of the sensor based on 0.5%Co-SnO2 NPs to 30 ppm formaldehyde at the optimum operating temperature, which corresponds to the part marked by the red oval in Fig. 6(c). In this work, the ultra-high response results in long response and recovery times. The response time and recovery time are 652 s and 475 s, respectively. Fig. 6(c) presents the dynamic response and recovery curves of the 0.5%Co-SnO2 NPs based sensor for different concentrations of formaldehyde at the optimum operating temperature. Obviously, as the concentration of formaldehyde increases, the response of the sensor also increases. For comparison with 0.5%Co-SnO2 NPs, as shown in Fig. S3,† the gas properties of the remaining three samples at different concentrations of formaldehyde at 90 °C were supplemented. Fig. S3† indicates that although the response of 1%Co-SnO2 NPs is lower than 0.5%Co-SnO2 NPs, it is still higher than pure SnO2 NPs. However, the overall response of 2%Co-SnO2 NPs is less than that of pure SnO2 NPs. That is, the response of the sample increases firstly and then decreases with the increase of cobalt ratio. In addition, compared with Fig. 6(c), it can be found that the response and recovery time are increasing with the raise of cobalt content in SnO2 NPs. Therefore, the gas properties of the sample vary significantly with cobalt doping.
In order to analyze the influence of the material composition change caused by Co doping on the sensor resistance, relevant tests were carried out. Fig. S4(a)† shows that as the temperature increases, the resistance in air (Ra) of SnO2 drops rapidly and then tends to be flat. The difference from SnO2 is that the resistance curves of other samples have changed significantly due to the addition of Co. The Ra curve first increases and then decreases with the increase of temperature. Fig. S4(b)† is the change curves of resistance when the samples adsorb and desorb 30 ppm formaldehyde at 90 °C. The activity of 0.5%Co-SnO2 NPs is excellent, and the resistance decline trend is the most obvious under the same conditions.
In practical application, the detection standard of formaldehyde is often required to reach the ppb level, so the gas sensing properties of 0.5%Co-SnO2 NPs are tested under ultra-low concentration of formaldehyde. Fig. 7(a) depicts the transient response curve of 0.5%Co-SnO2 NPs from 1 ppm to 40 ppb of formaldehyde at the optimum operating temperature of 90 °C. It can be found that the sensor has a high response of 294 even when exposed to formaldehyde gas with a concentration of 40 ppb. This indicates that 0.5%Co-SnO2 NPs is of high practical value. Moreover, in order to further determine its application value, the limit of detection (LOD) that the sensor can achieve is analyzed from the theoretical level, and the corresponding calculation process is found in the ESI.† And by calculation, the limit of detection is 0.0001 ppb. The results of gas sensitivity test and theoretical calculation show that the 0.5%Co-SnO2 NPs has excellent performance. In addition, the long-term stability curve of the 0.5%Co-SnO2 NPs is depicted in Fig. 7(b). The test is conducted every two days for 15 days under conditions of 30 ppm formaldehyde and 90 °C. It is clear that within 15 days, the response change does not exceed 3.1%, which reflects the excellent long-term stability of the 0.5%Co-SnO2 NPs. The excellent long-term stability of 0.5%Co-SnO2 is mainly due to Co doping.17
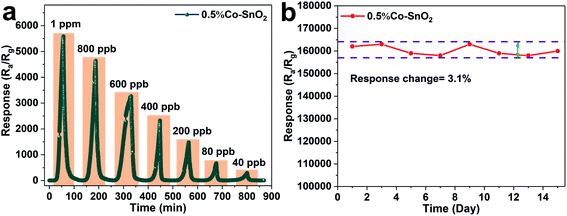 | ||
| Fig. 7 (a) The response transients of 0.5%Co-SnO2 NPs to ultra-low concentrations of formaldehyde, (b) long-term stability of 0.5%Co-SnO2 NPs to 30 ppm formaldehyde at 90 °C. | ||
It is well known that the ability to selectively detect a particular gas is an important requirement for the practical application of the sensor. Thus, the responses of four sensors to various gases are compared at 90 °C and 30 ppm as shown in Fig. 8(a)–(d) to assess their selectivity.
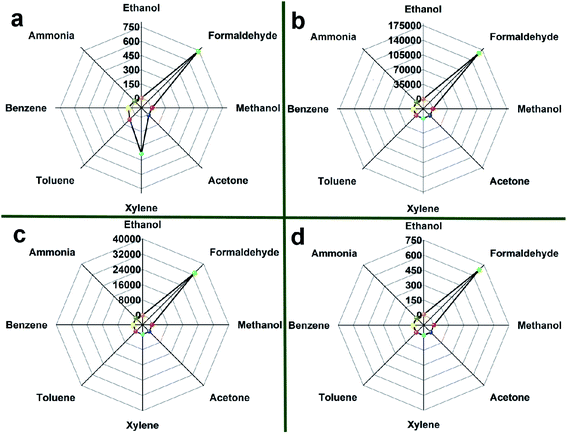 | ||
| Fig. 8 Responses of (a) SnO2 NPs, (b) 0.5%Co-SnO2 NPs, (c) 1%Co-SnO2 NPs and (d) 2%Co-SnO2 NPs to 30 ppm of various gases at 90 °C. | ||
In Fig. 8(a), when the SnO2 NPs is exposed to 30 ppm of various gases, it has high response to several gases. The response values of xylene and benzene are 384 and 72.9, respectively. Therefore, the selectivity of SnO2 NPs is poor, and the ratio of S(formaldehyde)/S(xylene) is only 1.92. The selectivity of the 2%Co-SnO2 NPs shown in Fig. 8(d) is improved. The strongest disturbing gas is ethanol with a response value of 7.4, besides the ratio of S(formaldehyde)/S(ethanol) is also raised to 91.9. Nevertheless, the selectivity of the 0.5%Co-SnO2 NPs and the 1%Co-SnO2 NPs is more prominent. In Fig. 8(c), the response of 1%Co-SnO2 NPs to gases other than formaldehyde is only 2.16. The best selectivity is 0.5%Co-SnO2 NPs, and the S(formaldehyde)/S(xylene) ratio is raised to an incredible degree (16![[thin space (1/6-em)]](https://www.rsc.org/images/entities/char_2009.gif) 902), even exceeding the ratio of S(formaldehyde)/S(ethanol) (15
902), even exceeding the ratio of S(formaldehyde)/S(ethanol) (15![[thin space (1/6-em)]](https://www.rsc.org/images/entities/char_2009.gif) 417) for 1%Co-SnO2 NPs. This work is compared with the materials reported in the current literature. As described in Table 1, 0.5%Co-SnO2 NPs are far superior to other materials in terms of response, operating temperature and selectivity.
417) for 1%Co-SnO2 NPs. This work is compared with the materials reported in the current literature. As described in Table 1, 0.5%Co-SnO2 NPs are far superior to other materials in terms of response, operating temperature and selectivity.
| Materials | Conc. (ppm) | T (°C) | Response | Ref. |
|---|---|---|---|---|
| IO-(Ga0.2In0.8)2O3 | 100 | 200 | 48.8 | 33 |
| 5.0 at% Ni-doped SnO2 | 50 | 200 | 104 | 34 |
| In2O3/1%Co | 10 | 130 | 23.2 | 17 |
| LSCM@SnO2 FITs | 5 | 400 | 26.5 | 35 |
| SnO2 NF/NSs | 100 | 120 | 57 | 36 |
| 6%-Ag/Ni5.0In | 100 | 160 | 123.97 | 37 |
| 3% In2O3–SnO2 nanospheres | 100 | 100 | 30.7 | 38 |
| In2O3 hierarchical architecture | 100 | 260 | 8.6 | 39 |
| Cu2O quadruple shells | 200 | 120 | 9.6 | 40 |
| 0.5%Co-SnO2 NPs | 30 | 90 | 163![[thin space (1/6-em)]](https://www.rsc.org/images/entities/char_2009.gif) 437 437 |
This work |
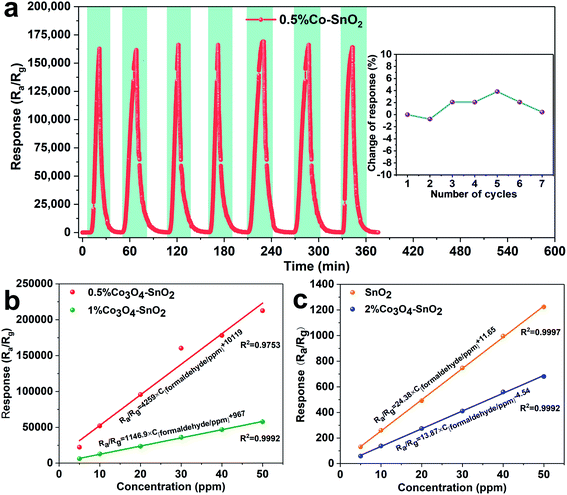
Repeatability is one of the indispensable sensing characteristics of sensors. Fig. 9(a) exhibits the response transients and deviations for the seven consecutive cycles of 0.5%Co-SnO2 NPs. The sensor is exposed to 30 ppm of formaldehyde at 90 °C, and all 7 responses are close to 160![[thin space (1/6-em)]](https://www.rsc.org/images/entities/char_2009.gif) 000. The corresponding response deviation is only 3.8% as shown in the inset, which indicates that the 0.5%Co-SnO2 NPs shows excellent reproducibility to formaldehyde. The linear fit curves between the concentration and response of 0.5%Co-SnO2 NPs and 1%Co-SnO2 NPs are shown in Fig. 9(b). Similarly, the linear fit curves of SnO2 NPs and 2%Co-SnO2 NPs are shown in Fig. 9(c). It is obvious that they are all typical linear relationships, and the response increases linearly as the concentration increases.
000. The corresponding response deviation is only 3.8% as shown in the inset, which indicates that the 0.5%Co-SnO2 NPs shows excellent reproducibility to formaldehyde. The linear fit curves between the concentration and response of 0.5%Co-SnO2 NPs and 1%Co-SnO2 NPs are shown in Fig. 9(b). Similarly, the linear fit curves of SnO2 NPs and 2%Co-SnO2 NPs are shown in Fig. 9(c). It is obvious that they are all typical linear relationships, and the response increases linearly as the concentration increases.
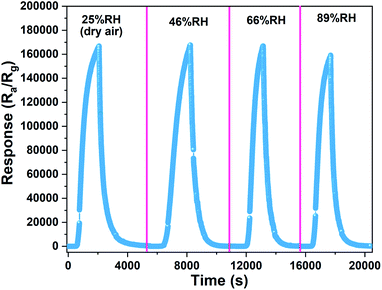
To compare the gas-sensing performance of 0.5%Co-SnO2 NPs under different humidity conditions, the gas-sensing behaviors under different humidity are measured. As shown in Fig. 10, it is found that the response decreases slightly from dry air to 89% RH. One reason may be that Co doping promotes the dissociation of water vapor on the surface, and the water molecules participates in the surface reaction of the material. For example, the H+ dissociated from the water interacts with the oxygen species of the material.
3.3 Gas-sensing mechanism
At present, the gas-sensing mechanism of metal oxide semiconductor gas sensors is usually explained by the adsorption and desorption of gas on the surface of the materials, which leads to the migration of charge carriers in the semiconductor.41,42 The SnO2 NPs is a typical n-type semiconductor. When free oxygen in the air is adsorbed on the surface of SnO2 NPs, it will absorb electrons from its conduction band to form adsorbed oxygen ions (O2−, O−, O2−), thus increasing the resistance of SnO2 NPs. According to the literature, when the temperature is below 100 °C, the main form of oxygen ion is O2−. Therefore, the reaction can be expressed as follows:41,43| HCHO(gas) → HCHO(ads) + O2(adsorbed)− → CO2(gas) + H2O(gas) + e− | (3) |
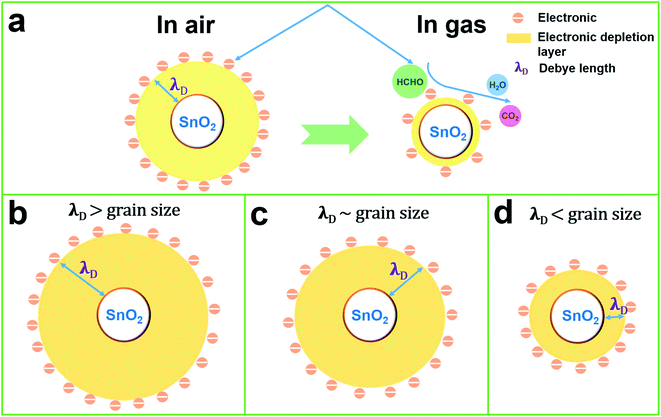
When O2− reacts with formaldehyde, electrons are released back into the conduction band of SnO2 NPs, and the resistance of SnO2 NPs decreases. The cross-sectional view of the induction mechanism of SnO2 NPs in air and formaldehyde is shown in Fig. 11(a). The operating mechanism of SnO2 NPs can be intuitively understood by the change of the thickness of the electronic depletion layer on the surface.
When Co is incorporated, Co2+ and Co3+ ions can replace Sn4+ sites in the surface and lattice. According to the Kröger–Vink, the defect reactions are as follows:44,45
 | (4) |
 | (5) |
Formula (4) process generates new oxygen vacancies, while formula (5) process generates positively charged holes that will recombine with existing electrons, resulting in an increase in resistance Ra. In n-type semiconductors, higher Ra values are more likely to have higher responses. However, as the Co content in the sample increases, the grain growth and agglomeration become more and more intense, and the activity of the material decreases greatly. This limits the adsorption and separation of gas on the surface of the material, thereby reducing the gas sensing performance of the sensor, and can be analyzed from the thickness of the depletion layer. In this mechanism analysis, it is assumed that the thickness of the surface depletion layer is approximately the Debye length of the material.7,46,47 Estimated by the following formula:7,46,48,49
 | (6) |
We further performed photoluminescence (PL) and electron paramagnetic resonance (EPR) characterizations which are two typical strategy for identifying oxygen vacancies.51–53Fig. 12(a) shows the PL spectra of the as-obtained samples. It can be clearly seen that the emission peaks are located near 350–600 nm, which are due to the rearrangement of holes with two-electron-trapped oxygen vacancies.54 A stronger peak means more oxygen vacancies. The 0.5%Co-SnO2 sample shows higher intensity, which demonstrates that it has more oxygen vacancies. The large PL intensity of 0.5%Co-SnO2 can be associated with the synergistic effect of Co doping. Furthermore, the excellent response value of 0.5%Co-SnO2 might be due to the increase in oxygen vacancies density, testified by the intensity of the PL peaks. The lattice oxygen is released and the neutral oxygen vacancy is produced at the initial location, which confirmed the XPS analysis (Fig. 2(d)). Moreover, EPR was used to further prove the existence of the oxygen vacancies (Fig. 12(b)). The symmetric resonance signals of these samples centered at the position (g = 2.003) correspond to the oxygen vacancies.53 The concentration of oxygen vacancies in 0.5%Co-SnO2 is much higher than that of SnO2 NPs. Oxygen vacancies can provide more unpaired electrons for gas-sensing materials, and further bring more adsorbed oxygen ions on the surface, resulting in the enhanced response. EPR results is consistent with the XPS result. It is worth noting that as the amount of Co doping increases, the amount of oxygen vacancies is significantly reduced, which may be due to the combination of Co atoms and oxygen vacancies.32
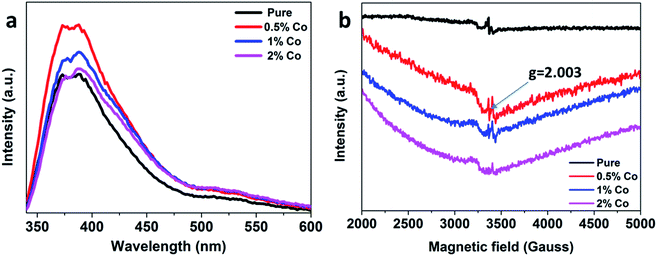 | ||
| Fig. 12 (a) Photoluminescence spectra and (b) electron paramagnetic resonance spectra of SnO2 NPs, 0.5%Co-SnO2, 1%Co-SnO2 and 2%Co-SnO2. | ||
4. Conclusions
In summary, 0.5%Co-SnO2 NPs were synthesized by simple hydrothermal method, and it is a typical n-type oxide semiconductor, based on which the gas sensor can selectively detect formaldehyde gas at 90 °C. At 90 °C, the response to 30 ppm formaldehyde reaches an astonishing 163![[thin space (1/6-em)]](https://www.rsc.org/images/entities/char_2009.gif) 437, and is enhanced with the increase of concentration. In addition, the gas sensing mechanism was analyzed. Due to cobalt doping, the resistance Ra of SnO2 NPs in the air is improved, and the cobalt doping ratio can be adjusted by Debye length to change the grain size of the sample particles, so that the prepared sample achieves the best performance. The preparation of 0.5%Co-SnO2 NPs is simple and has high performance. Hence, 0.5%Co-SnO2 NPs could considered as a great potential candidate for formaldehyde gas sensors in practical application.
437, and is enhanced with the increase of concentration. In addition, the gas sensing mechanism was analyzed. Due to cobalt doping, the resistance Ra of SnO2 NPs in the air is improved, and the cobalt doping ratio can be adjusted by Debye length to change the grain size of the sample particles, so that the prepared sample achieves the best performance. The preparation of 0.5%Co-SnO2 NPs is simple and has high performance. Hence, 0.5%Co-SnO2 NPs could considered as a great potential candidate for formaldehyde gas sensors in practical application.
Conflicts of interest
The authors declare no conflict of interest.Acknowledgements
This work was supported by National Natural Science Foundation of China (No. 51562038) and Key Project of Natural Science Foundation of Yunnan (2018FY001(-011)). We also acknowledge analysis support from the Advanced Analysis and Measurement Center of Yunnan University.References
- A. Allouch, M. Guglielmino, P. Bernhardt, C. Serra and S. Le Calvé, Sens. Actuators, B, 2013, 181, 551–558 CrossRef CAS.
- G. Bae, I. Jeon, M. Jang, W. Song, S. Myung, J. Lim, S. Lee, H. Jung, C.-Y. Park and K.-S. An, ACS Appl. Mater. Interfaces, 2019, 11, 16830–16837 CrossRef CAS PubMed.
- D. Yang, I. Cho, D. Kim, M. Lim, Z. Li, J. Ok, M. Lee and I. Park, ACS Appl. Mater. Interfaces, 2019, 11, 24298–24307 CrossRef CAS PubMed.
- S. Vallejos, T. Vilic, P. Umek, C. Navío, C. Bittencourt, E. Llobet, C. Blackman, S. Moniz and X. Correig, Chem. Commun., 2011, 47, 565–567 RSC.
- S. Yang, Z. Song, N. Gao, Z. Hu, L. Zhou, J. Liu, B. Zhang, G. Zhang, S. Jiang, H.-Y. Li and H. Liu, Sens. Actuators, B, 2019, 286, 22–31 CrossRef CAS.
- X. Liu, N. Chen, B. Han, X. Xuechun, G. Chen, I. Djerdj and Y. Wang, Nanoscale, 2015, 7, 14872–14880 RSC.
- Y. Kwon, H. Na, S. Kang, M. Choi, J. Bang and T. Kim, Sens. Actuators, B, 2016, 239, 180–192 CrossRef.
- J. Hu, H. Wang, M. Chen, Y. Zhang, X. Zhao, D. Zhang, Q. Lu, J. Zhang and Q. Liu, Mater. Lett., 2019, 263, 126843 CrossRef.
- X. Hong, S. Li, R. Wang and J. Fu, J. Alloys Compd., 2018, 775, 15–21 CrossRef.
- X. Jiang, Y. Xiong, Z. Zhang, Y. Rong, A. Mei, C. Tian, J. Zhang, Y. Zhang, Y. Jin, H. Han and Q. Liu, Electrochim. Acta, 2018, 263, 134–139 CrossRef CAS.
- L. Zhu, W. Mengyun, T. Lam, C. Zhang, H. Du, B. Li and Y. Yao, Sens. Actuators, B, 2016, 236, 646–653 CrossRef CAS.
- J. Du, R. Zhao, Y. Xie and J. Li, Appl. Surf. Sci., 2015, 346, 256–262 CrossRef CAS.
- B. Zhang, M. Li, Z. Song, H. Kan, H. Yu, Q. Liu, G. Zhang and H. Liu, Sens. Actuators, B, 2017, 249, 558–563 CrossRef CAS.
- Y. Wang, Z. Zhao, Y. Sun, P. Li, J. Ji, Y. Chen, W. Zhang and J. hu, Sens. Actuators, B, 2017, 240, 664–673 CrossRef CAS.
- M. Poloju, N. Jayababu, M. Elayaperumal and M. V. Reddy, J. Mater. Chem. C, 2017, 6, 2662–2668 RSC.
- J. Zhang, F. Xie, L. Yang, S. Guo, Y. Xiong and S. Zhang, Sens. Actuators, B, 2021, 340, 129810–129819 CrossRef CAS.
- Z. Wang, C. Hou, Q. De, F. Gu and D. Han, ACS Sens., 2018, 3, 468–475 CrossRef CAS PubMed.
- Y. Wang, H. Li, D. Huang, X. Wang, L. Cai, Y. Chen, W. Wang, Y. Song, G. Han and B. Zhen, Mater. Sci. Semicond. Process., 2022, 137, 106188–106196 CrossRef CAS.
- F. Gu, H. Wang, D. Han and Z. Wang, Sens. Actuators, B, 2017, 245, 1023–1031 CrossRef CAS.
- K. Chen, Y. Zhou, R. Jin, T. Wang, F. Liu, C. Wang, X. Yan, P. Sun and G. Lu, Sens. Actuators, B, 2022, 350, 130807–130817 CrossRef CAS.
- D. Dutta Pathak and D. Bahadur, J. Mater. Chem., 2012, 22, 24545–24551 RSC.
- Z. Wang, C. Hou, Q. De, F. Gu and D. Han, ACS Sens., 2018, 3, 468–475 CrossRef CAS PubMed.
- D. Manikandan and R. Murugan, Superlattices Microstruct., 2015, 89, 7–14 CrossRef.
- V. Bonu, A. Das, A. K. Sivadasan, A. Tyagi and S. Dhara, J. Raman Spectrosc., 2015, 46, 1037–1040 CrossRef CAS.
- S. Kuchana, M. Vithal, S. Bojja, M. Raja and V. R. Paduru, J. Phys. Chem. C, 2009, 113, 3543–3552 Search PubMed.
- G. Li, X. Wang, L. Yan, Y. Wang and Z. Zhang, ACS Appl. Mater. Interfaces, 2019, 11, 26116–26126 CrossRef CAS PubMed.
- J. Huang, L. Wang, C. Gu, M. Zhai and J. Liu, CrystEngComm, 2013, 15, 7515–7521 RSC.
- R. Nie, J. Shi, W. Du, W.-S. Ning, Z. Hou and F.-S. Xiao, J. Mater. Chem. A, 2013, 1, 9037–9045 RSC.
- W. Tang, W. Xiao, S. Wang, Z. Ren, J. Ding and P.-X. Gao, Appl. Catal., B, 2018, 226, 585–595 CrossRef CAS.
- L. Chen, D. Jiancai, J. Jia, R. Ran, C. Zhang and X. Song, ACS Appl. Nano Mater., 2019, 2, 4417–4426 CrossRef CAS.
- G. Natu, P. Hasin, Z. Huang, Z. Ji, M. He and Y. Wu, ACS Appl. Mater. Interfaces, 2012, 4, 5922–5929 CrossRef CAS PubMed.
- R. S. Ningthoujam, D. Lahiri, V. Sudarsan, H. K. Poswal, S. K. Kulshreshtha, S. M. Sharma, B. Bhushan and M. D. Sastry, Mater. Res. Bull., 2007, 42, 1293–1300 CrossRef CAS.
- T. Wang, B. Jiang, Q. Yu, X. Kou, P. Sun, F. Liu, H. Lu, x. Yan and G. Lu, ACS Appl. Mater. Interfaces, 2019, 11, 9600–9611 CrossRef CAS PubMed.
- J. Hu, T. Wang, Y. Wang, D. Huang, G. He, Y. Han, N. Hu, Y. Su, Z. Zhou, Y. Zhang and Z. Yang, Sens. Actuators, B, 2018, 263, 120–128 CrossRef CAS.
- J.-Y. Kang, J.-S. Jang, W.-T. Koo, J. Seo, Y. Choi, M. H. Kim, D.-H. Kim, H.-J. Cho, W. Jung and I.-D. Kim, J. Mater. Chem. A, 2018, 6, 10543–10551 RSC.
- D. Wang, K. Wan, M. Zhang, H.-J. Li, P. Wang, X. Wang and J. Yang, Sens. Actuators, B, 2018, 283, 714–723 CrossRef.
- X. Zhang, D. Song, Q. Liu, R. Chen, J. Hou, J. Liu, H. Zhang, J. Yu, P. Liu and J. Wang, J. Mater. Chem. C, 2019, 7, 7219–7229 RSC.
- W. Ge, Y. Chang, V. Natarajan, Z. Feng, J. Zhan and X. Ma, J. Alloys Compd., 2018, 746, 36–44 CrossRef CAS.
- S. Wang, J. Cao, W. Cui, L. Fan and D. Li, Sens. Actuators, B, 2017, 255, 159–165 CrossRef.
- R. Zhang, X. Liu, T. Zhou and T. Zhang, J. Colloid Interface Sci., 2018, 535, 58–65 CrossRef PubMed.
- M. Chen, Y. Zhang, J. Zhang, K. Li, T. Lv, K. Shen, Z. Zhu and Q. Liu, J. Mater. Chem. C, 2018, 6, 6138–6145 RSC.
- Y. Zhang, Q. Rong, J. Zhao, J. Zhang, Z. Zhu and Q. Liu, J. Mater. Chem. A, 2018, 6, 12647–12653 RSC.
- G. Li, Z. Cheng, Q. Xiang, L. Yan and X. Wang, Sens. Actuators, B, 2018, 283, 590–601 CrossRef.
- G. Brankovic, Z. Brankovic, M. Davolos, M. Cilense and J. Varela, Mater. Charact., 2004, 52, 243–251 CrossRef CAS.
- M. Punginsang, A. Wisitsoraat, A. Tuantranont, S. Phanichphant and C. Liewhiran, Sens. Actuators, B, 2015, 210, 589–601 CrossRef CAS.
- Q. Xu, Z. Zhang, X. Song, S. Yuan, Z. Qiu, x. Hongyan and B. Cao, Sens. Actuators, B, 2017, 245, 375–385 CrossRef CAS.
- G. Korotcenkov, Mater. Sci. Eng., R, 2008, 61, 1–39 CrossRef.
- A. Katoch, S.-W. Choi, G.-J. Sun and S. Kim, J. Mater. Chem. A, 2013, 1, 13588–13596 RSC.
- F. Qu, J. Liu, Y. Wang, S. Wen, Y. Chen, X. Li and S. Ruan, Sens. Actuators, B, 2014, 199, 346–353 CrossRef CAS.
- G. Korotcenkov, Sens. Actuators, B, 2005, 107, 209–232 CrossRef CAS.
- H. Bi, L. X. Zhang, Y. Xing, P. Zhang, J. J. Chen, J. Yin and L. J. Bie, Sens. Actuators, B, 2021, 330, 129374–129385 CrossRef CAS.
- L. X. Zhang, G.-N. Li, Y.-Y. Yin, Y. Xing, H. Xu, J. J. Chen and L. J. Bie, Sens. Actuators, B, 2020, 325, 128805–128818 CrossRef CAS.
- G. N. Li, X. Y. An, L. X. Zhang, Y. Xing and L. J. Bie, Mater. Lett., 2022, 307, 131026–131029 CrossRef CAS.
- J. Bao, X. Zhang, B. Fan, J. Zhang, M. Zhou, W. Yang, X. Hu, H. Wang, B. Pan and Y. Xie, Angew. Chem., Int. Ed. Engl., 2015, 54, 7399–7404 CrossRef CAS PubMed.
Footnotes |
| † Electronic supplementary information (ESI) available. See DOI: 10.1039/d1na00625h |
| ‡ These authors contributed equally to this work. |
| This journal is © The Royal Society of Chemistry 2022 |

