Coincident measurement of photo-ion circular dichroism and photo-electron circular dichroism in 1-phenylethylamine†
Carl Stefan
Lehmann
,
Demian
Botros
and
Karl-Michael
Weitzel
 *
*
Fachbereich Chemie, Philipps-Universität Marburg, 35032 Marburg, Germany. E-mail: weitzel@chemie.uni-marburg.de
First published on 3rd June 2022
Abstract
Here, we report the coincident measurement of PICD and PECD effects in 1-phenylethylamine upon multiphoton ionization. Both photo-ion circular dichroism (PICD) and photo-electron circular dichroism (PECD) are methods to distinguish enantiomers. In PICD, a difference in total ion yields upon multiphoton ionization with circular polarized light is measured, whereas, in PECD, circular dichroism is observed in the angular distribution of the photoelectrons. Here, we report on our continuous effort to measure the PICD and PECD effects in coincidence, i.e. simultaneously under the same measurement conditions using a home-built photoion–photoelectron coincidence spectrometer. Pure samples of R-(+)-1-phenylethylamine and S-(−)-1-phenylethylamine have been photo-ionized using a femtosecond laser operated at 394 nm.
Introduction
Because the enantiomers of chiral molecules often have different pharmacological or biological properties, there is an ever ongoing drive for new or improved chiral identification techniques. Unfortunately, the chemical and physical properties of enantiomers are similar, thereby limiting the experimental possibilities of analysis and distinction of enantiomers to techniques that are sensitive to chirality.The currently available techniques for chirality analysis can be categorized into analytical/chemical approaches (e.g. diastereomer formation and chiral chromatography),1,2 and spectroscopic approaches (e.g. optical rotation,3 phase-sensitive microwave spectroscopy4,5 and Coulomb explosion6,7).
Here, we are concerned about chiroptical techniques that employ circular polarized light, a subset of spectroscopic approaches. Circular dichroism (CD) is defined as the difference in the extinction coefficients, ε, of chiral molecules for left-handed circular polarized (LCP) light and right-handed circular polarized (RCP) light.8
While the classical CD is in general measured in one photon absorption, more sophisticated chiroptical methods, which involve enantioselective ionization of the sample, have been developed over the last few decades: photoion circular dichroism (PICD) and photoelectron circular dichroism (PECD). The signal strengths of both PICD and PECD can be up to tens of percent – which exceeds the signals obtained by conventional CD by more than 3–4 orders of magnitude. Only recently the first simultaneous measurements of PICD and PECD have been reported combining the advantages of the available approaches.9
In this work, we present a second example of a coincidence PICD–PECD study shedding new light on the complementarity of PICD and PECD information. To this end, we briefly recall the basic definitions of PICD and PECD necessary for the comprehension of this manuscript.
The PICD – also coined CD in ion yields – is defined as the difference in total ion yields for the left and right circular polarized lights, see eqn (1).10 Since it is in general measured in combination with a mass spectrometer, it is then automatically obtained as mass-selective information.
 | (1) |
While the PICD is in general measured on the ion signal, the same information is obtained; if instead of the ion signal, the total electron signal is analyzed by eqn (1).
A different piece of information is contained in the asymmetry of the photoelectron angular distribution with respect to the laser propagation direction. This asymmetry is commonly referred to as PECD and is defined by19,20
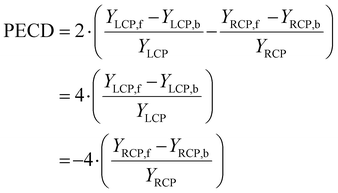 | (2) |
| YLCP = YLCP,f + YLCP,b |
| YRCP = YRCP,f + YRCP,b |
The current state of the field in PECD studies has been shaped by early theoretical work of Powis, where he laid the grounds for experimental PECD studies to come.21,22 To date, a wealth of theoretical and experimental PECD studies have been reported in the VUV regime (one photon ionization)23–26 as well as in the visible regime (multi-photon ionization).20,27–31 As with the PICD, the chirality information is in principle contained in both particles emerging from the photoionization of a neutral molecule, the electron and the cation. Circular dichroism in the differential ion angular distributions has recently been reported for the case of strong field ionization involving coulomb explosion.32 This work reported the four-fold ionization of chiral bromochlorofluoromethane molecules with a full momentum analysis of four fragments, i.e. CH+, Br+, Cl+ and F+. This approach is considered to be the ion analogue of the PECD. Since the technique relies on the high kinetic energy of fragments imparted by the Coulomb explosion, it is not automatically clear whether it can be applied to multiphoton ionization with negligible recoil on the parent ion formed. This left the question of assigning the PECD value measured to a specific chemical entity, i.e. the corresponding ion. This assignment is possible in a coincidence experiment where the PECD information is mass tagged by the coincident ion.20,33–35
Unfortunately, in most PECD experiments published to date, even in coincidence measurements, the PICD effect has been cancelled out by normalization of the data. However, all the published PICD experiments were performed in non-coincidence spectrometers. However, recently, we have published the first coincidence PECD and PICD measurements in which the PECD and PICD were measured simultaneously under the same measurement conditions.9 We showed that the PICD and PECD effects can be measured simultaneously. Although both effects showed an effect of approximately 7%, we could already see some differences in behaviour; for example, the PICD effect remained constant, whereas the PECD effect increased from 4% to 8% when selecting electrons with higher kinetic energy for the parent ion.
PICD and PECD, arising from the electronic excitation of a molecule, are dominated by different contributions to the total oscillator strength, which consists of a combination of electric and magnetic transition moments. Generally, the PICD is considered to be dominated by magnetic dipole transition moments, although it is in fact the combination of electronic and magnetic contributions to the transition dipole moment, which gives rise to the conventional CD in one photon absorption.36 In the case of multi-photon ionization – as relevant for the current work – the initial absorption steps prevail and consequently the PICD is dominated by these steps.11,16,37 In contrast to this, the PECD purely arises from electric dipole moments with the final state interactions of the outgoing electron.38 There is ongoing debate regarding the role of consecutive absorption steps and the orbital from which the electron is ultimately ejected.31,39 Therefore, PICD and PECD can be complementary and the relationship between PICD and PECD is the subject of this investigation. Performing a coincidence experiment as described in this work is the only means to ensure that PICD and PECD are indeed looking at the same molecular process.
To round-off the introduction, we mention that PICD and PECD can also be investigated in cases where the precursor is not a neutral molecule, but an anion from the ESI source. Daly et al. reported the CD in total electron yields (equivalent to PICD in the nomenclature of this work) for electro-sprayed DNA oligonucleotide anions.40 Krüger et al. reported the PECD for electro-sprayed DOPA and glutamic anions.41 Both approaches are based on the photodetachment of electrons from the precursor anions, which inherently offers the prospect of mass selection.
In this paper, we report the coincident measurement of both PICD and PECD in 1-phenylethylamine (1-PEA) upon fs-multiphoton ionization at 394.4 nm in a single experiment. The structure of 1-phenylethylamine is shown in Fig. 1, and the chiral C-atom has the amino group attached to it.
Experimental section
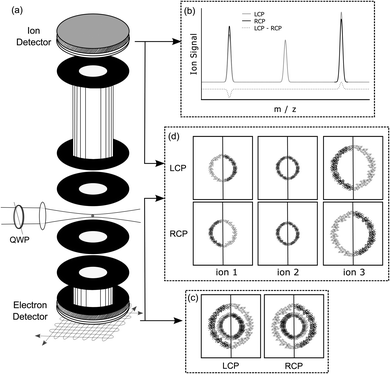
An experimental photoelectron–photoion coincidence spectrometer was described in a previous study.9 A scheme of the setup including an illustration of the symmetrisation procedure for electrons is presented in Fig. 2. The information required for the comprehension of this manuscript is recalled below.After ionization of a molecule, the electron and the ion were detected in coincidence on two detectors positioned on opposite sides of the ion source, Fig. 2(a). The electron was measured using time- and position-sensitive delay line detectors (Roentdek DLD40), whereas the ion time-of-flight was measured using two chevron-stacked microchannel plates in combination with a copper anode. Static voltages, optimized for electron imaging resolution, were applied to electrical lenses, leading to an electric field of 200 V cm−1 in the ionization region. The use of constant voltages limits our mass resolution to m/Δm = 120. To obtain a better mass resolution, we have also measured the ion time-of-flight mass spectrum at a higher static electric field of 1000 V cm−1 in the ionization region. However, at this higher electric field, the electron imaging resolution is deteriorating. Therefore, we used the smaller electric field during the coincidence measurements. Higher ion mass resolution in combination with a high electron imaging resolution could be achieved by switching the voltages on the electrostatic lenses.42
Femtosecond laser pulses with a central wavelength of 790 nm and a pulse duration of 30 fs were generated using a Ti:Sapphire multipass amplifier system with a repetition rate of 15 kHz and an average output power of 7 W (Dragon, KMLabs). A fraction of the output beam was subsequently frequency doubled in a 200 μm thick BBO crystal. The frequency doubled spectrum had a central wavelength of 394.4 nm and a spectral bandwidth of 8.6 nm. The second harmonic was separated from the fundamental beam with two dichroic mirrors. The SHG beam was focused down to a spot size of 100 μm × 70 μm using a lens with a 30 cm focal length. Due to the dispersion of the optical elements, the estimated pulse duration in the ionization chamber is 90 fs.
The laser intensity was continuously monitored using a power meter located behind the coincidence spectrometer, i.e. behind the output window. Experiments were performed with a pulse energy of 0.5 ± 0.1 μJ. The resulting intensity in the ionization volume is estimated to be 1011 W cm−2. Under these measurement conditions, approximately 0.081 electrons, 0.072 ions and 0.019 coincidence events were detected per laser shot. This results in a total ionization rate of 0.20 ionized molecules per laser shot,43 therefore limiting the probability of false coincidence to less than 0.3% according to Poisson statistics.
The circularly polarized light was generated using an achromatic broadband quarter-waveplate (RAC 2.4.15, B-Halle). The quality of the CPL was analyzed before and after the measurement. The circular polarisation of both RCP and LCP lights was ≥95%, see Fig. S1 in the ESI.†
A fast stepper motor was used to rotate the quarter waveplate and switch the handedness of the circular polarized light, every 10 s (150![[thin space (1/6-em)]](https://www.rsc.org/images/entities/char_2009.gif) 000 laser shots) in order to reduce effects of any experiment drift.
000 laser shots) in order to reduce effects of any experiment drift.
The data set for the R-enantiomer contained a total of 144 million laser shots (960 × 10 s) for each handedness, while the data set for the S-enantiomer contained a total of 136.5 million laser shots (910 × 10 s) for each handedness.
Each coincidence event was analyzed and categorized as follows: enantiomer (R or S), ion mass, polarisation (LCP or RCP) and depending on the position on the electron detector as either forward (f) or backward (b).
PECD and PICD were calculated for each small data set of 10 s measurement time, consisting of consecutive measurements of LCP and RCP. Subsequently, the mean value and standard error were calculated. Ultimately, both the PICD and the PECD data were symmetrized around zero to correct for systematic asymmetries and improve readability.
Both enantiomers of 1-phenylethylamine were purchased from Fisher Scientific and had a purity of 99%. The samples were effusively introduced into the vacuum chamber via 2 separate gas lines. The typical pressure inside the ionization chamber was 5 × 10⁻⁶ mbar. The pressure fell to below 5 × 10⁻⁸ mbar in between switching the enantiomers.
CD spectra were recorded at room temperature using a Jasco J-815 spectropolarimeter using a low volume 1 mm high precision quartz cuvette. The spectropolarimeter was used in a continuous scanning mode, with a response time of 2 s, a data pitch of 0.1 nm and a scan speed of 200 nm min−1. The N2-flow rate was to 3.0 L min−1. The samples were averaged 2 times.
Solutions of the individual enantiomers of 1-phenylethylamine in acetronitrile were prepared using the following 3 concentrations: 7.8 mM, 3.9 mM and 39 mM.
The CD spectra were combined – upconverting all signals to a concentration of 7.8 mM – using the following wavelength regions; the highest concentration of 7.8 mM was used to obtain a good CD spectrum in the 230–300 nm range. For the 210–230 nm range, the best CD spectra were obtained with a concentration of 3.9 mM, while, for the 190–210 nm range, the samples had to be diluted down to 39 mM to prevent saturation of the absorption.
Results and discussion
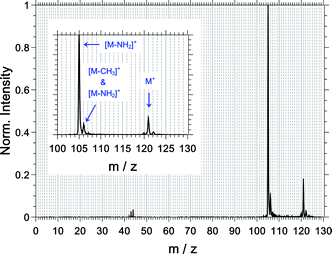
For an overview and mass assignment, we start the results section with a non-coincidence mass spectrum shown in Fig. 3 at a high mass resolution. The most intense signal belongs to the fragment ion at m/z = 105 and corresponds to the loss of the amine group from the parent ion ([M–NH2]+). The parent ion at m/z = 121 and the fragment ion at m/z = 106 are the other two dominant observed species. The signal of the latter comprises contributions from the 13C-isotopologue of the [M–NH2]+ signal (ca. 60%) and from the loss of the methyl group ([M–CH3]+, ca. 40%). The fragment ions at m/z = 43, 44 and 120 are also observed, and the fragment ions corresponding to CH3+ and NH2+ are not observed.The abundance of the measured ions and their measured multiphoton exponent are listed in Table 1. All fragments have a multiphoton exponent that is larger than 3; therefore, the absorption of at least 4 photons is required to produce them. We will come back to this point at a later point.
| m/z | Formula | Abundance (%) | Multiphoton exponent |
|---|---|---|---|
| 43 | C2H3N+/C3H7+ | 0.7 | 3.9 |
| 44 | C2H4N+/C3H8+ | 1.0 | 4.3 |
| 105 | C8H9+ (= [M–NH2]+) | 77.7 | 3.3 |
| 106 | C7H8N+ (= [M–CH3]+) & 13C12C7H9+ (= [13C of M–NH2]+) | 10.1 | 3.2 |
| 120 | C8H10N+ | 0.6 | 3.7 |
| 121 | C8H11N+ | 9.9 | 3.2 |
We continue by presenting the coincidence data in Fig. 4 and 6. First, we will present the results on the photoion circular dichroism, followed by the results obtained for the photoelectron circular dichroism.
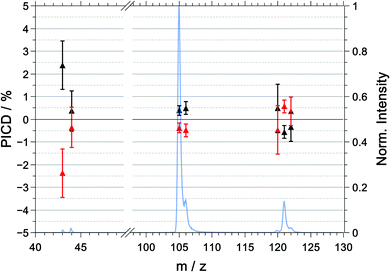 | ||
| Fig. 4 PICD values, measured in coincidence, for R-(+)-1-phenylethylamine (black) and S-(−)-1-phenylethylamine (red) and the mass spectrum (blue) for the multiphoton excitation at 394.4 nm. The plotted PICD values are symmetrized. The raw and symmetrized PICD values are listed in Table 2. | ||
We have determined both effects for all ions listed in Tables 2 and 3, respectively. However, during the discussion, we will focus on the two dominant peaks in the mass spectrum: that is. the parent ion (m/z = 121) and the signal corresponding to the loss of the amine group ([M–NH2]+, m/z = 105).
| m/z | R | S | (R–S)/2 |
|---|---|---|---|
| 43 | −18.0 ± 1.1 | −22.8 ± 1.1 | +2.4 ± 1.1 |
| 44 | −21.5 ± 0.9 | −22.2 ± 1.0 | +0.4 ± 0.9 |
| 105 | −17.8 ± 0.3 | −18.6 ± 0.2 | +0.4 ± 0.2 |
| 106 | −7.9 ± 0.4 | −8.8 ± 0.3 | +0.5 ± 0.3 |
| 120 | −22.6 ± 1.1 | −23.5 ± 1.1 | 0.5 ± 1.1 |
| 121 | −18.0 ± 0.3 | −19.1 ± 0.3 | −0.6 ± 0.3 |
| 122 | −6.3 ± 0.6 | −5.6 ± 0.7 | −0.3 ± 0.6 |
In all data presented, we have used all coincidence events; i.e. no selection based on the electron kinetic energy was applied for the determination of PICD and PECD. Checks have been performed to ensure that the PICD values of the coincidence and non-coincidence (all ions) data sets are, within the experiment error, very similar.
PICD
The PICD values as a function of mass-to-charge ratio are shown in Fig. 4. For the purpose of presentation and to correct for any systematic errors, the PICD values plotted in Fig. 4 were symmetrized around zero. The raw (unsymmetrized) and symmetrized PICD values and their corresponding errors are listed in Table 2.For R-(+)-1-PEA, we observe that the (symmetrized) PICD of the parent ion is negative with a value of −0.6 ± 0.3%, whereas the PICD values for the two dominant fragment ions – [M–NH2]+ and [M–CH3]+ – are positive with values of +0.4 ± 0.2% and +0.5 ± 0.3%, respectively. It should be noted that the raw (unsymmetrized) PICD values were highly negative for R-1-PEA and S-1-PEA. Evidently, there is a significant offset in the asymmetries of the raw data. This offset is caused by the fact that the ion signals for the LCP light are systematically smaller than those for the RCP light. In principle, this could be the results of light intensities being systematically lower for LCP compared to RCP. However, there is no experimental evidence for this problem. It further appears unlikely that the offset in the raw data is caused by either low coincidence count rates and/or laser pulse energy fluctuation. This is supported by the observation that the resulting standard deviation in the symmetrized PICD data is smaller than the observables and is in fact comparable to previous investigations.9
Ionization cross-sections are known to depend on the detailed state of polarization. Carman and Compton reported the ratios of the ionization cross-section for linear versus circular polarized light of up to 10 for e.g. 3 + 2 REMPI for nitric oxide.44 Thus a systematically lower degree of circular polarization for LCP could in principle contribute to the observed offset. However, here, the absolute ionization and coincidence count rates for the linear polarized light were always between those for RCP and LCP lights. Here, it is also unlikely that the offset is caused by imperfect circular polarisation as evidenced by the analysis of circular polarization presented in the ESI.† This leaves us with the possibility that ionization cross sections are also subject to possible effects of dynamic orientation.45,46 There is no direct access to information regarding orientational effects in the current experiment. The situation is different from our previous measurements on methyloxirane,9 where the raw (unsymmetrized) PICD values of all R-methyloxirane ions were negative and respectively positive for all ions of the S-enantiomer. The asymmetries in the PICD values could be corrected by introducing a reference sample;10,15 however, this has the disadvantage of the loss of information due to overlapping mass signals between the sample and reference.
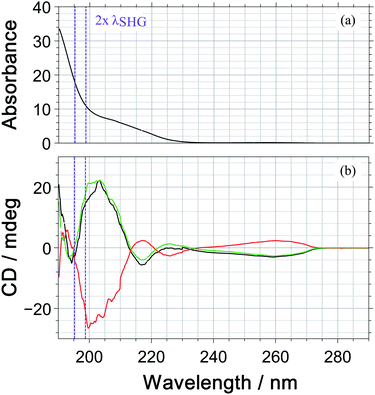
Under our measurement conditions, the discrimination of the enantiomers using PICD is hard – at least for the dominant ions in the mass spectrum. To investigate whether a change in wavelength could help, we measured the one photon CD spectrum of 1-PEA in acetonitrile, see Fig. 5. The CD signal is also subject to the magnetic dipole transitions and therefore it is a good indication whether a strong PICD signal can be expected. However, it must be noted that the bands could be shifted due to solvent effects and that the signal arise from 1-photon transitions, whereas excitation in the current work would reach the CD-band via a 2-photon transition.
Under our measurement conditions (purple lines in Fig. 5), it could be that we are close to the zero crossing in the CD signal. Unfortunately, we were not able to shift the wavelength of our SHG pulses by 10 nm to the red, which would be required to reach the CD maximum at 205 nm (2 photons@410 nm).
The fact that a small change in wavelength can improve the discrimination of enantiomers was reported by Horsch et al.15 They measured PICD values for the parent ion of R-methyloxirane of +2.2 ± 0.9%, +1.9 ± 1.1% and +0.4 ± 0.5% for the multiphoton excitation at 810 nm, 878 nm and 738 nm. In 3-methylcyclopentanone, an even more pronounced wavelength dependence has been reported with PICD values being −0.8% at 648 nm2 and +27% at 324 nm, where the latter wavelength is the SHG of the former.13
In summary, under our measurement conditions, we observe a slight discrimination of the enantiomers using the PICD and PICD value change sign between the parent ion and the fragment ions.
PECD
The multiphoton PECD as a function of mass-to-charge ratio is shown in Fig. 6 and the raw and symmetrized PECD values are tabulated in Table 3.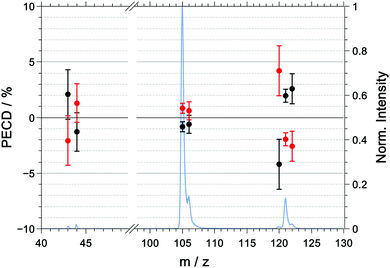 | ||
| Fig. 6 Symmetrized PECD values, measured in coincidence, for R-(+)-1-phenylethylamine (black) and S-(−)-1-phenylethylamine (red) and the mass spectrum (blue) for the multiphoton excitation at 394.4 nm. The raw data are listed in Table 3. | ||
| m/z | R | S | (R–S)/2 |
|---|---|---|---|
| 43 | +4.0 ± 3.3 | −0.1 ± 3.0 | +2.2 ± 3.1 |
| 44 | −1.3 ± 2.5 | +1.4 ± 2.3 | −1.3 ± 2.4 |
| 105 | +0.1 ± 0.7 | +1.8 ± 0.6 | −0.8 ± 0.7 |
| 106 | −0.2 ± 1.2 | +1.1 ± 1.1 | −0.6 ± 1.1 |
| 120 | −3.5 ± 3.4 | +4.9 ± 3.0 | −4.2 ± 3.2 |
| 121 | +2.3 ± 0.9 | −1.6 ± 0.8 | +1.9 ± 0.8 |
| 122 | +3.1 ± 1.9 | −2.0 ± 1.9 | +2.6 ± 1.9 |
In contrast to the raw PICD values, the raw PECD values are already almost symmetric around zero. Nonetheless, symmetrisation will help in correcting for any systematic errors, and when discussing the PECD values we will refer to the symmetrized values unless otherwise noted.
For the parent ion of R-1-(+)-PEA, we measured a positive PECD with a value of +1.9 ± 0.8%. The dominant fragment ions corresponding to m/z = 105 ([M–NH2]+) and m/z = 106 ([M–CH3]+) have a PECD value that is slightly negative or close to zero with −0.8 ± 0.7% and −0.6 ± 1.1%, respectively. The similarity of the PECD at m/z = 105 and m/z = 106 is not too surprising given the fact that about 60% of the latter signal is due to the 13C isotopologue of the former. Ultimately, both fragment signals exhibit a significantly lower (absolute) PECD value than the parent ion. The best discrimination of the enantiomers based on PECD is thus achieved for the parent ion.
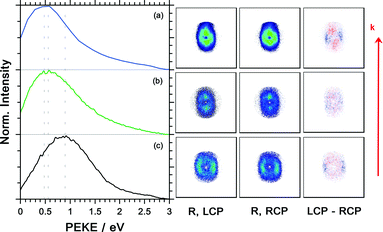
The photoelectron kinetic energy for the 3 dominant ions is illustrated Fig. 7. Also, the electron images detected with LCP and RCP and the difference image are shown. The electrons measured in coincidence with the parent ion have the highest probability at a kinetic energy of 0.9 eV, see Fig. 7(c). The kinetic energy distribution of the dominant fragment ions – [M–NH2]+ and [M–CH3]+ (with contributions from the 13C isotopologue of the former) – peaks at 0.48 and 0.56 eV, respectively.
Unlike in our previous coincidence measurement on methyloxirane9 – where we observed an increase in PECD from −4.4% to −8% when selecting the higher kinetic energy electrons of the parent ions – here the PECD and PICD values for all ions are (within the error bars) stable for different photoelectron kinetic energy regions.
The photoelectron angular distribution (in the photoelectron images in Fig. 7) of the parent ion peaks perpendicular to the laser propagation direction, whereas for the fragment ions the maxima are observed parallel to the laser direction. Furthermore, the photoelectron kinetic energy distribution of the fragments at m/z = 105 and 106 peaks at smaller energies than the corresponding distribution of the parent ion at m/z = 121. This indicates that different molecular orbitals are involved in the ionization leading to the respective ion signals. This is in contrast with the multiphoton ionization of camphor where the kinetic energy distribution associated with the parent ion and fragment ions was basically indistinguishable.20
PICD and PECD comparison
Because the PECD and PICD effects rely on different selection rules, both measurement techniques can complement each other. Beforehand, it is not always obvious whether PECD or PICD will offer the higher degree of distinguishability for the enantiomers under investigation. In particular, this could also vary as a function of ion mass-to-charge ratio and/or laser characteristics (i.e. pulse energy, wavelength, pulse duration, and chirp).To illustrate this, we have listed the PICD and PECD values of the dominant ions of R-(+)-1-phenylethylamine in Table 4.
| m/z | PICD/% | PECD/% | |
|---|---|---|---|
| 105 | [M–NH2]+ | +0.4 ± 0.3 | −0.8 ± 0.7 |
| 106 | C7H8N+ (= [M–CH3]+) & 13C12C7H9+ (= [13C of M–NH2]+) | +0.5 ± 0.3 | −0.6 ± 1.1 |
| 121 | M+ | −0.6 ± 0.3 | +1.9 ± 0.8 |
For the parent ion of 1-PEA, a better distinction is obtained by PECD than PICD. Whereas, for the dominant fragment ions (m/z = 105 and 106), both PECD and PICD offer only a minor discrimination of the enantiomers.
More interestingly to note is that we observe a change of sign for PECD and PICD when comparing the values measured for the parent ion and the fragment ions and for all dominant ions we observe an opposite sign for the PECD versus the PICD: i.e., the PECD value for the parent ion is positive for the R-enantiomer, whilst we observe a negative PECD for the fragment ions, whereas the PICD is negative for the parent ion and positive for the fragment ions. It would be hard to impossible to observe the change of sign in PECD between the parent and the fragment ions without the coincidence setup, certainly because the kinetic energy distributions of the different ions are rather similar. On the other hand, a difference in the sign of the PICD has also been reported by Horsch et al. without electron detection.18
At this point, it appears helpful to discuss the ladder of excitation steps operative in multiphoton ionization leading the particles detected as the basis for PICD and PECD. First of all, employing femtosecond excitation in this work, as opposed to the nanosecond excitation of the study by Boesl et al.,11 implies that any fragmentation observed is taking place after the end of the laser pulse. This brings us to the question, whether a different number of photons is being absorbed in the formation of the parent ion and the fragment ions, respectively, whether different molecular orbitals are involved and which signature is imprinted onto the angular distribution of the photoelectrons, i.e. the PECD. If the formation of the fragment ions was caused by the absorption of additional ions by the parent ion, i.e. after the ionization event, then the kinetic energy distribution of the electrons should be identical. Such an observation has been reported for camphor.20
Here, the fact that the kinetic energy distributions peak at different energies for the parent ion and the dominant fragment ions respectively provides a hint that these electrons originate from different molecular orbitals. This does not contradict the fact that on energetic grounds the absorption of more photons is required for the formation of fragment ions than for the formation of the parent ion. This leaves us with the question of the precise nature of electronic states involved and which population is relevant in which electronic state at which time. This requires considerable theoretical efforts which is beyond the scope of this work. However, it appears appropriate to the state that the discussion presented above regarding the relationship between PICD and PECD would have not been possible without the coincidence detection of PICD and PECD employed in this work. Previously published mass-tagged PECD studies did not report the PICD and previously reported PICD studies did not report the PECD. Only the coincident detection of PICD and PECD ensures that we are looking at the same molecular process.
To further understand the differences in behaviour between the measured PICD and PECD values, further investigations are needed. It goes without saying that these studies should be performed under the same experimental conditions, i.e. in photoion–photoelectron coincidence experiments.
Conclusions
In this paper, we have presented the first measurements on the distinction of the chiral molecule 1-phenylethylamine using PICD and PECD. We have used photoion–photoelectron coincidence detection in combination with fs-multiphoton ionization at 394.4 nm to detect the PECD and PICD effects under the same measurement conditions.Under these measurement conditions, the best discrimination of the enantiomers is achieved with the PECD with a value of 1.9 ± 0.8% for the parent ions. For R-1-(+)-phenylethylamine, the PICD is negative and the PECD is positive for the parent ions. This completely reverses for the dominant fragment ions ([M–CH3]+ at m/z = 106 and [M–NH2]+ at m/z = 105): here, the PICD is positive and the PECD is negative. The differences observed in the PICD and PECD of the parent and fragment ions most likely indicate the involvement of different molecular orbitals in the central ionization step leading to a rich variety of correlation patterns between PICD and PECD. The distinction of the enantiomers is difficult for some of the fragment ions since either the signal levels are low or the PICD and PECD values are close to zero.
In our previous paper, on PICD and PECD coincidence measurements,9 we already mentioned that “Most likely, it is a pure coincidence that PECD and PICD have an almost identical magnitude and sign in the methyloxirane studied in this work. In general, this is not expected to be the case.”
With the current study, we have indeed proven that this was a coincidence and that the simultaneous detection of both PICD and PECD can provide complementary information to discriminate chiral molecules. Overall, a higher chiral selectivity should be achievable using coincidence measurements, in particular in cases where multicomponent mixtures are analyzed.
Clearly, more theoretical studies are required to better understand the complementarity of PICD and PECD, in particular considering the wavelength dependence, the role of resonant intermediate states and the duration of the excitation pulse.
Conflicts of interest
There are no conflicts to declare.Acknowledgements
Financial support of this work from the Deutsche Forschungsgemeinschaft (DFG) under contract no. We 1330/19 is gratefully acknowledged. We thank Dr Oliver Stehling, Dr Sven-A. Freibert and Prof. Roland Lill for help with CD spectroscopy. We acknowledge the Core Facility of Protein Spectroscopy and Protein Biochemistry of the Philipps – Universität Marburg.Notes and references
- N. R. Srinivas, Biomed. Chromatogr., 2004, 18(4), 207 CrossRef CAS PubMed.
- I. Ilisz, R. Berkecz and A. Péter, J. Pharm. Biomed. Anal., 2008, 47(1), 1 CrossRef CAS PubMed.
- L. D. Barron, Molecular Light Scattering and Optical Activity, Cambridge University Press, 2009, p. 39 Search PubMed.
- D. Patterson, M. Schnell and J. M. Doyle, Nature, 2013, 497(7450), 475 CrossRef CAS PubMed.
- V. A. Shubert, D. Schmitz, D. Patterson, J. M. Doyle and M. Schnell, Angew. Chem., Int. Ed., 2014, 53(4), 1152 CrossRef CAS PubMed.
- M. Pitzer, M. Kunitski, A. S. Johnson, T. Jahnke, H. Sann, F. Sturm, L. P. H. Schmidt, H. Schmidt-Böcking, R. Dörner, J. Stohner, J. Kiedrowski, M. Reggelin, S. Marquardt, A. Schießer, R. Berger and M. S. Schöffler, Science, 2013, 341(6150), 1096 CrossRef CAS PubMed.
- P. Herwig, K. Zawatzky, M. Grieser, O. Heber, B. Jordon-Thaden, C. Krantz, O. Novotný, R. Repnow, V. Schurig, D. Schwalm, Z. Vager, A. Wolf, O. Trapp and H. Kreckel, Science, 2013, 342(6162), 1084 CrossRef CAS PubMed.
- Circular dichroism: Principles and applications, ed. N. Berova, K. Nakanishi and R. W. Woody, Wiley-VCH, New York, NY, 2nd edn, 2000 Search PubMed.
- C. S. Lehmann and K.-M. Weitzel, Phys. Chem. Chem. Phys., 2020, 22(24), 13707 RSC.
- C. Logé, A. Bornschlegl and U. Boesl, Anal. Bioanal. Chem., 2009, 395(6), 1631 CrossRef PubMed.
- U. Boesl and A. Bornschlegl, ChemPhysChem, 2006, 7(10), 2085 CrossRef PubMed.
- R. Li, R. Sullivan, W. Al-Basheer, R. M. Pagni and R. N. Compton, J. Chem. Phys., 2006, 125(14), 144304 CrossRef CAS PubMed.
- A. Bornschlegl, C. Logé and U. Boesl, Chem. Phys. Lett., 2007, 447(4), 187 CrossRef CAS.
- U. Boesl and A. Kartouzian, Annu. Rev. Anal. Chem., 2016, 9(1), 343 CrossRef CAS PubMed.
- P. Horsch, G. Urbasch, K.-M. Weitzel and D. Kröner, Phys. Chem. Chem. Phys., 2011, 13(6), 2378 RSC.
- H. G. Breunig, G. Urbasch, P. Horsch, J. Cordes, U. Koert and K.-M. Weitzel, ChemPhysChem, 2009, 10(8), 1199 CrossRef CAS PubMed.
- P. Horsch, G. Urbasch and K.-M. Weitzel, Z. Phys. Chem., 2011, 225(5), 587 CrossRef CAS.
- P. Horsch, G. Urbasch and K.-M. Weitzel, Chirality, 2012, 24(9), 684 CrossRef CAS PubMed.
- B. Ritchie, Phys. Rev. A: At., Mol., Opt. Phys., 1976, 13(4), 1411 CrossRef.
- C. S. Lehmann, N. B. Ram, I. Powis and M. H. M. Janssen, J. Chem. Phys., 2013, 139(23), 234307 CrossRef PubMed.
- I. Powis, J. Phys. Chem. A, 2000, 104(5), 878 CrossRef CAS.
- I. Powis, J. Chem. Phys., 2000, 112(1), 301 CrossRef CAS.
- N. Böwering, T. Lischke, B. Schmidtke, N. Müller, T. Khalil and U. Heinzmann, Phys. Rev. Lett., 2001, 86(7), 1187 CrossRef PubMed.
- L. Nahon, G. A. Garcia and I. Powis, J. Electron Spectrosc. Relat. Phenom., 2015, 204, 322 CrossRef CAS.
- S. Turchini, J. Phys.: Condens. Matter, 2017, 29(50), 503001 CrossRef CAS PubMed.
- R. Hadidi, D. K. Bozanic, G. A. Garcia and L. Nahon, Adv. Phys.: X, 2018, 3(1), 1477530 Search PubMed.
- C. Lux, M. Wollenhaupt, T. Bolze, Q. Liang, J. Köhler, C. Sarpe and T. Baumert, Angew. Chem., Int. Ed., 2012, 51(20), 5001 CrossRef CAS PubMed.
- A. N. Artemyev, A. D. Müller, D. Hochstuhl and P. V. Demekhin, J. Chem. Phys., 2015, 142(24), 244105 CrossRef PubMed.
- R. E. Goetz, T. A. Isaev, B. Nikoobakht, R. Berger and C. P. Koch, J. Chem. Phys., 2017, 146(2), 24306 CrossRef CAS PubMed.
- J. Miles, D. Fernandes, A. Young, C. M. M. Bond, S. W. Crane, O. Ghafur, D. Townsend, J. Sá and J. B. Greenwood, Anal. Chim. Acta, 2017, 984, 134 CrossRef CAS PubMed.
- A. Comby, E. Bloch, C. M. M. Bond, D. Descamps, J. Miles, S. Petit, S. Rozen, J. B. Greenwood, V. Blanchet and Y. Mairesse, Nat. Commun., 2018, 9(1), 5212 CrossRef CAS PubMed.
- K. Fehre, S. Eckart, M. Kunitski, C. Janke, D. Trabert, M. Hofmann, J. Rist, M. Weller, A. Hartung, L. P. H. Schmidt, T. Jahnke, H. Braun, T. Baumert, J. Stohner, P. V. Demekhin, M. S. Schöffler and R. Dörner, Phys. Rev. Lett., 2021, 126(8), 83201 CrossRef CAS PubMed.
- M. M. Rafiee Fanood, N. B. Ram, C. S. Lehmann, I. Powis and M. H. M. Janssen, Nat. Commun., 2015, 6, 7511 CrossRef PubMed.
- S. Hartweg, G. A. Garcia, D. K. Božanić and L. Nahon, J. Phys. Chem. Lett., 2021, 12(9), 2385 CrossRef CAS PubMed.
- R. Hadidi, D. K. Božanić, H. Ganjitabar, G. A. Garcia, I. Powis and L. Nahon, Commun. Chem., 2021, 4, 72 CrossRef CAS.
- N. Berova, L. Di Bari and G. Pescitelli, Chem. Soc. Rev., 2007, 36(6), 914 RSC.
- D. Kröner, J. Phys. Chem. A, 2011, 115(50), 14510 CrossRef PubMed.
- I. Powis, Photoelectron Circular Dichroism in Chiral Molecules, in Advances in chemical physics, ed. S. A. Rice, New York, Wiley, 2008, pp. 267–329 Search PubMed.
- A. Kastner, T. Ring, B. C. Krüger, G. B. Park, T. Schäfer, A. Senftleben and T. Baumert, J. Chem. Phys., 2017, 147(1), 13926 CrossRef PubMed.
- S. Daly, F. Rosu and V. Gabelica, Science, 2020, 368(6498), 1465 CrossRef CAS PubMed.
- P. Krüger and K.-M. Weitzel, Angew. Chem., Int. Ed., 2021, 60(33), 17861 CrossRef PubMed.
- A. Vredenborg, W. G. Roeterdink and M. H. M. Janssen, Rev. Sci. Instrum., 2008, 79(6), 63108 CrossRef PubMed.
- T. Baer, Booze Jon and K.-M. Weitzel, Photoelectron Photoion Coincidence Studies of Ion Dissociation Dynamics, in Vacuum Ultraviolet Photoionization and Photodissociation of Molecules and Clusters, ed. C.-Y. Ng, World Scientific, 1991, p. 259 Search PubMed.
- H. S. Carman and R. N. Compton, J. Chem. Phys., 1989, 90(3), 1307 CrossRef CAS.
- J. L. Hansen, L. Holmegaard, J. H. Nielsen, H. Stapelfeldt, D. Dimitrovski and L. B. Madsen, J. Phys. B: At., Mol. Opt. Phys., 2012, 45(1), 15101 CrossRef.
- L. Xu, I. Tutunnikov, Y. Prior and I. S. Averbukh, J. Phys. B: At., Mol. Opt. Phys., 2021, 54(16), 164003 CrossRef CAS.
Footnote |
| † Electronic supplementary information (ESI) available. See DOI: https://doi.org/10.1039/d2cp01418a |
| This journal is © the Owner Societies 2022 |


