Ultrafast conformational dynamics of Rydberg-excited N-methyl piperidine†
Wenpeng
Du
 a,
Yan
Gao
a,
Brian
Stankus
b,
Xuan
Xu
a,
Haiwang
Yong‡
a,
Yan
Gao
a,
Brian
Stankus
b,
Xuan
Xu
a,
Haiwang
Yong‡
 a and
Peter M.
Weber
 *a
*a
aDepartment of Chemistry, Brown University, Providence, Rhode Island 02912, USA. E-mail: peter_weber@brown.edu
bDepartment of Chemistry and Biochemistry, Western Connecticut State University, Danbury, Connecticut 06810, USA
First published on 24th November 2021
Abstract
We have observed the ultrafast conformational dynamics of electronically excited N-methyl piperidine (NMP) using time-resolved Rydberg fingerprint spectroscopy. Optical excitation at various wavelengths ranging from 212 nm to 229 nm leads to the 3s or 3p Rydberg states and induces coherent oscillatory motions with periods of about 700 fs. These coherent motions survive the internal conversion from 3p to 3s but then dephase on a time scale of a few oscillations. Intramolecular vibrational energy redistribution on a picosecond time scale leads to an equilibrium between two conformeric structures that are separated in binding energy by 0.09 eV. Model calculations using the DFT-SIC method are in excellent agreement with the experiments and identify the conformers as the chair and twist structures of NMP. The analysis of the equilibrium parameters at long time delays as a function of excitation wavelength allows for the extraction of thermodynamic parameters for the conformeric transformation. We derive an enthalpy of the chair to twist reaction in the 3s excited state of 62 meV with an entropy of 19.70 J mol−1 K−1. An activation energy of 276 meV is also obtained with a kinetic model.
Introduction
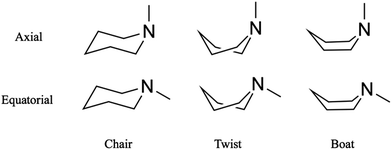
Substituted six-membered saturated heterocycles are important in many fields of chemistry and are found in natural products, pharmaceutical compounds and polymeric systems.1 The conformations of heterocyclic ring compounds containing nitrogen atoms stand out because those compounds often comprise the backbone of larger molecules and support their biological function.2,3 Different orientations of substituent groups (equatorial and axial) and the possible conformeric alignment of the ring (chair, boat and twist) let molecules with the same overall chemical structure assume distinct physical and chemical identities.4,5 Substituted six-membered saturated heterocycles also are valuable benchmarks for computational methods.6,7 Among the six-membered saturated heterocycles, piperidine and its derivatives attract interest because they are the building blocks of many common alkaloids where they determine their pharmacological and toxicological function.8 Piperidines are also prototypical molecular systems to explore the energetics and isomerization kinetics of molecules that can assume several conformeric states.Recent ultrafast time-resolved photoelectron and X-ray scattering measurements of Rydberg-excited N-methyl morpholine revealed a coherent vibrational motion of the methyl group associated with the nitrogen inversion mode, a motion that survives internal conversion.9,10 The twist and boat structures were not observed, presumably because they are energetically too unfavorable. Similarly, in dimethyl-piperazine, spectroscopic and scattering experiments have shown no evidence for twisted structures in the excited state.11,12 In the present article we report that in the closely related system N-methyl piperidine (NMP), we observe the signature of a twist structure that appears on a picosecond time scale after the coherent vibrational motions have dephased.
Time-resolved Rydberg fingerprint spectroscopy (RFS) is a useful tool to explore structural molecular dynamics including conformeric dynamics in complex molecules.13–16 Rydberg states are sensitive to subtle changes of the molecular structure and charge density distributions while being largely insensitive to the internal vibrational energy.17 Because of this insensitivity toward the internal energy,18 RFS can be applied to hot, flexible molecules with sufficient internal energy to allow kinetic transitions between conformers.16,19 For example, RFS enabled the measurement of conformational dynamics of triethylamine, where the rotation of single carbon–carbon bonds connects local minima on the potential energy surface.20 In the present study, we apply RFS to explore transformation between ring conformers of NMP, Fig. 1.
Piperidine, the parent compound without the methyl group, has a ground electronic state where the equatorial conformation is more stable than the axial one by 0.8 to 3.8 kJ mol−1 for non-interacting solvents and in the gas phase.21,22 In NMP in both liquid and gas phases, the equatorial structure is favored by about 11.3 kJ mol−1![[thin space (1/6-em)]](https://www.rsc.org/images/entities/char_2009.gif) 23 and 12.5 kJ mol−1.24 Because the energy difference is quite high, the chair equatorial structure of ground state molecules is expected to dominate at room temperature.25,26
23 and 12.5 kJ mol−1.24 Because the energy difference is quite high, the chair equatorial structure of ground state molecules is expected to dominate at room temperature.25,26
In contrast to the ground state neutral molecule, the excited-state neutral and the ground-state molecular ion tend to have a more planar amine group, as the transfer of a nitrogen lone-pair electron to the Rydberg orbital changes the hybridization from sp3 to sp2.20 Because the ground- and excited-state potential energy landscapes are quite different, optical excitation of neutral NMP induces conformeric dynamics on the excited state potential energy surface. In our studies, the NMP system is optically excited dominantly to 3s or 3p Rydberg states using different photon wavelengths. Excitation with a very short optical pulse induces a coherent motion involving the nitrogen and the terminal methyl group. NMP has 54 internal degrees of freedom that create a dense bath of states into which this initially coherent wavepacket dephases. In NMP it can be expected that the energy barrier between the chair and other conformers may be lower on the Rydberg-excited surface than on the ground state because the more planar geometry of the amine is associated with reduced hindrance on part of the methyl group. The excess energy therefore may suffice to overcome the barrier between different ring conformers. Indeed, we observe the mixture of chair and twist conformers as the system approaches equilibrium. By depositing different amounts of energy into the system via optical excitation at different wavelengths, the relative energies of the different conformeric structures are determined.
Experimental methods
Photoelectron spectroscopy
The experimental setup, the laser system and the photoelectron spectrometer have been described previously in detail.27–29 Laser pulses at about 800 nm with 5 kHz repetition rate and approximately 35 fs pulse duration are generated by a two-stage amplifier (Coherent, Legend Elite Duo) that is seeded by a Ti:sapphire oscillator (Coherent, Mantis). About 90% of this output is used to pump a femtosecond optical parametric amplifier (Coherent, Opera SOLO) that generates the pump pulses in the wavelength range from 211 nm to 229 nm (0.2 to 0.5 μJ per pulse). The remaining 10% is upconverted to the second harmonic using a β-barium borate (BBO) crystal and used as the probe pulse (402–404 nm, 12 μJ per pulse). The wavelengths were measured by a spectrometer (Ocean Optics). The pump and probe beams were both focused into the molecular beam with a spherical aluminum mirror (F = 300 mm), focusing the beams to a ∼100 μm FWHM spot size. The time delay between pump and probe pulses was controlled by a motorized linear translation stage (Physik Instrumente). The contributions to the photoelectron and photoion signals from the individual pump and probe beams were separately measured and subtracted from the 2-color spectra to obtain the pure two-color pump–probe signals. The cross-correlation time between the pump and the probe pulses was in the range of 110–150 fs (FWHM).The molecular beam was generated by expanding NMP vapor, seeded in helium carrier gas at 1.1 bar, through a 100 μm diameter nozzle and a 150 μm skimmer. Anhydrous N-methylpiperidine (99%) was purchased from Sigma-Aldrich and used without further purification. The mass spectrum showed that more than 99.9% of the signal is from NMP molecules. The sample reservoir was cooled to −40 °C during the experiment to keep the NMP vapor pressure low, thereby avoiding clustering in the molecular beam. The ejected photoelectrons were collected and analyzed by a time-of-flight spectrometer. The binding energy (BE) of the electrons was obtained by subtracting the measured photoelectron kinetic energy from the probe photon energy. The UV/Vis spectrum was measured with a Shimadzu UV-1700 double-beam scanning spectrometer.
Computational methods
Ground state and ion state calculations of NMP were performed with the Gaussian 09 program.30 The optimization of conformeric structures in the ground state and ion states was performed using density functional theory (DFT) with the B3LYP functional and a 6-311++G(d,p) basis set.31 Møller–Plesset perturbation theory to second order with the aug-cc-pVDZ basis set was used to calculate the vibrational frequencies of the chair and twist NMP. Structures were visualized with Gaussview 5.32The 3s Rydberg state and the corresponding BE of NMP were calculated using the Perdew–Zunger self-interaction correction (SIC)33 density functional theory, carried out with the GPAW software.34,35 This method has proven successful in calculating Rydberg-excited states of molecules and molecular clusters.36–38 A real space grid with a cubic simulation box of 25 Å side length and a uniform grid spacing of 0.15 Å was used. The Rydberg orbitals were calculated using the ground state DFT-SIC with the local density approximation (LDA) functional.39 The total energy of the Rydberg-excited state was calculated with the Perdew–Burke–Ernzerhof (PBE) functional40 and the Delta Self-Consistent Field method41 where one electron was removed from the highest occupied orbital (HOMO) and placed in the desired Rydberg orbital.42 The BEs of the Rydberg states were obtained by calculating the difference between the energy of excited state and that of ion state.
Results and discussion
Photoelectron and absorption spectra
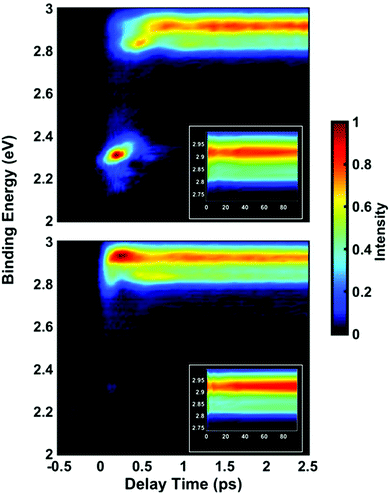
Time-resolved photoelectron spectra of NMP are obtained upon excitation at pump wavelengths of 212 nm, 216 nm, 220 nm, 225 nm and 229 nm, followed by ionization with a 403 nm probe pulse. The spectra with lowest and highest pump photon energies are shown in Fig. 2, while the others are provided in the ESI.† In analogy to our previous studies of tertiary amines,11,20,29,42,43 the short-lived peaks near 2.3 eV are assigned to 3p states. The long-lived signal in the range from 2.8 to 3.0 eV is observed in all five pump wavelengths and assigned to the 3s states. The lifetimes of primary and secondary amines in the Rydberg excited states are very short.43–45 Yet those of the tertiary amines are much longer, as we have already demonstrated in several other systems.11,20,29,42,43 The lifetime of the 3s state of NMP exceeds the 500 ps limit of the experiment as shown in the ESI.† The insets of Fig. 2 show the 3s states over a longer time range.It is apparent that excitation with 212 nm lifts the molecule to the 3p states while 229 nm predominantly yields 3s. The latter spectrum shows only a faintly visible signature of 3p. Either way, the 3p states have a short lifetime and decay to 3s by internal conversion. The excitation wavelengths chosen here are therefore in the range where 3p and 3s excitation overlap. To obtain quantitative measures of the initial excitation to 3p and 3s states as a function of the pump wavelength, an exponential time constant was used to fit the decay of the 3p signal and the growth of the 3s signal:
 | (1A) |
 | (1B) |
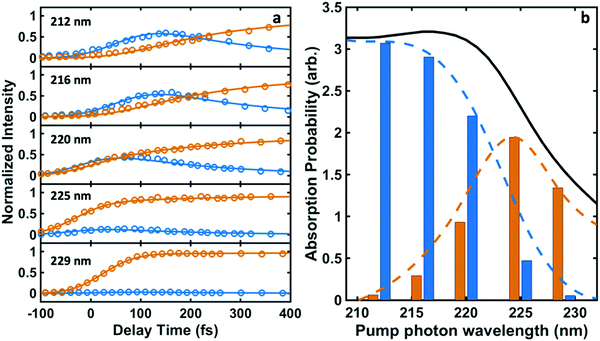 | ||
| Fig. 3 (a) The time-dependent normalized intensities for 3p (blue circles) and 3s (orange circles) and the fits to eqn (1A) and (1B) (blue and orange lines). (b) The relative absorption of initial excitations to 3s (orange bars) and 3p (blue bars) for different pump photon wavelengths. The black curve shows the experimentally measured UV absorption spectrum of NMP. The blue and orange dashed curves represent the decomposition of the absorption spectrum into the absorption specifically into 3p and 3s according to C3p/(C3s + C3p) and C3s/(C3s + C3p) calculated from Table 1, respectively. | ||
| Wavelength λ/nm | Internal conversion τIC/fs | C3p | C3s | 3p initial excitation (%) | 3s initial excitation (%) |
|---|---|---|---|---|---|
| 212 | 213 (18) | 0.96 (0.04) | 0.02 (0.06) | 98 (6) | 2 (6) |
| 216 | 214 (18) | 0.89 (0.04) | 0.09 (0.04) | 91 (4) | 9 (4) |
| 220 | 219 (16) | 0.66 (0.04) | 0.28 (0.04) | 70 (4) | 30 (4) |
| 225 | 201 (40) | 0.20 (0.04) | 0.73 (0.04) | 22 (4) | 78 (4) |
| 229 | 199 (136) | 0.04 (0.02) | 0.93 (0.02) | 4 (2) | 96 (2) |
The time constant for internal conversion, as determined by a weighted average over the five different wavelengths, is 213 ± 7 fs and lacks a clear dependence on the excitation energy. The excitation amplitudes C3p and C3s do depend on the excitation energy, revealing that 3p excitation dominates at 212 nm while the 3s excitation prevails at 229 nm. Absorption between 212 nm and 229 nm leads to a mixture of 3p and 3s excitation. Fig. 3(b) illustrates the absorption probabilities of excitation into 3p states and 3s states as bars, combined with the experimentally measured UV absorption spectrum of NMP, expressing the probabilities as C3p/(C3s + C3p) and C3s/(C3s + C3p), respectively. The blue and orange dashed lines illustrate the individual absorption spectrum of the 3p and 3s states, respectively.
Ultrafast dynamics
Time-dependent oscillations are observed in the 3s peak structure and in one of the 3p peaks. In general, structured and split peaks could arise either from different conformeric forms being present in the molecular beam, from magnetic sublevels of the Rydberg states, or from different structures that are created in dynamic or kinetic processes after electronic excitation. Since almost all NMP molecules in the molecular beam are in the equatorial chair form,21–24 we rule out the possibility that the observed peak splittings arise from different conformers in the ground state. For the 3p states, the observed peak splittings could arise from different magnetic sublevels (e.g. ml = 0, ±1). But for the 3s state, the different spectral components observed in the time-dependent Rydberg electron binding energy spectrum can only be caused by structural changes occurring in the excited electronic state.The time-dependent binding energy of the 3s peak shown in Fig. 2 reveals two features: a coherent oscillation in the sup-picosecond and picosecond domain, and a slower evolution approaching toward a final equilibrium between two spectral components. The fast-oscillatory features can be associated with the dynamic motions of the tertiary amine group as has been observed in the related N-methyl morpholine molecule.7,9,10 Optical excitation lifts an electron from the highest occupied molecular orbital, mostly the lone pair orbital of nitrogen, to a Rydberg orbital. This changes the hybridization of the nitrogen atom from sp3 to sp2 so that the geometry of the amine group transitions from pyramidal toward planar. The Franck–Condon active vibrational mode is therefore expected to be associated with the nitrogen inversion motion. Excitation with an ultrafast laser pulse creates a wavepacket that propagates, at least initially, on the Rydberg state potential energy surface along this coordinate.
To relate the oscillatory features to the structural dynamics, the 3s Rydberg electron binding energies were calculated by self-interaction corrected density functional theory (DFT-SIC). The molecular geometries are obtained by scanning the nitrogen inversion angle of the molecular ion while all other structural parameters are relaxed (see ESI† for the definition of the nitrogen inversion angle). The Rydberg electron is far from the ion core and has little bonding character, so that the structure of the molecule in the Rydberg state is expected to be close to that in the ion state. Fig. 4(a) shows the potential energy surface of 3s Rydberg state along the nitrogen inversion angle. The binding energy, shown in Fig. 4(b), is obtained by subtracting the Rydberg electron energy from the corresponding ion state energy. The computed 3s Rydberg state binding energy along the nitrogen inversion motion in Fig. 4(b) spans the range from 2.83 to 2.91 eV, which is in good agreement with the measured oscillatory feature of the 3s signals ranging from 2.78 to 3.03 eV. The Franck–Condon excitation from the equatorial chair structure with an angle of 17° leads to the higher binding energy part of the 3s peaks. The wavepacket motion initially proceeds along the energy surface of Fig. 4(a), driving the structure from equatorial to axial, at which point it reaches the lower binding energy of the 3s peak. This process therefore results in the oscillation of 3s peaks in first few picoseconds.
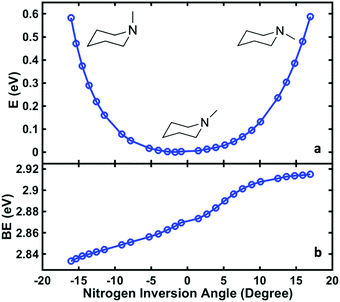 | ||
| Fig. 4 The computed potential energy of NMP in the 3s Rydberg state as a function of the nitrogen inversion angle (the definition of this angle is shown in ESI†), (a), and the corresponding binding energy of the 3s Rydberg state (b). | ||
To determine the dynamic parameters of the wavepacket motion, the 3s signal is divided into two parts, a higher binding energy part centered at 2.93 eV and a lower binding energy part centered at 2.82 eV. Two Gaussian functions are used to separate them from the overlapped 3s feature at each time delay. The ratios of these component signals to the total 3s signal, for positive delay times, is analyzed as time-dependent fractional populations. Since the two 3s parts add up to the total 3s signal, the sum of the ratios always add to 1. Both of the 3s BE parts are fitted to eqn (2):
 | (2) |
As shown in Fig. 5 and Table 2, the high- and low-binding energy features of the 3s peak fit well to shared oscillatory features with periods of about 700 fs. Excitation with higher photon energies initially leads dominantly to 3p as discussed above. The 3p states also show oscillatory features but with a shorter period of about 400 fs. (see the details of the 3p oscillation in ESI†) The coherence of the wavepacket is retained after the internal conversion, but the excitation to 3p with subsequent internal conversion to 3s induces a phase shift in the coherent oscillations in 3s. A similar phase shift has previously been reported in the N-methyl morpholine system where it has been ascribed to variations in the vibrational frequencies in 3p and 3s.29 The oscillations fade after a few periods whereupon the remaining time dependence is described by slower exponential decays with varying time constants.
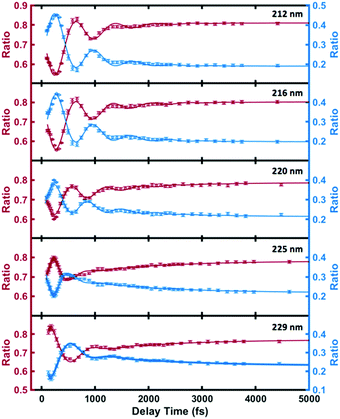 | ||
| Fig. 5 The individual components of the 3s signal for the different optical excitation wavelengths (circles), and the fits according to eqn (2) (lines). The red and blue circles represent the ratios of higher binding energy (2.80 eV–3.05 eV) signal and lower binding energy (2.77 eV–2.90 eV) signal to the total 3s signal. | ||
| Wavelength λ/nm | Oscillation period T/fs | Dephasing τ1/fs | Phase ϕ/rad | Kinetics time constant τ2/fs |
|---|---|---|---|---|
| 212 | 735 (23) | 568 (94) | 2.31 (0.11) | 669 (120) |
| 216 | 698 (22) | 602 (113) | 2.05 (0.12) | 812 (160) |
| 220 | 634 (24) | 581 (133) | 2.17 (0.12) | 1221 (233) |
| 225 | 634 (46) | 240 (53) | -0.84 (0.13) | 1471 (302) |
| 229 | 798 (40) | 324 (48) | 0.01 (0.15) | 1557 (218) |
The chair and twist conformers
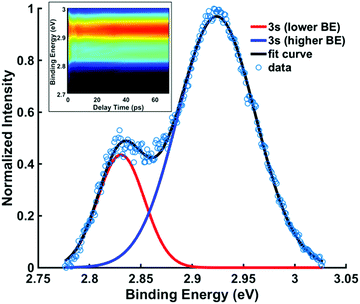
To explore the decay with kinetic time constant τ2, the structures associated with the two 3s spectral components need to be identified. Since the amine group remains sp2 hybridized as long as the molecule is in the excited state and thus retains its near-planar form, the conformeric forms giving rise to the spectral peaks must relate to different ring structures.In Fig. 6, the signals for spectra between 6 ps and 70 ps, which represent the system after approaching the equilibrium, are summed and fitted with two Gaussian functions. The weighted average binding energies from all five experiments with different pump wavelengths result in binding energies of 2.92 (0.01) eV for the higher 3s state and 2.83 (0.01) eV for lower 3s state. The (3σ) uncertainties given in parentheses show that the results from different experiments are quite consistent. The difference in the binding energies, 0.09 eV, is compared to the computational results below.
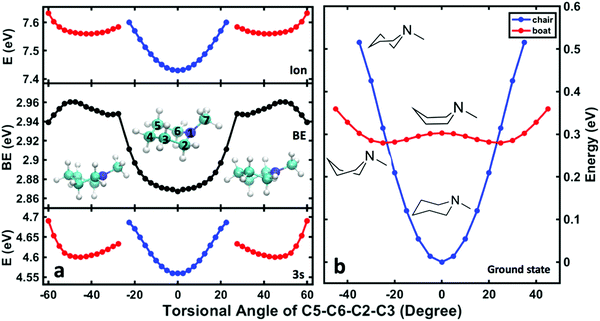
To assign the observed spectroscopic features in the 3s signal to specific structures, DFT-SIC calculations were carried out to determine binding energies of different conformeric forms. Molecular geometries are obtained by scanning the ring-twist coordinate, which is defined as the dihedral angle C5–C6–C2–C3 (see structure inset in Fig. 7a) from 0° to 60° while relaxing all other atoms positions. (The energies are symmetric with respect to the angles because of the symmetry of the molecule.) The ground state energy curves are based on the structures optimized in the ground state, whereas the Rydberg state and the ion energy curves were calculated based on the structures optimized in the ion state. Calculations for the NMP cation show that there is no local minimum corresponding to the boat structure: all geometry optimizations that start from a boat structure invariably led to twisted structures.
Fig. 7(b) shows the potential energies of the chair, boat and twist structures in the ground electronic state as a function of the torsional dihedral angle. The chair structures have less energy at small torsional angles while the twist structures are more stable at higher torsional angles. In the 3s Rydberg state and the ion state, Fig. 7(a), the chair and twist structures have distinct minima. The one at 0° is the chair structure while the two minima near ±45° correspond to the symmetry-equivalent twisted structures. The cusps at about ±25° represent regions where the chair surface (blue) and the twist surface (red) cross. These regions are near the transition state along the C5–C6–C2–C3 torsional coordinate.
The comparison of the energies in 3s and the ion yields, by subtraction, the binding energy. For the chair and the twist forms, the binding energies are 2.87 and 2.96 eV, and their difference is 0.09 eV. As shown in Table 3, these values are in excellent agreement with the experimental data. The absolute experimental values are 0.04 eV lower than the computed values, a difference that is in line with prior investigations in tertiary amine systems.10,40,41 Both the experiment and the calculations determine the energy differences better than their absolute values because systematic errors cancel out. The excellent agreement between the experiment and the computation supports the assignment of the observed spectral features. The peaks in Fig. 6(b) centered at 2.83 eV and 2.92 eV are thus assigned to the chair and the twist conformers in the 3s Rydberg-excited state.
| Binding energy | Twist | Chair | Difference |
|---|---|---|---|
| Experiment | 2.92 | 2.83 | 0.09 |
| Calculation | 2.96 | 2.87 | 0.09 |
Combining the results for computed binding energies along the nitrogen inversion coordinate and the ring-twist coordinate, the 3s features observed in the spectrum are seen to arise from different nuclear motions. At early times, before the amine oscillation fades away, the chair structure with equatorial methyl group gives rise to the signal of higher 3s BE and the axial form contributes to the signal of lower 3s BE. But at later times, after the coherent motions dephase, the two 3s BE peaks centered at 2.92 eV and 2.83 eV represent the twist and the chair conformer with the amine group staying in planar. Based on the previous results, the BE of the equatorial chair structure is close to the BE of the ring-twist conformer. The axial chair structure also shares similar BE ranges as the chair conformer. These BEs are highly overlapped with each other so that only two peaks show up in the 3s band. It is the time-domain analysis that makes possible the identification of the different species.
Thermodynamic and kinetic analysis
The spectral analysis (Fig. 6) yields the fractional signal intensity ratios of the twist and chair conformers at equilibrium on the 3s potential energy surface. Assuming equal ionization cross-sections for the twist and chair structures, the experimentally observed peak areas are proportional to the relative populations of the two forms. The ratio of the peak areas therefore yields the equilibrium constant K, provided the delay time is long enough for the energy to redistribute completely amongst the vibrational modes. Table 4 lists the equilibrium constants for the different excitation photon wavelengths.| Wavelength (nm) | Equilibrium constant K (twist/chair) | Internal energy (eV) | Temperature (K) | ln (K) |
|---|---|---|---|---|
| 212 | 4.54 (0.20) | 1.25 | 829 | 1.51 (0.04) |
| 216 | 4.31 (0.22) | 1.14 | 791 | 1.46 (0.06) |
| 220 | 3.92 (0.18) | 1.04 | 755 | 1.38 (0.04) |
| 225 | 3.77 (0.18) | 0.91 | 707 | 1.33 (0.04) |
| 229 | 3.68 (0.14) | 0.82 | 669 | 1.30 (0.04) |
For the excitation wavelengths of 212 nm, 216 nm, 220 nm, 225 nm and 229 nm, the molecules in the 3s state have internal energies of 1.25, 1.14, 1.04, 0.91 and 0.82 eV, respectively (details in ESI†). The internal energy upon excitation is treated as the energy difference between pump photon energy and the adiabatic excitation energy, where the latter is the energy difference between the most stable structure in the ground state and the most stable structure in the Rydberg state. The internal vibrational energy is much higher than the estimated barrier between chair and twist, Fig. 7. Since the internal energy is quite high and the density of states is large, one can assume that the energy will be equipartitioned across the vibrational modes at long delay times. The molecules can then be described by effective vibrational temperatures that range between 669 K and 829 K for different pump laser wavelengths. The evaluation of the internal energy and the vibrational temperature are discussed in the ESI.†
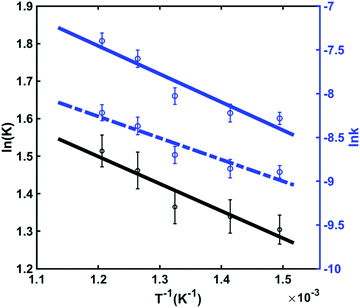
For thermodynamic systems in equilibrium, the Gibbs free energy change (ΔG) scales linearly with the natural logarithm of the equilibrium constant (K), the enthalpy change (ΔH) and the entropy change (ΔS) of the reaction:
ΔG = −RT![[thin space (1/6-em)]](https://www.rsc.org/images/entities/char_2009.gif) ln ln![[thin space (1/6-em)]](https://www.rsc.org/images/entities/char_2009.gif) K = ΔH − TΔS K = ΔH − TΔS | (3) |
![[thin space (1/6-em)]](https://www.rsc.org/images/entities/char_2009.gif) K vs. 1/T,
K vs. 1/T, | (4) |
These thermodynamics parameters can be compared to computed values. The enthalpy change (ΔH) corresponds to the energy difference between the chair and twist conformers in the 3s Rydberg state. From the spectral analysis we had derived a value of 39 meV from the potential energy surface, which is somewhat lower than the thermodynamic value, but within the error bars. The entropy change can be estimated as
 | (5) |
Although the energy of the twist conformer in the 3s Rydberg state is higher than that of the chair conformer (Fig. 7), the forward reaction of the transition from chair to twist nevertheless proceeds because of the favorable entropy change and the high temperature of the system in the excited state. The twist structure has a higher degeneracy factor and the potential energy well is shallower than in the chair form. Both imply a higher density of states and therefore higher entropy.
The time constant of the conformeric transition from chair to twist in the 3s state is described by τ2 in eqn (2), which decreases with increasing excitation photon energy. This conforms to the general principle that higher internal energies lead to fast reaction rates. To further explore the kinetic information of the transformation between the conformers, the following kinetic model is proposed (Scheme 1).
 | ||
| Scheme 1 The proposed kinetic model of the transformation between two spectral components, corresponding to the chair and twist conformers. | ||
The transformations between chair form and each twist form are modeled as parallel, competing and opposing first-order processes.48,49 Since Twist 1 and Twist 2 are the two symmetry equivalent-structures, k1 = k2 and k−1 = k−2. Therefore, the total reaction rate of the transformation from chair to twist conformer is [2k1 + k−1]. The value of k1/k−1 is obtained from half of the intensity ratio [twist]/[chair], i.e. ½K. With that, all kinetic parameters can be calculated (Table 5).
| Wavelength (nm) | k (1/τ2) (1011 s−1) | ½ K [Twist1]/[Chair] | k 1 (1011 s−1) | k −1 (1011 s−1) |
|---|---|---|---|---|
| 212 | 14.95 | 2.27 | 10.38 | 2.26 |
| 216 | 12.32 | 2.15 | 8.41 | 2.36 |
| 220 | 8.19 | 1.96 | 5.42 | 2.77 |
| 225 | 6.80 | 1.89 | 4.44 | 3.90 |
| 229 | 6.42 | 1.84 | 4.16 | 2.26 |
Using the Arrhenius equation49,50
 | (6) |
Conclusions
The structural dynamics of NMP have been explored by time-resolved RFS using different pump photon wavelengths. By analyzing the time-dependent dynamics we are able to derive the individual UV absorption spectra to 3s and 3p. Upon excitation from the ground state to the Rydberg states, the geometry of the amine moiety changes from pyramidal to planar. The sudden structural change launches a coherent wavepacket motion that gives rise to oscillatory features with periods of ∼700 fs that persist for several picoseconds. As these oscillations dephase, two peaks with BEs of 2.83 eV and 2.92 eV are formed with time constants ranging from 669 fs to 1557 fs depending on the pump photon wavelength.Aided by the DFT-SIC calculations, the oscillations are confirmed to be the nitrogen inversion motion of the amine group. The two 3s peaks observed after equilibrium is reached are assigned to the ring-twist and the chair conformers in the 3s Rydberg state. The calculation gives a binding energy difference of 0.09 eV between the two conformers. Also, a relative energy difference of 0.039 eV and a barrier of 0.132 eV for the reaction from the chair to the twist form are acquired from the 3s potential energy surface.
By analyzing the time dependent spectral information of the chair and twist conformers in 3s, the thermodynamic parameters of the transformation are revealed by a linear fit of Gibbs free energy equation with enthalpy of 62 meV and entropy of 19.70 J mol−1 K−1. By using the Arrhenius equation to analyze the kinetics between chair and twist conformers, the activation energies of the forward and backward reactions from chair to twist are determined to be 276 meV and 212 meV, respectively.
The ultrafast time-resolved Rydberg fingerprint spectroscopy of NMP with tunable pump wavelengths yields many interesting results. The decomposition of the UV absorption spectrum into different underlying and unresolved states opens a methodology that could be applied to other systems. In NMP we uncover an ultrafast conformational dynamics between ring conformers that is markedlly different from other systems in that the twist form is created with considerable probability. Tunability of the pump laser also allowed us to uncover the activation energy of the kinetic reaction. With the wealth of dynamic, kinetic and energetic information available on this system now, it will be instructive to apply scattering methods9,12,51–54 to detemine fully the excited state structures and the complete ultrafast dynamics.
Conflicts of interest
There are no conflicts to declare.Acknowledgements
This research was supported by the US Department of Energy, Office of Science, Basic Energy Sciences, under award no. DESC0017995.References
- E. Kleinpeter, Conformational analysis of saturated heterocyclic six-membered rings, Adv. Heterocycl. Chem., 2003, 86, 42–128 Search PubMed.
- C. S. Hansen, S. J. Blanksby, N. Chalyavi, E. J. Bieske, J. R. Reimers and A. J. Trevitt, Ultraviolet photodissociation action spectroscopy of the N-pyridinium cation, J. Chem. Phys., 2015, 142, 014301 CrossRef PubMed.
- A. L. Sobolewski, W. Domcke, C. Dedonder-Lardeux and C. Jouvet, Excited-state hydrogen detachment and hydrogen transfer driven by repulsive (1)pi sigma* states: A new paradigm for nonradiative decay in aromatic biomolecules, Phys. Chem. Chem. Phys., 2002, 4(7), 1093–1100 RSC.
- I. Usabiaga, J. Gonzalez, I. Leon, P. F. Arnaiz, E. J. Cocinero and J. A. Fernandez, Influence of the anomeric conformation in the intermolecular interactions of glucose, J. Phys. Chem. Lett., 2017, 8(6), 1147–1151 CrossRef CAS PubMed.
- B. Dhakal and D. Crich, Synthesis and stereocontrolled equatorially selective glycosylation reactions of a pseudaminic acid donor: Importance of the side-chain conformation and regioselective reduction of azide protecting groups, J. Am. Chem. Soc., 2018, 140(44), 15008–15015 CrossRef CAS PubMed.
- X. Cheng, Y. Zhang, E. Jónsson, H. Jónsson and P. M. Weber, Charge localization in a diamine cation provides a test of energy functionals and self-interaction correction, Nat. Commun., 2016, 7(1), 1–6 Search PubMed.
- R. Dsouza, X. X. Cheng, Z. Li, R. J. D. Miller and M. A. Kochman, Oscillatory photoelectron signal of N-methylmorpholine as a test case for the algebraic-diagrammatic construction method of second order, J. Phys. Chem. A, 2018, 122(50), 9688–9700 CrossRef CAS PubMed.
- A. E. Al-Snafi, Pharmacology and toxicology of Conium maculatum – A review, Pharm. Chem. J., 2016, 3(2), 136–142 CAS.
- B. Stankus, H. Yong, N. Zotev, J. M. Ruddock, D. Bellshaw, T. J. Lane, M. Liang, S. Boutet, S. Carbajo and J. S. Robinson, Ultrafast X-ray scattering reveals vibrational coherence following Rydberg excitation, Nat. Chem., 2019, 11(8), 716–721 CrossRef CAS PubMed.
- Y. Zhang, S. Deb, H. Jónsson and P. M. Weber, Observation of structural wavepacket motion: The umbrella mode in Rydberg-excited N-methyl morpholine, J. Phys. Chem. Lett., 2017, 8(16), 3740–3744 CrossRef CAS PubMed.
- S. Deb, X. Cheng and P. M. Weber, Structural dynamics and charge transfer in electronically excited N,N′-dimethylpiperazine, J. Phys. Chem. Lett., 2013, 4(16), 2780–2784 CrossRef CAS.
- H. Yong, X. Xu, J. M. Ruddock, B. Stankus, A. M. Carrascosa, N. Zotev, D. Bellshaw, W. Du, N. Goff and Y. Chang, et al., Ultrafast X-ray scattering offers a structural view of excited-state charge transfer, Proc. Natl. Acad. Sci. U. S. A., 2021, 118, e2021714118 CrossRef CAS PubMed.
- J. L. Gosselin and P. M. Weber, Rydberg fingerprint spectroscopy: A new spectroscopic tool with local and global structural sensitivity, J. Phys. Chem. A, 2005, 109(22), 4899–4904 CrossRef CAS PubMed.
- N. Kuthirummal and P. M. Weber, Rydberg states: Sensitive probes of molecular structure, Chem. Phys. Lett., 2003, 378(5–6), 647–653 CrossRef CAS.
- J. C. Bush, M. P. Minitti and P. M. Weber, Dissociative energy flow, vibrational energy redistribution, and conformeric structural dynamics in bifunctional amine model systems, J. Phys. Chem. A, 2010, 114(42), 11078–11084 CrossRef CAS PubMed.
- S. Deb, M. P. Minitti and P. M. Weber, Structural dynamics and energy flow in Rydberg-excited clusters of N,N-dimethylisopropylamine, J. Chem. Phys., 2011, 135(4), 044319 CrossRef PubMed.
- F. Rudakov and P. M. Weber, Ultrafast structural and isomerization dynamics in the Rydberg-exited Quadricyclane: Norbornadiene system, J. Chem. Phys., 2012, 136(13), 134303 CrossRef PubMed.
- N. Kuthirummal and P. M. Weber, Structure sensitive photoionization via Rydberg levels, J. Mol. Struct., 2006, 787(1-3), 163–166 CrossRef CAS.
- M. P. Minitti and P. M. Weber, Time-resolved conformational dynamics in hydrocarbon chains, Phys. Rev. Lett., 2007, 98(25), 253004 CrossRef PubMed.
- S. Deb, B. A. Bayes, M. P. Minitti and P. M. Weber, Structural dynamics in floppy systems: Ultrafast conformeric motions in Rydberg-excited triethylamine, J. Phys. Chem. A, 2011, 115(10), 1804–1809 CrossRef CAS PubMed.
- R. A. Jones, A. Katritzky, A. Richards, R. Wyatt, R. Bishop and L. Sutton, The conformational analysis of saturated heterocycles. Part XXII. Conformation of piperidine: Evidence and conclusions from dipole moment studies, J. Chem. Soc. B, 1970, 127–131 RSC.
- L. Carballeira and I. Pérez–Juste, Influence of calculation level and effect of methylation on axial/equatorial equilibria in piperidines, J. Comput. Chem., 1998, 19(8), 961–976 CrossRef CAS.
- D. Appleton, J. McKenna, J. McKenna, L. Sims and A. Walley, Lack of selectivity in the electrophilic addition of p-toluenesulfonylnitrene to tertiary amines. Conformational equilibrium in N-methylpiperidines, J. Am. Chem. Soc., 1976, 98(1), 292–293 CrossRef CAS.
- P. Crowley, M. Robinson and M. Ward, Conformational equilibrium in N-methylpiperidine, J. Chem. Soc., Chem. Commun., 1974, 20, 825–826 RSC.
- J. Eilers and A. Liberles, Quantum mechanical approach to conformational analysis, J. Am. Chem. Soc., 1975, 97(15), 4183–4188 CrossRef CAS.
- D. M. Ferguson, I. R. Gould, W. A. Glauser, S. Schroeder and P. A. Kollman, Comparison of ab initio, semiempirical, and molecular mechanics calculations for the conformational analysis of ring systems, J. Comput. Chem., 1992, 13(4), 525–532 CrossRef CAS.
- S. D. Carpenter, C. P. Schick and P. M. Weber, Experimental adaptive optimization of mass spectrometer ion optic voltages using a genetic algorithm, Rev. Sci. Instrum., 1999, 70(5), 2262–2267 CrossRef CAS.
- B. Kim, N. Thantu and P. M. Weber, High resolution photoelectron spectroscopy: The vibrational spectrum of the 2-aminopyridine cation, J. Chem. Phys., 1992, 97(8), 5384–5391 CrossRef CAS.
- Y. Zhang, H. Jónsson and P. M. Weber, Coherence in nonradiative transitions: Internal conversion in Rydberg-excited N-methyl and N-ethyl morpholine, Phys. Chem. Chem. Phys., 2017, 19(38), 26403–26411 RSC.
- M. J. Frisch; G. Trucks; H. Schlegel; G. Scuseria; M. Robb; J. Cheeseman; G. Scalmani; V. Barone; B. Mennucci and G. Petersson, Gaussian 09, Revision D. 01, Gaussian. Inc., Wallingford, CT, 2009 Search PubMed.
- A. D. Becke, Becke's three parameter hybrid method using the LYP correlation functional, J. Chem. Phys., 1993, 98, 5648–5652 CrossRef CAS.
- R. Dennington; T. Keith and J. Millam, GaussView, version 5, Semichem Inc., Shawnee Mission, KS, 2009 Search PubMed.
- J. P. Perdew and A. Zunger, Self-interaction correction to density-functional approximations for many-electron systems, Phys. Rev. B: Condens. Matter Mater. Phys., 1981, 23(10), 5048 CrossRef CAS.
- J. e. Enkovaara, C. Rostgaard, J. J. Mortensen, J. Chen, M. Dułak, L. Ferrighi, J. Gavnholt, C. Glinsvad, V. Haikola and H. Hansen, Electronic structure calculations with GPAW: A real-space implementation of the projector augmented-wave method, J. Phys.: Condens. Matter, 2010, 22(25), 253202 CrossRef CAS PubMed.
- J. J. Mortensen, L. B. Hansen and K. W. Jacobsen, Real-space grid implementation of the projector augmented wave method, Phys. Rev. B: Condens. Matter Mater. Phys., 2005, 71(3), 035109 CrossRef.
- X. Cheng, Y. Zhang, S. Deb, M. P. Minitti, Y. Gao, H. Jónsson and P. M. Weber, Ultrafast structural dynamics in Rydberg excited N,N,N′,N′-tetramethylethylenediamine: Conformation dependent electron lone pair interaction and charge delocalization, Chem. Sci., 2014, 5(11), 4394–4403 RSC.
- H. Gudmundsdóttir, Y. Zhang, P. M. Weber and H. Jónsson, Self-interaction corrected density functional calculations of molecular Rydberg states, J. Chem. Phys., 2013, 139(19), 194102 CrossRef PubMed.
- H. Gudmundsdóttir, Y. Zhang, P. M. Weber and H. Jónsson, Self-interaction corrected density functional calculations of Rydberg states of molecular clusters: N,N-Dimethylisopropylamine, J. Chem. Phys., 2014, 141(23), 234308 CrossRef PubMed.
- W. Kohn and L. J. Sham, Self-consistent equations including exchange and correlation effects, Phys. Rev., 1965, 140(4A), A1133 CrossRef.
- J. P. Perdew, K. Burke and M. Ernzerhof, Generalized gradient approximation made simple, Phys. Rev. Lett., 1996, 77(18), 3865 CrossRef CAS PubMed.
- J. Gavnholt, T. Olsen, M. Engelund and J. Schiøtz, Δ self-consistent field method to obtain potential energy surfaces of excited molecules on surfaces, Phys. Rev. B: Condens. Matter Mater. Phys., 2008, 78(7), 075441 CrossRef.
- J. D. Cardoza, F. M. Rudakov and P. M. Weber, Electronic spectroscopy and ultrafast energy relaxation pathways in the lowest Rydberg states of trimethylamine, J. Phys. Chem. A, 2008, 112(43), 10736–10743 CrossRef CAS PubMed.
- M. D. J. Waters, W. P. Du, A. M. Carrascosa, B. Stankus, M. Cacciarini, P. M. Weber and T. I. Solling, Transient symmetry controls photo dynamics near conical intersections, J. Phys. Chem. Lett., 2021, 12(38), 9220–9225 CrossRef CAS PubMed.
- L. B. Klein, J. O. F. Thompson, S. W. Crane, L. Saalbach, T. I. Solling, M. J. Paterson and D. Townsend, Ultrafast relaxation dynamics of electronically excited piperidine: Ionization signatures of Rydberg/valence evolution, Phys. Chem. Chem. Phys., 2016, 18(36), 25070–25079 RSC.
- X. J. Qiu, J. Y. Long, Z. M. Liu and B. Zhang, Direct imaging of the ultrafast internal conversion in isolated piperidine, Chem. Phys. Lett., 2016, 645, 133–137 CrossRef CAS.
- J. O. F. Thompson, L. B. Klein, T. I. Solling, M. J. Paterson and D. Townsend, The role of novel Rydberg-valence behaviour in the non-adiabatic dynamics of tertiary aliphatic amines, Chem. Sci., 2016, 7, 1826–1839 RSC.
- J. M. Ruddock, N. Zotev, B. Stankus, H. Yong, D. Bellshaw, S. Boutet, T. J. Lane, M. Liang, S. Carbajo and W. Du, et al., Simplicity beneath complexity: Counting molecular electrons reveals transients and kinetics of photodissociation reactions, Angew. Chem., 2019, 131(19), 6437–6441 CrossRef.
- D. McQuarrie, Statistical mechanics, University Science Books, Sausalito, CA, 2000 Search PubMed.
- P. L. Houston, Chemical Kinetics and Reaction Dynamics, McGraw-Hill, New York, 2001 Search PubMed.
- K. J. Laidler, Chemical Kinetics, Harper & Row, New York, 3rd edn, 1987 Search PubMed.
- M. Minitti, J. Budarz, A. Kirrander, J. Robinson, D. Ratner, T. Lane, D. Zhu, J. Glownia, M. Kozina and H. Lemke, et al., Imaging molecular motion: Femtosecond X-ray scattering of an electrocyclic chemical reaction, Phys. Rev. Lett., 2015, 114(25), 255501 CrossRef CAS PubMed.
- J. M. Ruddock, H. Yong, B. Stankus, W. Du, N. Goff, Y. Chang, A. Odate, A. M. Carrascosa, D. Bellshaw and N. Zotev, et al., A deep UV trigger for ground-state ring-opening dynamics of 1,3-cyclohexadiene, Sci. Adv., 2019, 5, eaax6625 CrossRef CAS PubMed.
- M. R. Ware, J. M. Glownia, N. Al-Sayyad, J. T. O'Neal and P. H. Bucksbaum, Characterizing dissociative motion in time-resolved X-ray scattering from gas-phase diatomic molecules, Phys. Rev. A, 2019, 100(3), 033413 CrossRef CAS.
- H. Yong, N. Zotev, J. M. Ruddock, B. Stankus, M. Simmermacher, A. M. Carrascosa, W. Du, N. Goff, Y. Chang and D. Bellshaw, et al., Observation of the molecular response to light upon photoexcitation, Nat. Commun., 2020, 11, 2157 CrossRef CAS PubMed.
Footnotes |
| † Electronic supplementary information (ESI) available. See DOI: 10.1039/d1cp04236j |
| ‡ Present address: Department of Chemistry, University of California, Irvine, California 92697, USA. |
| This journal is © the Owner Societies 2021 |

