 Open Access Article
Creative Commons Attribution 3.0 Unported Licence
Ratiometric electrochemical detection of β-galactosidase†
Sam A.
Spring
 ,
Sean
Goggins
 * and
Christopher G.
Frost

Department of Chemistry, University of Bath, Bath, BA2 7AY, UK. E-mail: s.goggins@bath.ac.uk; Fax: +44 (0)1225 386231; Tel: +44 (0)1225 386142
First published on 22nd August 2017
Abstract
A novel ferrocene-based substrate for the ratiometric electrochemical detection of β-galactosidase was designed and synthesised. It was demonstrated to be an excellent electrochemical substrate for β-Gal detection with sensitivity as low as 0.1 U mL−1.
β-Galactosidase (β-Gal, EC 3.2.1.23) is a prominent enzyme used biologically as a reporter gene as it has been well characterised and demonstrates excellent stability.1 The low level of background substrate hydrolysis and ready availability makes β-Gal an attractive enzyme label within enzyme-linked immunosorbent assays (ELISAs).2 It can also be used in heavy-metal ion detection,3 and rapid enzyme assays have been used in the detection of coliform and E. coli in waste water treatment.4 β-Gal is typically detected either chromogenically, using ortho-nitrophenyl-β-galactoside (ONPG),3 or 5-bromo-4-chloro-3-indoyl-β-D-galactopyranoside (X-Gal),5 or is detected fluorometrically using fluorescein-di-β-D-galactopyranoside (FDG).6 Lanthanide based coumarins have also been utilised as a luminescent probe in the detection of β-Gal.7 Optical substrates however, are limited by the use of expensive equipment, non-linear fluorescence, and potentially high levels of background signal.1 The development of electrochemical enzyme substrates allows for the direct conversion of a biochemical recognition event into an electrical signal enabling facile biosensor integration within a handheld device.8 4-Aminophenyl-β-D-galactosidase (PAPG) is standardly used as an electrochemical substrate for β-Gal, but high background signals prevents accurate analysis at low enzyme concentrations.9 A modified PAPG-style substrate, 4-methoxyphenyl-β-D-galactosidase (4-MPGal) has a negligible background signal, but the unfavourable use of modified graphene oxide electrodes is required.10
Due to its facile oxidation potential and excellent synthetic utility, ferrocene is implemented as the redox-active moiety in electrochemical probes,11,12 with ferrocene derivatives widely used in biological systems due to their stability in aerobic and aqueous environments.13 The development of ratiometric probes has overcome the issues of reproducibility, by the ability to obtain direct conversions, minimising both sampling errors and systematic errors from instrument variation.14 Ferrocene-based ratiometric chemodosimeters for enzyme detection have previously been reported for alkaline phosphatase,15 and glucose oxidase,16 but none currently for β-Gal.
Ferrocene-based electrochemical sensing is a continuing interest within our research group as it enables an inexpensive and convenient way to monitor enzyme activity.17 Utilising trigger–linker–effector methodologies,18 we designed ferrocenylcarbamoylphenyl-β-D-galactosidase 1 as a ratiometric electrochemical substrate for β-Gal. Previously, ferrocenylamine 3 has been shown to be oxidised at a lower potential than carbamate derivatives.12 Substrate 1 would have a higher oxidation potential than 3 making them electrochemically distinguishable, allowing for the ratiometric electrochemical analysis of β-Gal activity. We propose that in the presence of β-Gal, hydrolysis at the anomeric position would afford an unstable phenolate intermediate 2. 1,6-Elimination would follow releasing ferrocenylamine 3, quinone methide and CO2 (Scheme 2).
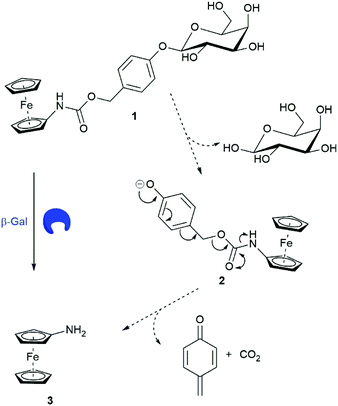 | ||
| Scheme 2 Structure of substrate 1 and the proposed mechanism of β-Gal catalysed breakdown with subsequent release of ferrocenylamine 3. | ||
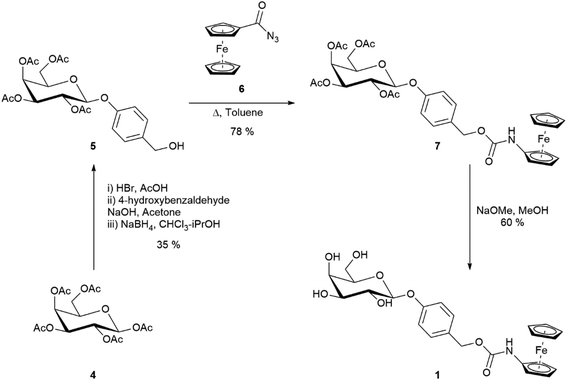
The synthesis of substrate 1 (Scheme 1) started from the commercially available D-galactose pentaacetate which was converted to benzyl alcohol 5 (see ESI† for synthesis). Ferrocenoyl azide 6 was synthesised according to a literature procedure,19 and then coupled to the benzyl alcohol via a Curtius rearrangement. Zemplén deacetylation of 7 afforded the desired substrate 1 in a 16% overall yield. Once synthesised, substrate 1 was found to be a bench stable orange solid with no observable degradation over several months at room temperature. Substrate 1 was also stable to hydrolysis in Tris buffer (pH 7, 50 mM) solutions for several weeks at room temperature (see ESI, Fig. S1†). The electrochemical behaviour of substrate 1 was tested via differential pulse voltammetry (DPV) and compared to ferrocenylamine 3.
As expected, substrate 1 had a higher oxidation potential than ferrocenylamine 3, with the difference between the two peaks being approximately 250 mV and were completely resolved which allowed for the peaks to be integrated independently (Fig. 1). The conversion of substrate 1 was calculated using eqn (1).
 | (1) |
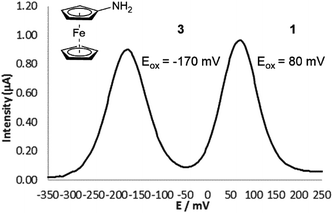 | ||
| Fig. 1 Differential pulse voltammogram obtained for substrate 1 (0.1 mM) and ferrocenylamine 3 (0.1 mM) in 50 mM pH 7 Tris buffer. | ||
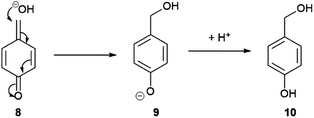
Substrate 1 (0.1 mM) was initially subjected to varying concentrations of β-Gal in Tris buffer (pH 9, 50 mM) at room temperature (21 °C) and subjected to electrochemical analysis every 3 minutes for 60 minutes (see ESI, Fig. S2†). The voltammogram of each sample was then integrated and conversions calculated using eqn (1). At high β-Gal concentrations, 5 and 10 U mL−1,20 quantitative conversion was observed within 18 minutes, and 60 minutes for 1 U mL−1. Pleasingly, no background substrate hydrolysis was observed in the absence of β-Gal allowing for a β-Gal concentration as low as 0.1 U mL−1 to be detected within 60 minutes. Intriguingly, the presence of a third peak was present in the voltammogram at 390 mV (see ESI, Fig. S3†). This was confirmed to be 4-hydroxybenzyl alcohol 10, formed when quinone methide 8, produced as a by-product from the result of self-immolation, reacts with water or hydroxide (Scheme 3).21 Despite being produced in an equimolar concentration as ferrocenylamine 3, the peak obtained was still significantly smaller than the ferrocene peaks showing the clear benefit of using the organometallic redox label compared with other commonly used organic ones.
Next, the effect of pH was investigated (see ESI, Fig. S4†). A β-Gal concentration of 1 U mL−1 was chosen as it allowed for both positive and negative effects due to the pH to be observed. At pH 8 there was a significant increase in the rate of conversion, with quantitative conversion observed in under 30 minutes. There was a marginal increase in rate from pH 8 to pH 7, but importantly, at the lower pH the presence of the third peak was suppressed, presumably due to protonation of the electrochemically active phenolate ion 9. The suppression of the peak produced a cleaner voltammogram, allowing for more accurate conversion to be calculated and as a result, pH 7 was used moving forward.
According to previous literature, the optimum working temperature for β-Gal is 37 °C.22 A lower β-Gal concentration was chosen, specifically 0.1 U mL−1 in Tris buffer (pH 7, 50 mM) (see ESI, Fig. S5†), to allow for changes in the rate of conversion to be noticeable. Interestingly, increasing the temperature from room temperature had minimal effect on the rate of conversion, and above 37 °C the rate was retarded. At 57 °C negligible conversion was observed due to denaturing of the enzyme. Substrate 1, however, remained stable to hydrolysis even at elevated temperatures, exhibiting the high stability of the substrate. With no improved rate of conversion, the assays were continued to be conducted at room temperature (21 °C).
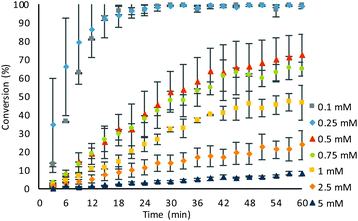
The concentration of substrate 1 in the assay was then screened, utilising a β-Gal concentration of 1 U mL−1 (Fig. 2). Increasing the probe concentration to 0.25 mM from 0.1 mM had minimal effects on the rate of conversion with quantitative conversion still observed within 24 minutes. However, increasing the concentration further showed no discernible increase in the rate of reaction. When the substrate concentration was decreased to 0.05 mM, the reduced current observed was susceptible to artefacts on the voltammogram affecting accurate conversion calculations, which were unavoidable when using disposable screen-printed carbon graphite electrode cells. At concentrations above 0.1 mM, additional sample manipulation, via serial dilutions, was required before analysis, due to overloading of the electrodes, and therefore, an optimal substrate concentration of 0.1 mM was chosen.
The final condition to be optimised was the buffer system used. Other common β-Gal buffer systems such as potassium phosphate buffer (50 mM, pH 7),3 and Z-buffer (50 mM, pH 7), were tested. Z-buffer exhibited significant background signal, potentially due to the thiols present in Z-buffer, that obscured the peaks and prevented accurate electrochemical analysis. In phosphate buffer the stability of ferrocenylamine 3 was diminished with a second peak forming at a higher oxidation potential, assumed to be an electroactive by-product from ferrocenylamine decomposition.23 Tris buffer (pH 7) was therefore chosen as this maintained a low background and ensured ferrocenylamine stability, and the effect of buffer concentration was investigated using a β-Gal concentration of 1 U mL−1 (see ESI, Fig. S6†). In unbuffered solution, the rate of conversion was significantly improved compared to 50 mM Tris buffer solution, however, the voltammogram peaks were shifted to a lower oxidation potential. At this lower potential, the presence of voltammogramatic artefacts prevented accurate detection. At 25 mM Tris buffer concentration, a comparable rate of conversion to 50 mM Tris buffer concentration with quantitative conversion observed in 18 minutes. Further analysis showed that β-Gal was unstable at the lower buffer concentration, with increases in conversions stopping after 18 minutes. Increasing the concentration of the Tris buffer above 50 mM prevented accurate ratiometric analysis as we suspect the reduced stability of ferrocenylamine 3 resulted in unreliable peak integrations. Therefore, a Tris buffer (pH 7, 50 mM) was selected as the optimal buffer concentration.
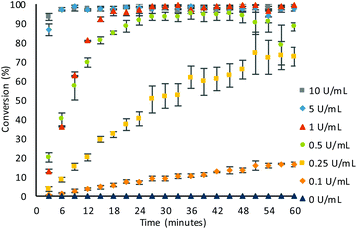
With optimal conditions obtained, the sensitivity of β-Gal was tested (Fig. 3). In the optimised conditions, there was no background hydrolysis observed, allowing for detection of low β-Gal concentration of 0.1 U mL−1 within 60 minutes. Utilising pseudo-first order kinetics (see ESI, Fig. S7†), a rate constant of 2.91 × 10⁻³ s−1 was calculated for a β-Gal concentration of 1 U mL−1. At higher concentrations of 10 and 5 U mL−1, quantitative conversions were exhibited within just 6 minutes, and at a low concentration of 0.25 U mL−1, a 73 ± 5% conversion was achieved within 60 minutes, with an observed rate constant of 0.044 × 10⁻³ s−1. The small error bars afforded, indicate the good reliability showing the benefit of using ratiometric electrochemical analysis.
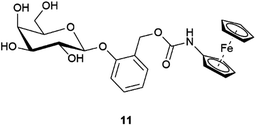
It has been previously shown that β-Gal has a large tolerance to the aglycon, as long as the D-galactose moiety remains untouched.24 To further explore how the sterics of the substrate could impact β-Gal activity, substrate 11 was synthesised (Fig. 4), and tested utilising the optimal conditions (see ESI, Fig. S8†). Comparatively, substrate 11, was significantly slower than substrate 1. At low β-Gal concentration of 0.1 U mL−1 a conversion of 12 ± 6% within 60 minutes, compared to a conversion of 16 ± 1% for substrate 1. The calculated rate constants of 0.04 × 10⁻³ s−1 and 0.06 × 10⁻³ s−1 for substrate 11 and 1 respectively (see ESI, Fig. S9†), show only a small difference in rate between the two regioisomers. This difference in rate of hydrolysis, is more significant at 1 U mL−1 concentrations, where the rate constant for substrate 1, 2.91 × 10⁻³ s−1, is an order of magnitude higher than for substrate 11, 0.14 × 10⁻³ s−1. The increased steric bulk around the anomeric position in substrate 11 inhibits the rate of hydrolysis, indicating the suitability of substrate 1.
In conclusion, we have developed a new ferrocene-based electrochemical substrate for the detection of β-galactosidase activity. The substrate with a D-galactopyranoside trigger was synthesised and was distinguishable from the product electrochemically via differential pulse voltammetry. The substrate was shown to be stable to background hydrolysis, was demonstrated to be sensitive to low concentrations of β-galactosidase and shown to be both reproducible and reliable which makes β-galactosidase sensing applicable to electrochemical point-of-care biosensors.
Conflicts of interest
There are no conflicts to declare.Notes and references
- (a) J. Alam and J. L. Cook, Anal. Biochem., 1990, 188, 245 CrossRef CAS PubMed; (b) L. H. Naylor, Biochem. Pharmacol., 1999, 58, 749 CrossRef CAS PubMed.
- Z. Liu, T. Gurlo and H. von Grafenstein, J. Immunol. Methods, 2000, 234, 153 CrossRef.
- S. M. Z. Hossain and J. D. Brenna, Anal. Chem., 2011, 83, 8772 CrossRef CAS PubMed.
- (a) L. Fiksdal and I. Tryland, Curr. Opin. Biotechnol., 2008, 19, 289 CrossRef CAS PubMed; (b) J. C. Jokerst, J. A. Adkins, B. Bisha, M. M. Mentele, L. D. Goodridge and C. S. Henry, Anal. Chem., 2012, 84, 2900 CrossRef CAS PubMed.
- J. Kiernan, Biotech. Histochem., 2007, 82, 73 CrossRef CAS PubMed.
- B. Rotman, J. A. Zderic and M. Edelstein, Proc. Natl. Acad. Sci. U. S. A., 1963, 50, 1 CrossRef CAS.
- E. Pershagen and K. E. Borbas, Angew. Chem., Int. Ed., 2015, 54, 1787 CrossRef CAS PubMed.
- J. Wang, Biosens. Bioelectron., 2006, 21, 1887 CrossRef CAS PubMed.
- D. Wang, J. Chen and S. R. Nugen, Anal. Chem., 2017, 89, 1650 CrossRef CAS PubMed.
- K. Manibalan, V. Mani, C.-H. Huang, S.-T. Huang and P.-C. Chang, Analyst, 2015, 140, 6040 RSC.
- (a) P. D. Beer, Chem. Soc. Rev., 1989, 18, 409 RSC; (b) P. D. Beer, P. A. Gale and G. Z. Chen, Coord. Chem. Rev., 1999, 185, 3 CrossRef; (c) D. Kang, F. Ricci, R. J. White and K. W. Plaxco, Anal. Chem., 2016, 88, 10452 CrossRef CAS PubMed.
- A. Sagi, J. Rishpon and D. Shabat, Anal. Chem., 2005, 78, 1459 CrossRef PubMed.
- D. R. van Staveren and N. Metzler-Nolte, Chem. Rev., 2004, 104, 5931 CrossRef CAS PubMed.
- Y. Du, B. J. Lim, B. Li, Y. S. Jiang, J. L. Sessler and A. D. Ellington, Anal. Chem., 2014, 86, 8010 CrossRef CAS PubMed.
- S. Goggins, C. Naz, B. J. Marsh and C. G. Frost, Chem. Commun., 2015, 51, 561 RSC.
- S. Goggins, E. A. Apsey, M. F. Mahon and C. G. Frost, Org. Biomol. Chem., 2017, 15, 2459 CAS.
- (a) S. C. Hillier, C. G. Frost, A. T. A. Jenkins, H. T. Braven, R. W. Keay, S. E. Flower and J. M. Clarkson, Bioelectrochemistry, 2004, 63, 307 CrossRef CAS PubMed; (b) S. C. Hillier, S. E. Flower, C. G. Frost, A. T. A. Jenkins, R. Keay, H. Braven and J. M. Clarkson, Electrochem. Commun., 2004, 6, 1227 CrossRef CAS; (c) B. J. Marsh, L. Hampton, S. Goggins and C. G. Frost, New J. Chem., 2014, 38, 5260 RSC.
- (a) R. J. Amir, N. Pessah, M. Shamis and D. Shabat, Angew. Chem., Int. Ed., 2003, 42, 4494 CrossRef CAS PubMed; (b) E. Sella and D. Shabat, J. Am. Chem. Soc., 2009, 131, 9934 CrossRef CAS PubMed.
- D. C. D. Butler and C. J. Richards, Organometallics, 2002, 21, 5433 CrossRef CAS.
- U mL−1 = Units per millilitre. Where one unit will hydrolyse 1.0 micromole of O-nitrophenyl-β-D-galactoside to O-nitrophenol and D-galactose per minute at pH 7.3 at 37 °C.
- M. G. Willcockson, M. M. Toteva and V. J. Stella, J. Pharm. Sci., 2013, 102, 3579 CrossRef CAS PubMed.
- K. Wallenfels and R. Weil, in The Enzymes, ed. P. D. Boyer, Academic Press, New York, 3rd edn, 1972, vol. 20, p. 617 Search PubMed.
- (a) H. Hagen, P. Marzenell, E. Jentzsch, F. Wenz, M. R. Veldwijk and A. Mokhir, J. Med. Chem., 2012, 55, 924 CrossRef CAS PubMed; (b) P. Marzenell, H. Hagen, L. Sellner, T. Zeng, R. Grinyte, V. Pavlov, S. Daum and A. Mokhir, J. Med. Chem., 2013, 56, 6935 CrossRef CAS PubMed; (c) M. Schikora, A. Reznikov, L. Chaykovskaya, O. Sachinska, L. Polyakova and A. Mokhir, Bioorg. Med. Chem. Lett., 2015, 25, 3447 CrossRef CAS PubMed.
- P. Fernandez, F. J. Cañada, J. Jiménez-Barbero and M. Martín-Lomas, Carbohydr. Res., 1995, 271, 31 CrossRef CAS PubMed.
Footnote |
| † Electronic supplementary information (ESI) available: Experimental procedures, characterisation data, and copies of NMR spectra of synthesised compounds. See DOI: 10.1039/c7ob01593c |
| This journal is © The Royal Society of Chemistry 2017 |

